
The stock index futures continue to wedge higher as the divergences build with the next near-term sell signals pending breakdowns below all of these 60-minute uptrend lines on /ES, /NQ & /RTY. Near-term sell signal on /ES or SPY pending a break below the secondary B.O.D. (benefit of the doubt) uptrend line + 3022 support level with a min. target of 2980ish.
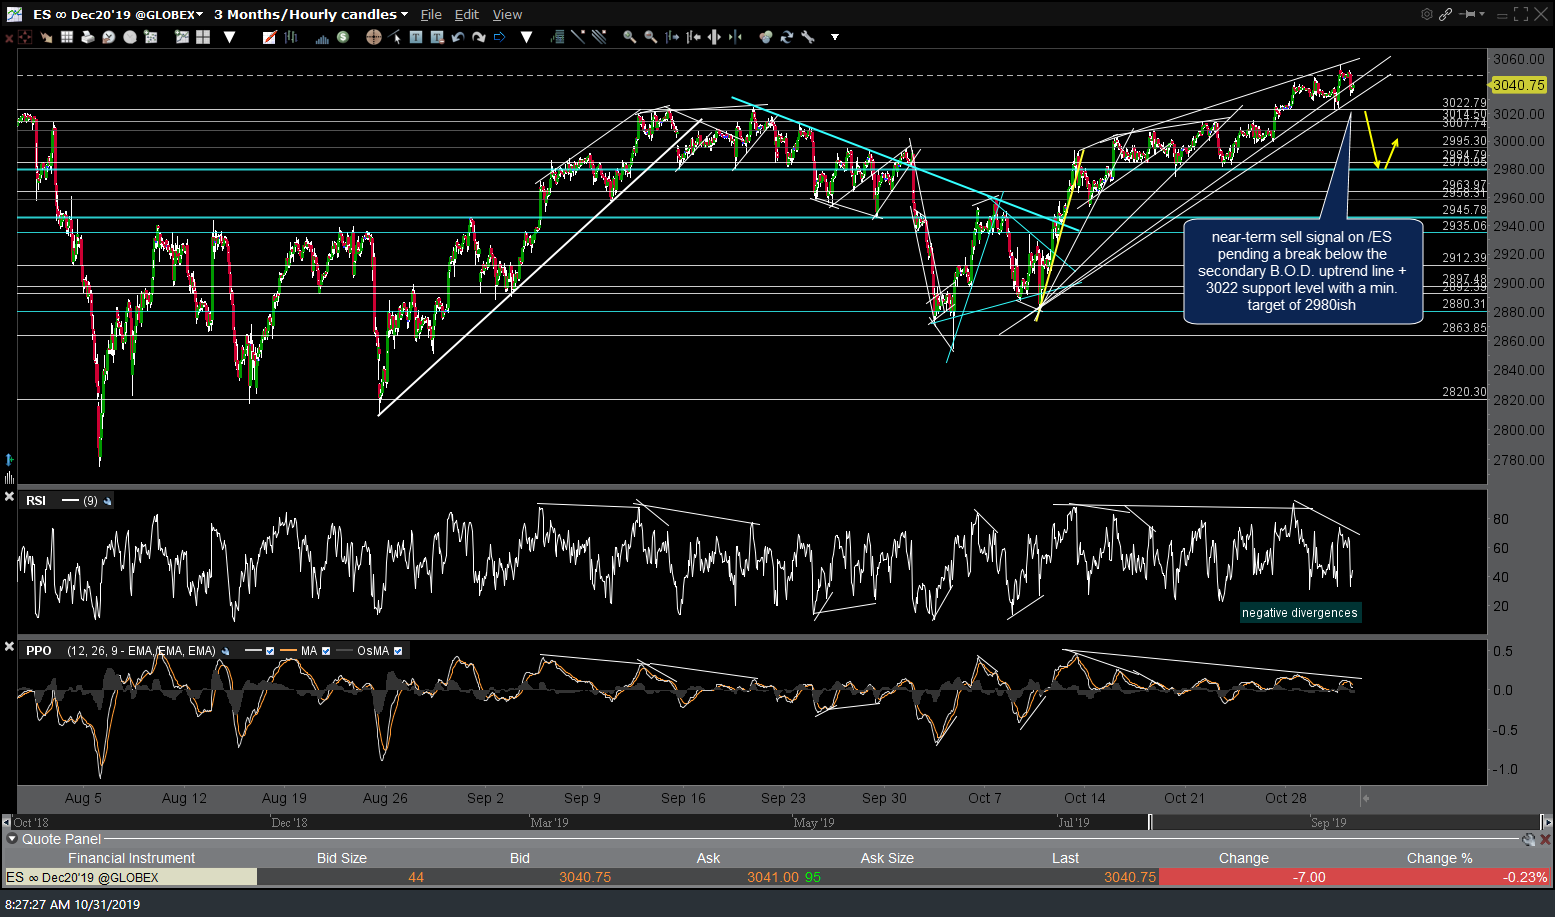
ES 60m Oct 31st
Near-term sell signal on /NQ or QQQ pending a break below this 60m uptrend line + the 8040 support level with a minimum target of 7980.
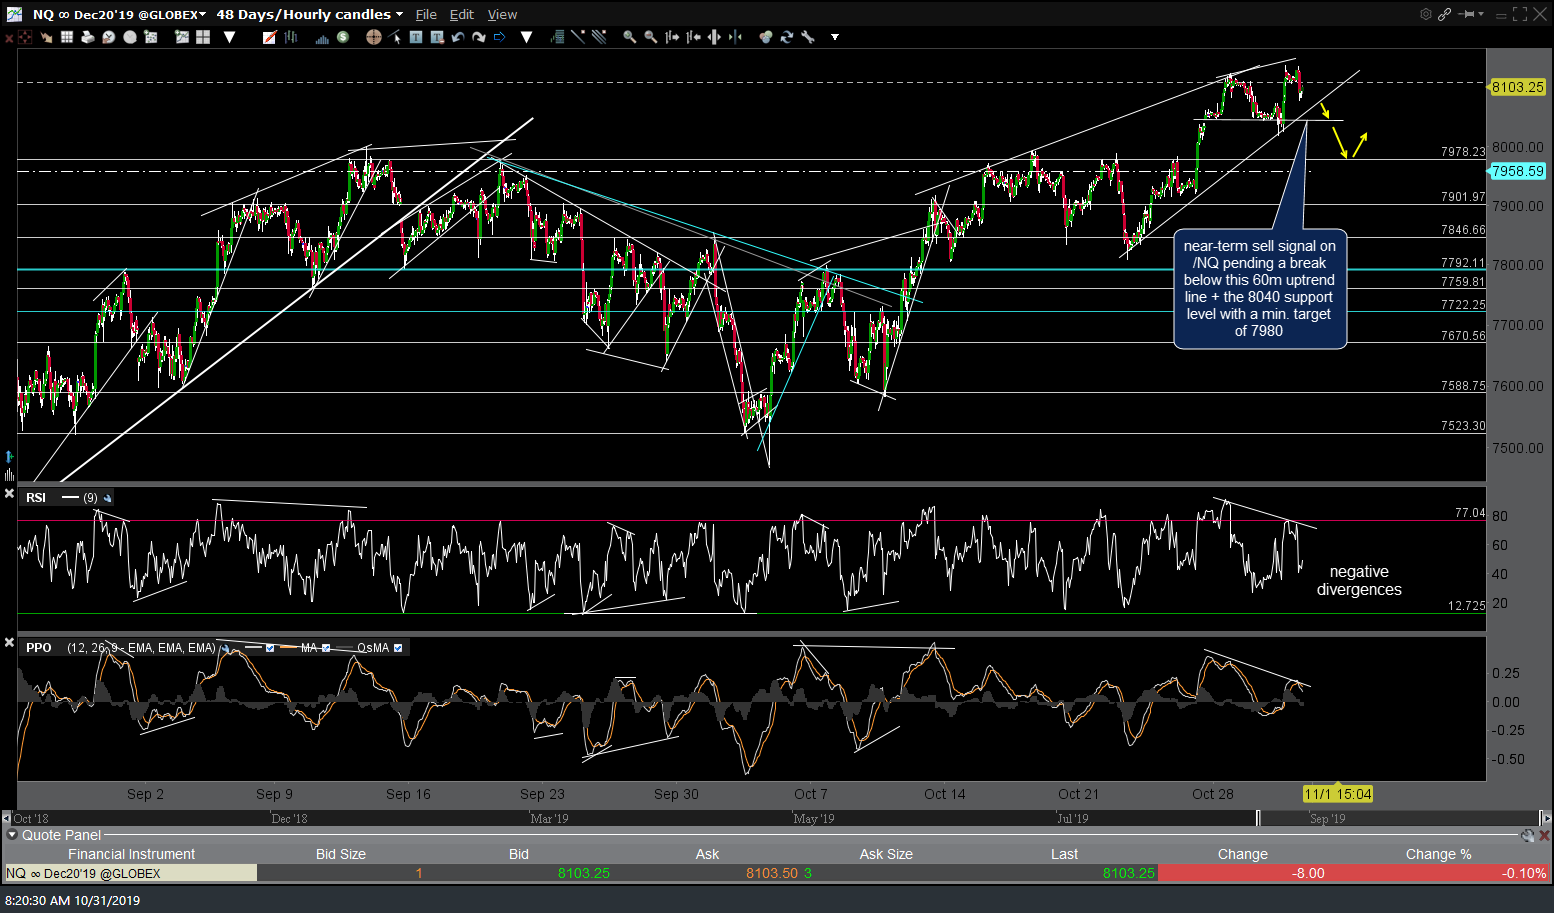
NQ 60m Oct 31st
/RTY or IWM sell signal to come on a break below this trendline & ideally the comparable trendlines on /ES & /NQ as well.
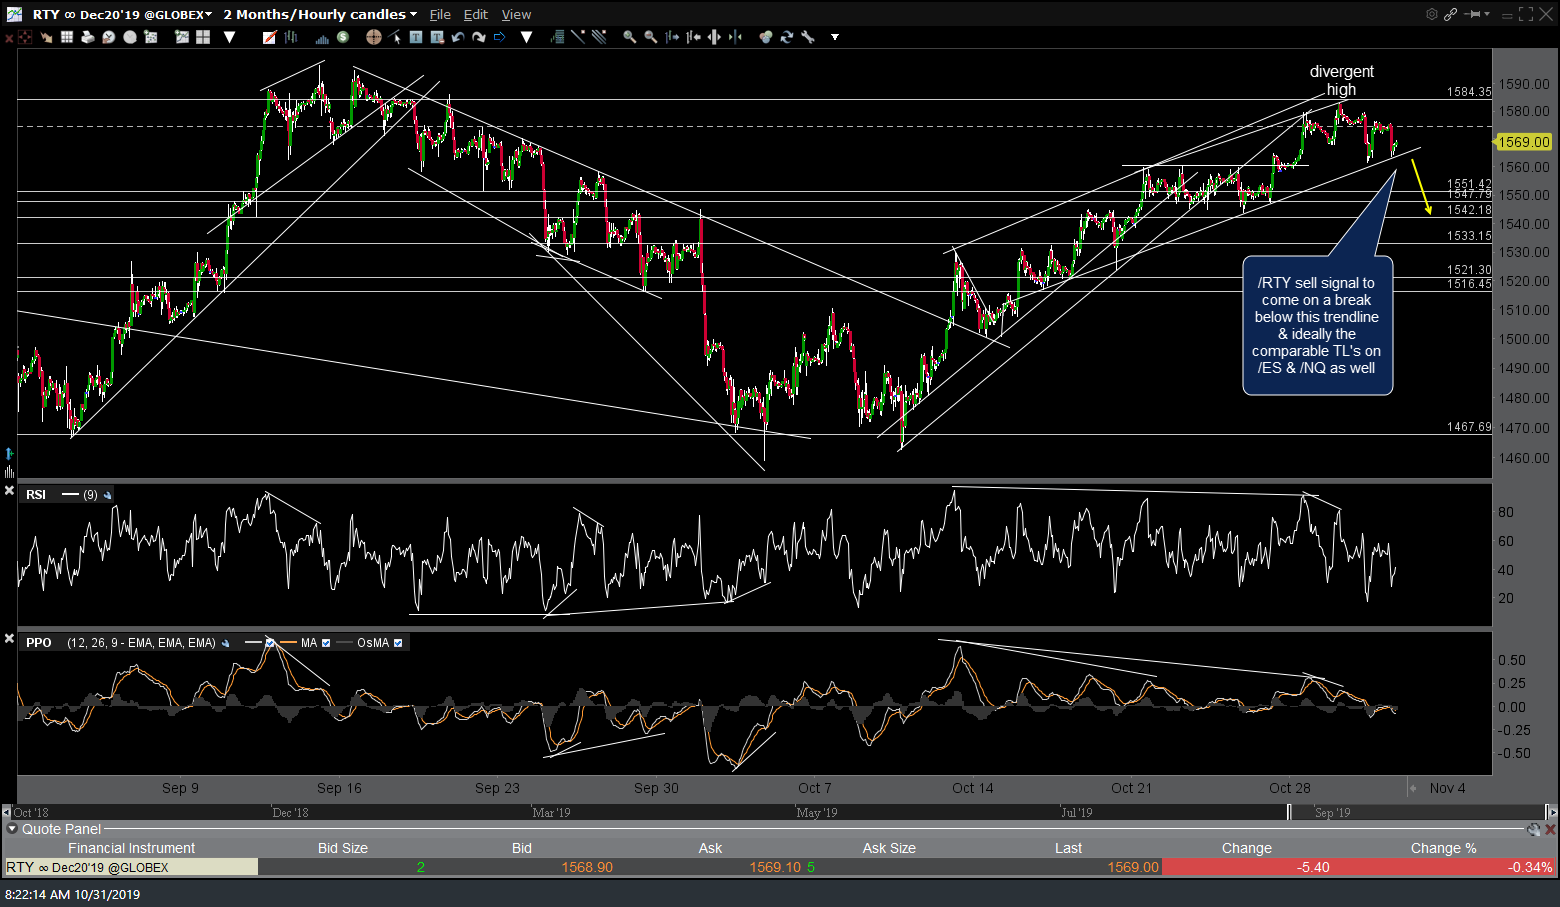
RTY 60m Oct 31st
The risk-off assets, gold & Treasury bonds, continue to catch a bid following the recent divergent low + reversal off support on /ZB (30-yr T-Bond futures) and the triangle/downtrend line breakout on /GC gold futures. Following a few pre-FOMC whipsaw signals, /GC gold has broken out above the top of the large triangle pattern/upper-most downtrend line on this 60-minute chart but still remains near the lower-half of the multi-month consolidation range. Next buy signal on /GC or GLD to come on a break above 1522 with the next buy signal on /ZB or TLT to come on a break above 161’043.
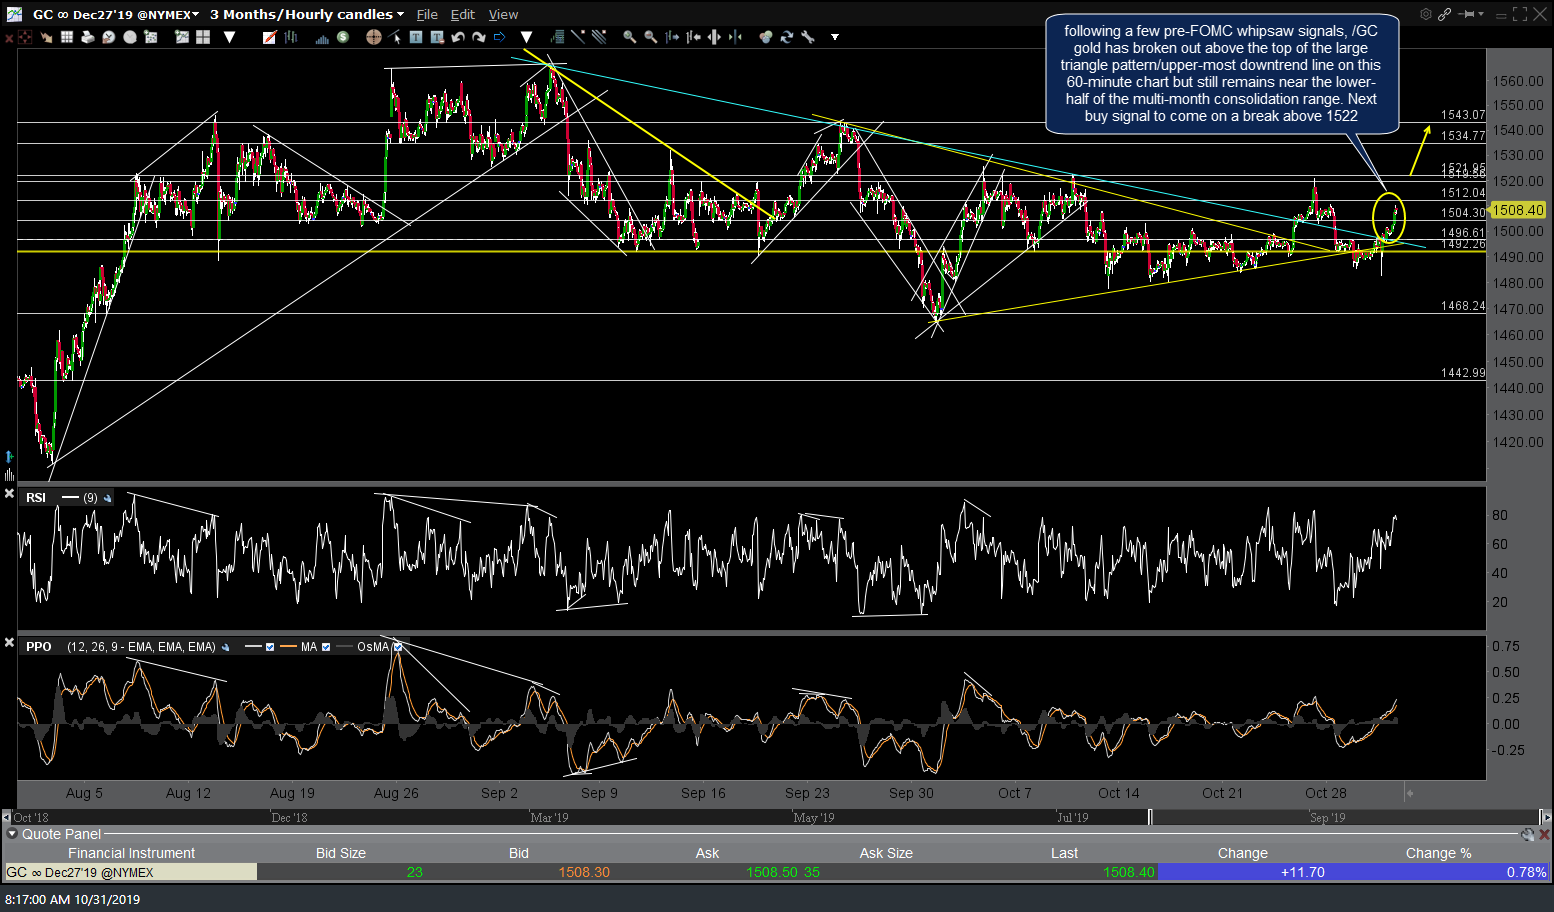
GC 60m Oct 31st

ZB 60m Oct 31st
/CL crude futures or UWT still offers an objective long entry here at the lower to the two parallel uptrend lines with a stop just below the 53.79 support.
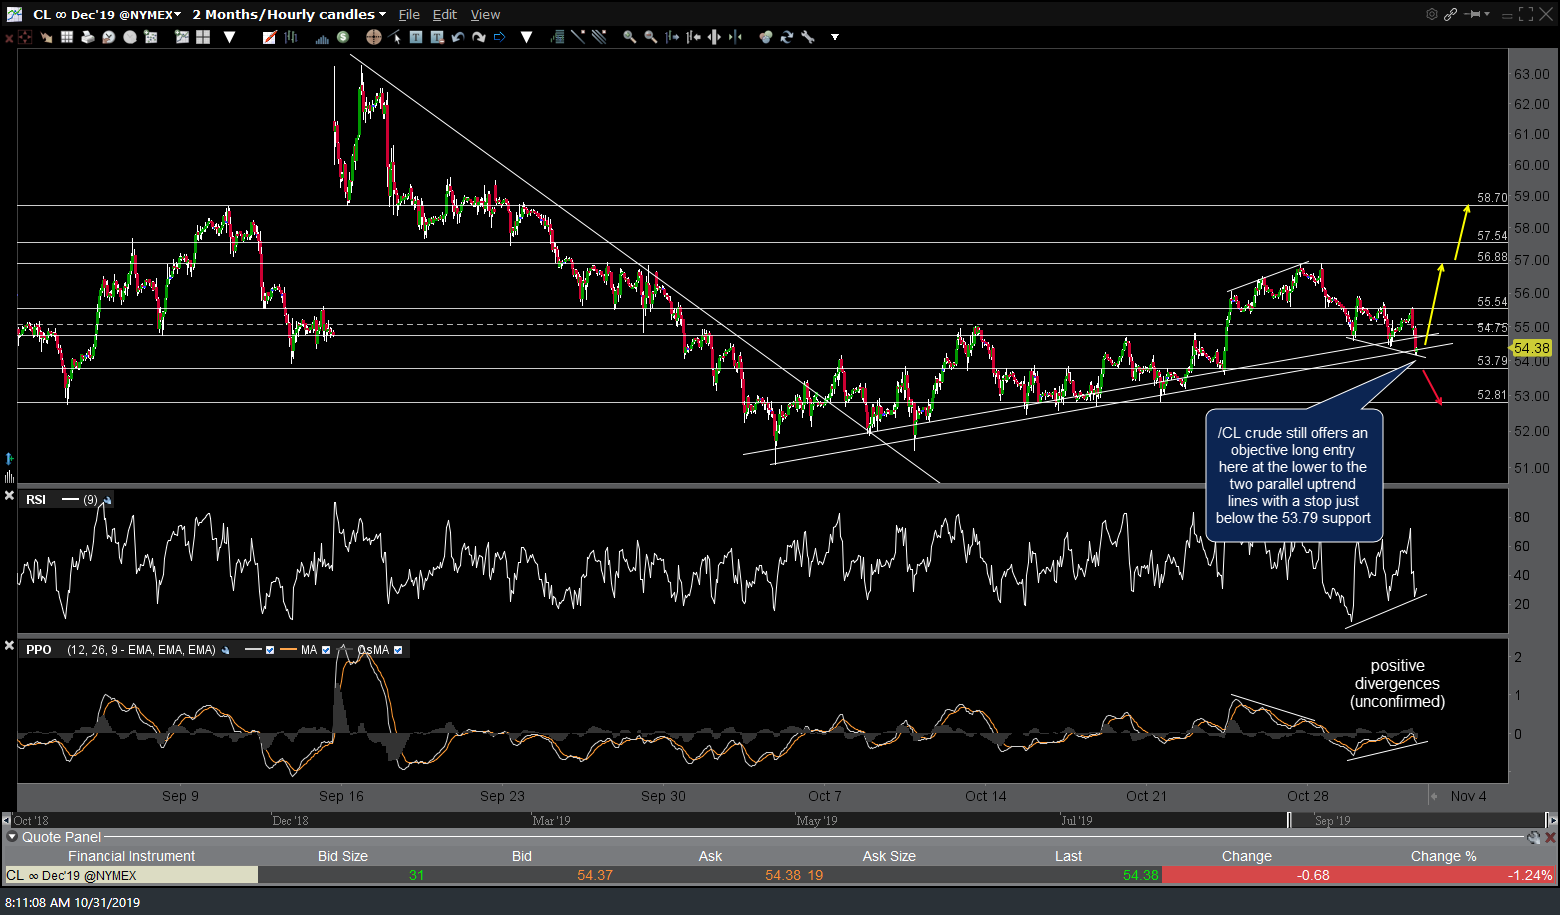
CL 60m Oct 31st
/E7 has continued to offer multiple objective long entries or add-ons to an existing position on pullbacks to this previously highlighted 60m uptrend line following the divergent low & breakout/ first buy signal back at the beginning of October. Next buy signal for /E7, FXE or UDN to come on a solid break & close above the 1.12ish resistance level.
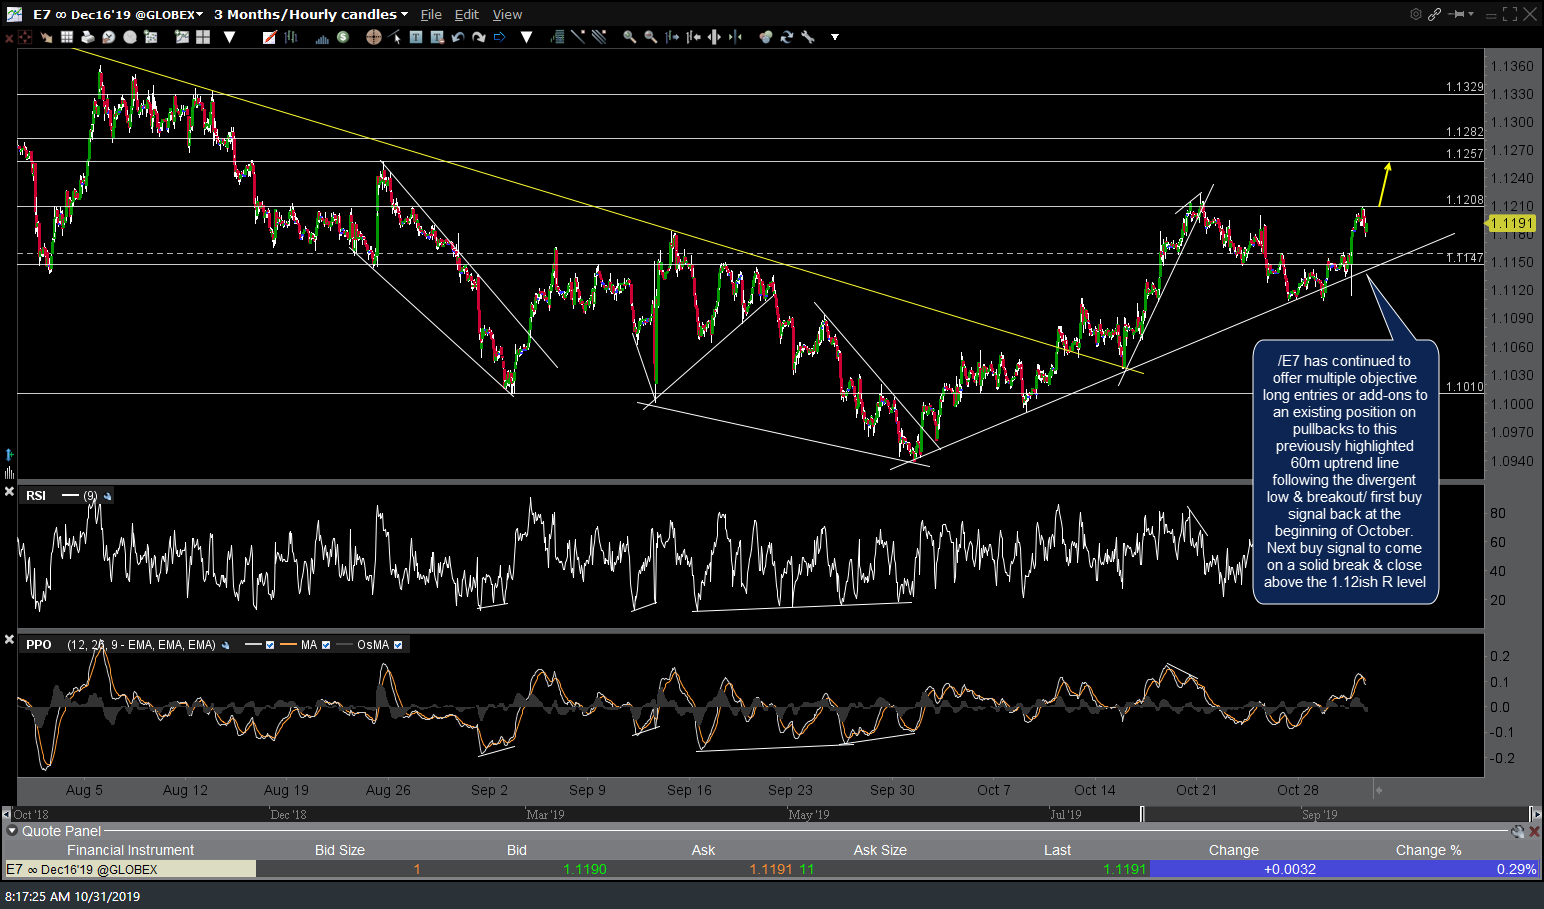
E7 60m Oct 31st
/NG nat gas continues to wedge higher while testing the 2.711ish resistance level over the past few sessions with today’s inventory report at 10:30 a possible catalyst for a breakdown of this 60m rising wedge pattern. If so, minimum price target is 2.640.
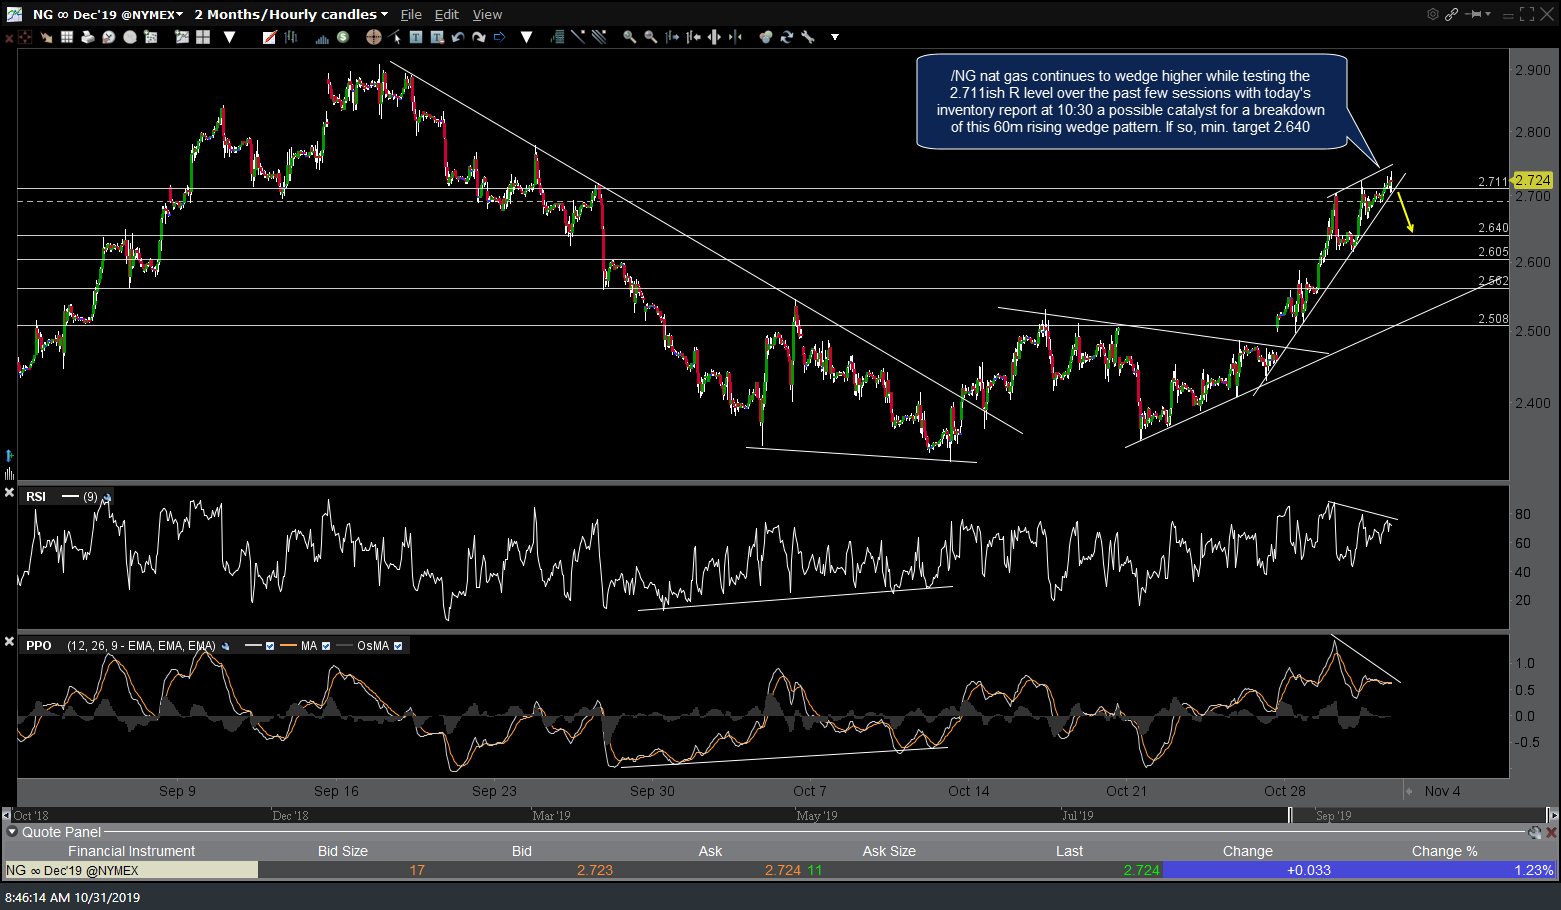
NG 60m Oct 31st