
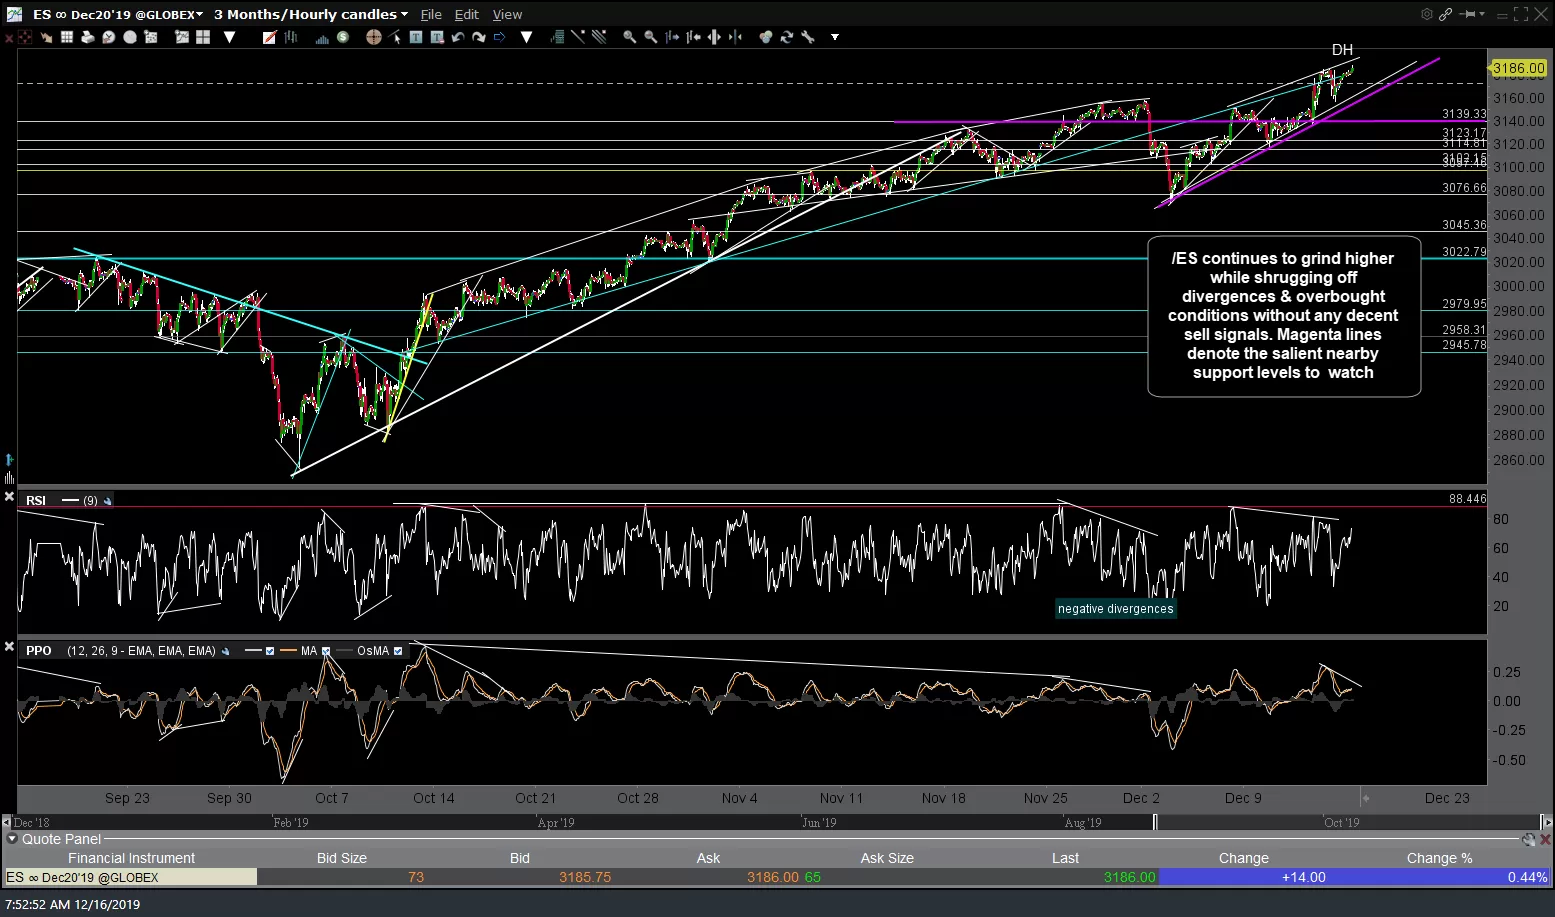
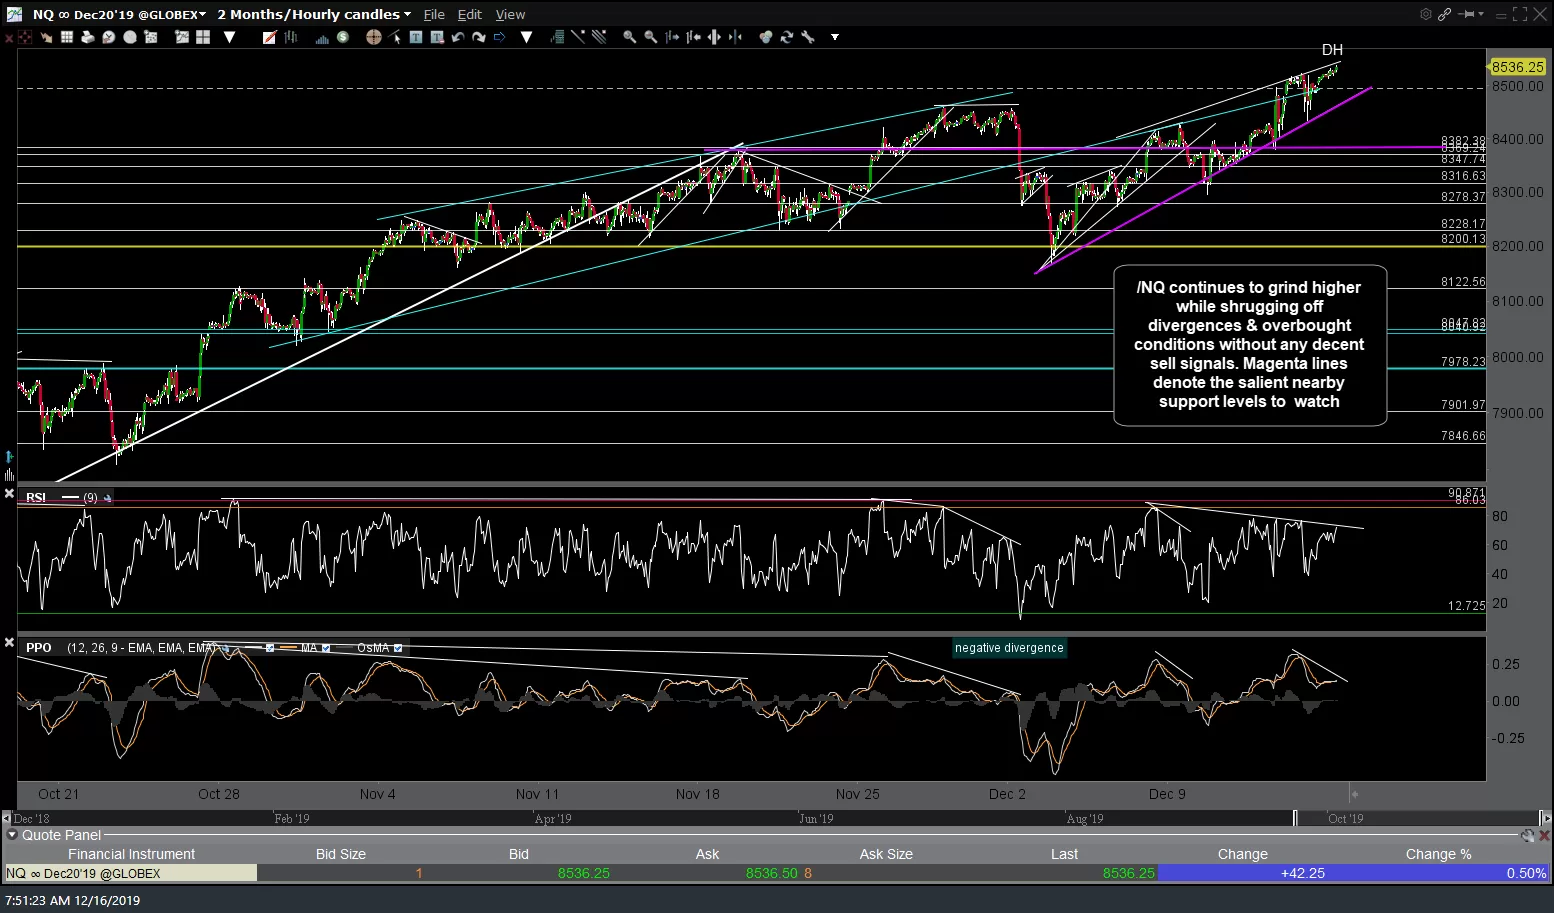
While it almost seems trite to continue posting any charts of the major stock indexes as they just continue to grind higher in a solid uptrend while shrugging off divergences & overbought conditions without any decent sell signals, FWIW, the magenta lines denote the salient nearby support levels to watch should the most recent divergences & overbought conditions result in a pullback anytime soon. 60-minute charts of /ES & /NQ below.
-
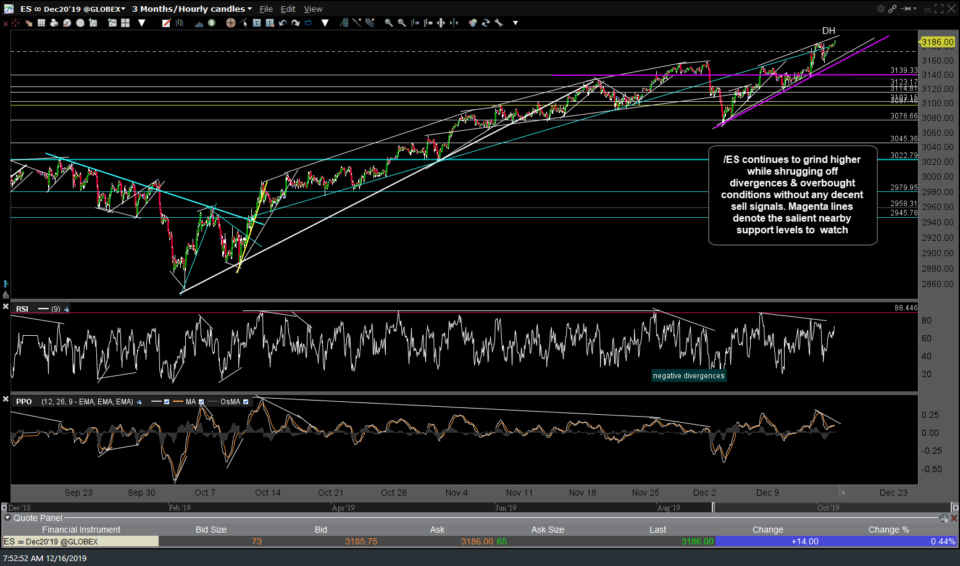
- ES 60m Dec 16th
-
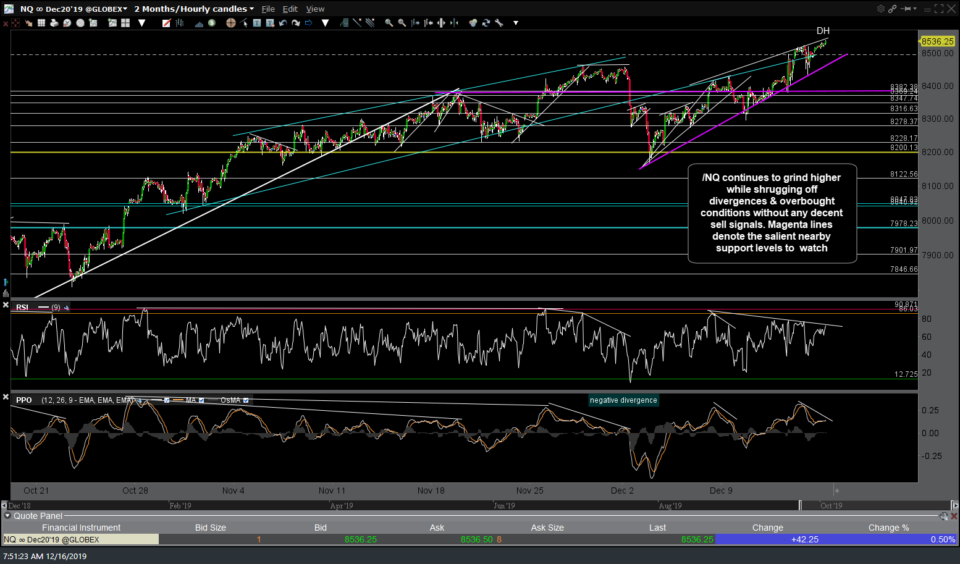
- NQ 60m Dec 16th
Palladium might be worth keeping an eye on today as it put in what could potentially prove to be a potential buying climax on a channel overshoot and divergent high along with a bearish engulfing candlestick on PALL (palladium ETF) on Friday. Bearish engulfing candlesticks that occur after an extended advance (bullish trend) are potential topping candlesticks although I like to see at least one or two follow-up red candles in the following sessions.
-
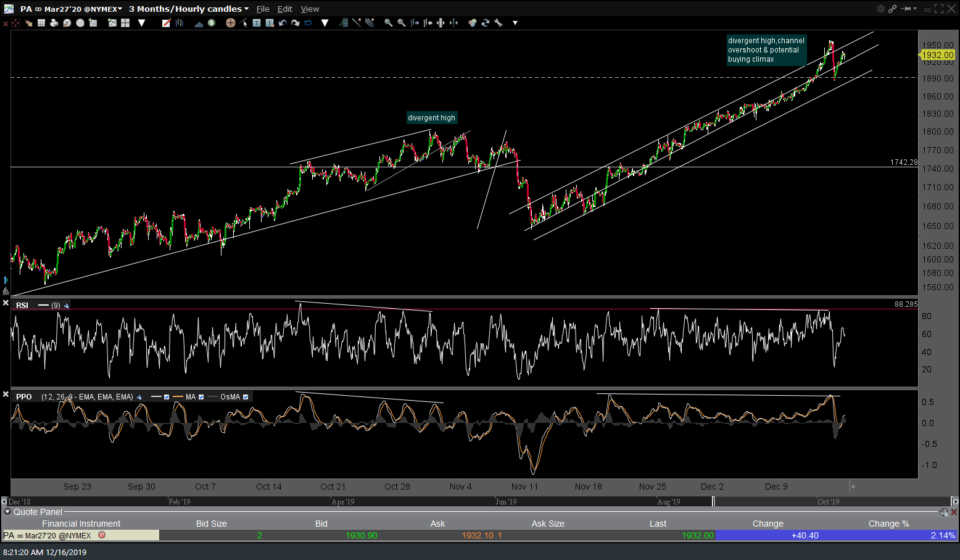
- PA 60m Dec 16th

-
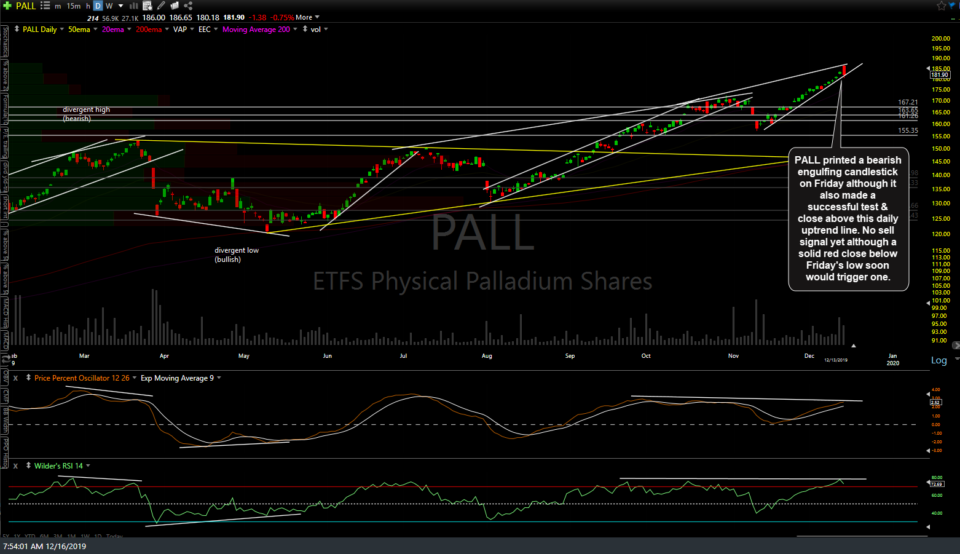
- PALL daily Dec 16th
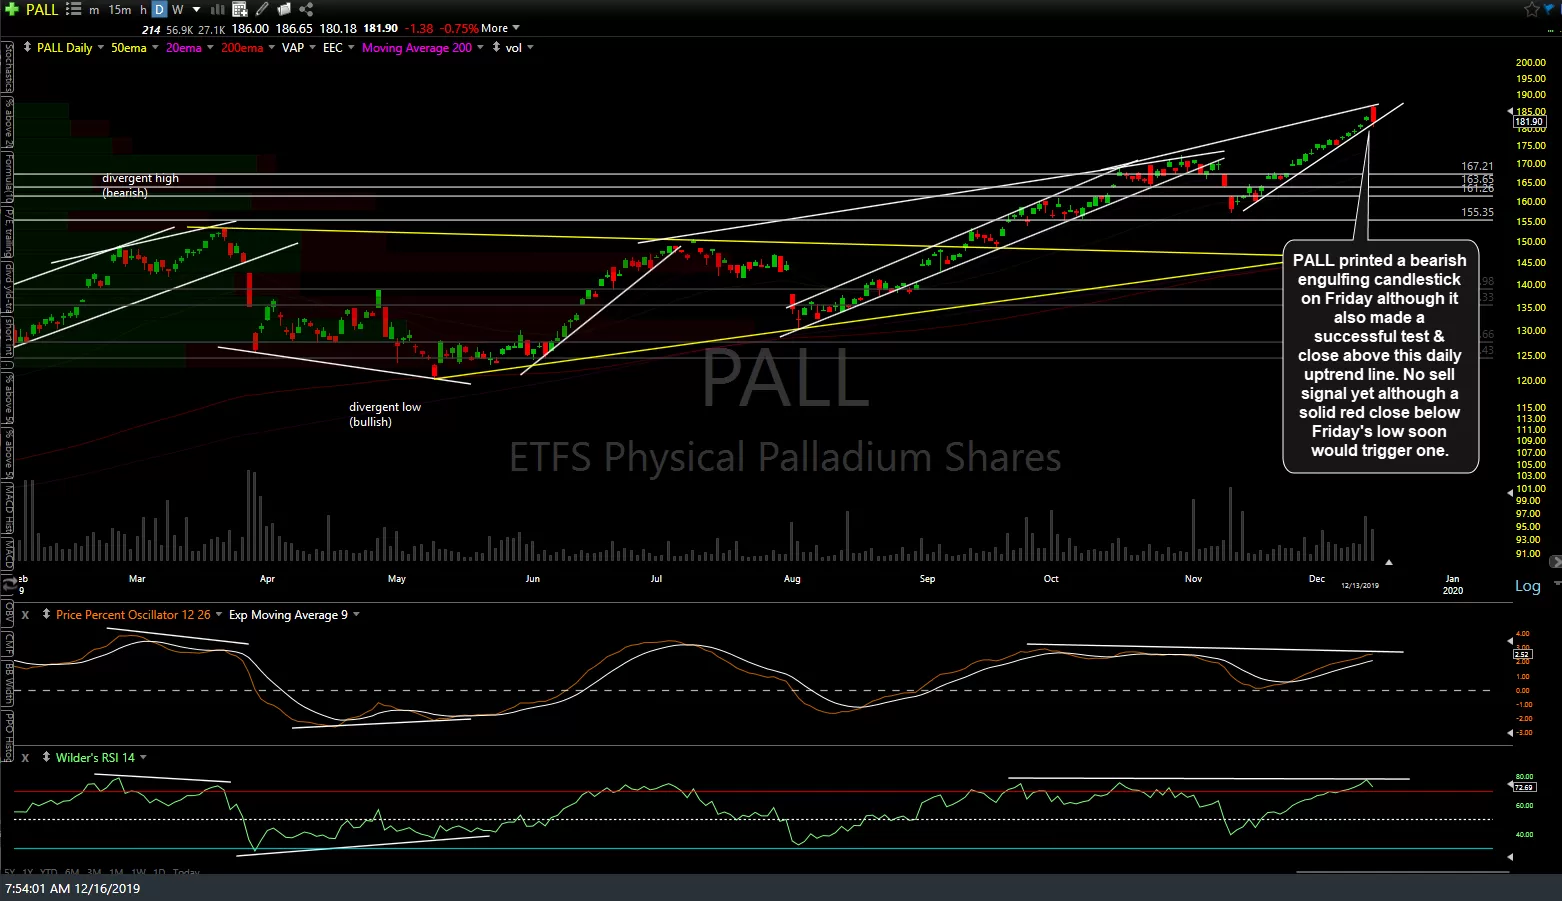
PALL fell to & successfully held uptrend line support on Friday & as of now, /PA is trading +2.14% as of 8:25 am EST so barring a sharp reversal & red close well below Friday’s low, palladium remains in an uptrend without any sell signals. /PA (futures) 60-minute chart & PALL daily charts above.
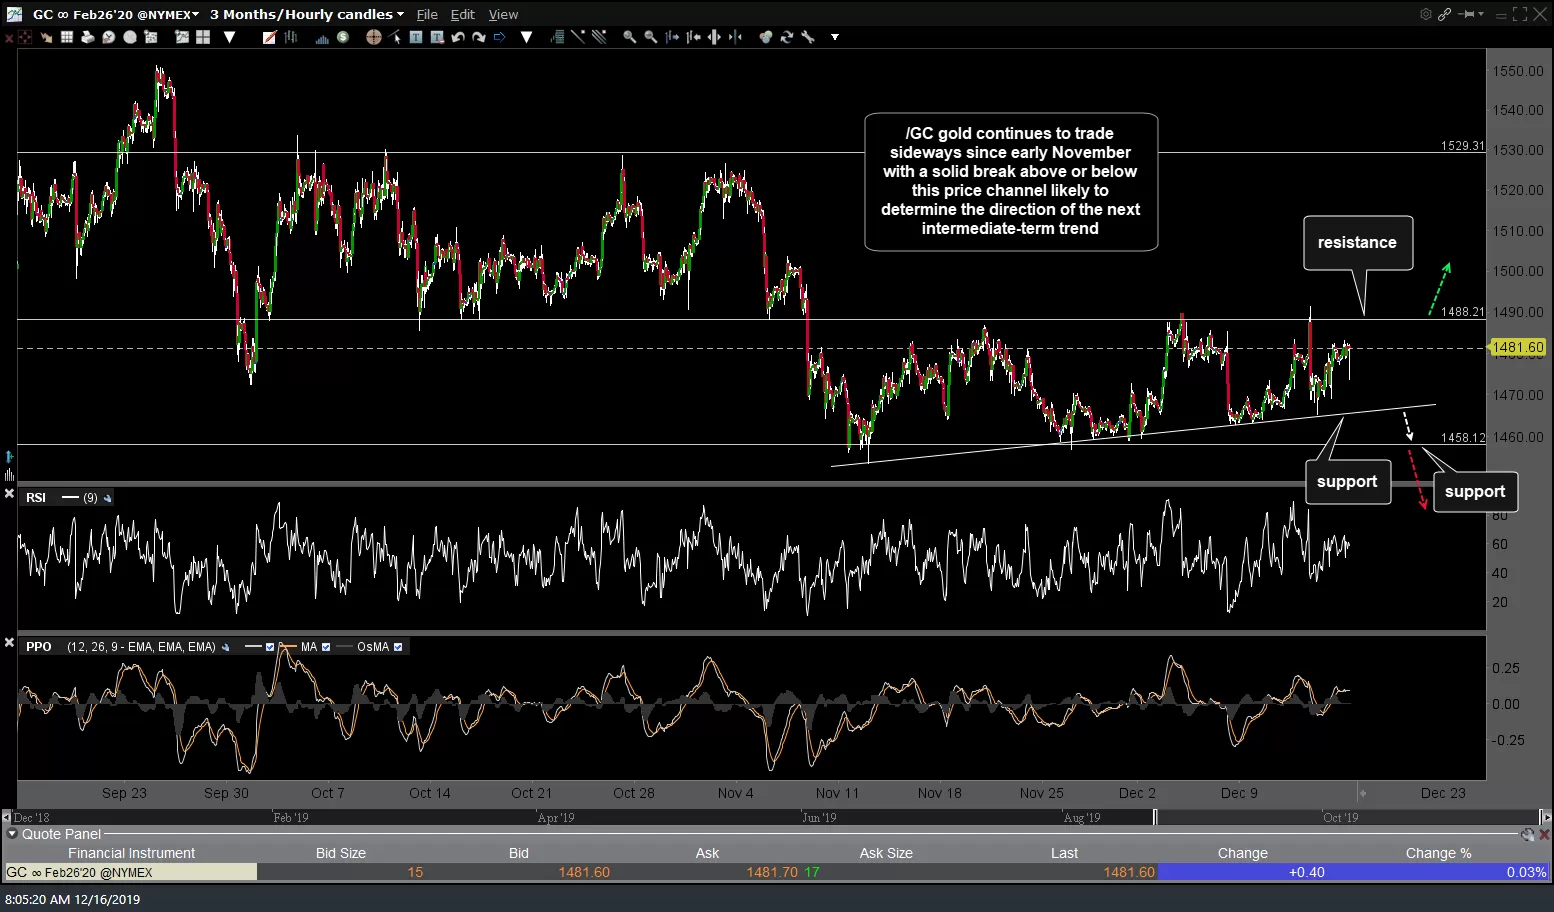
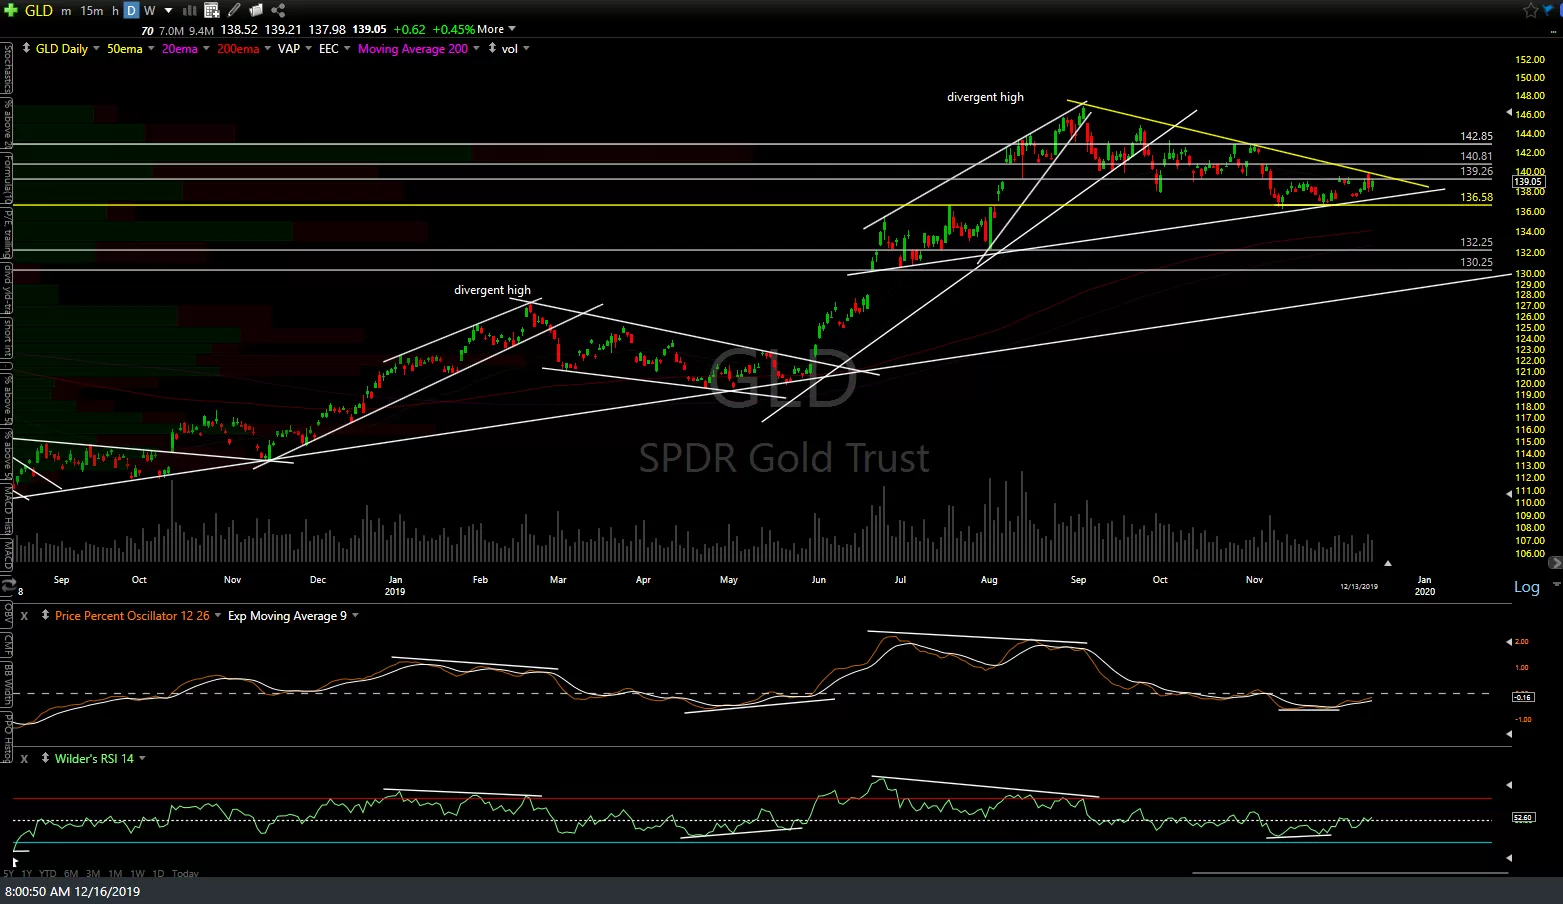
/GC gold continues to trade sideways since early November with a solid break above or below this price channel (1490ish – 1455ish, first chart below) likely to determine the direction of the next intermediate-term trend. GLD is also wedging below downtrend line resistance & the 136.58ish support with a break above or below those levels also likely to spark the next rally or correction (daily chart below).
-

- GC 60m Dec 16th
-
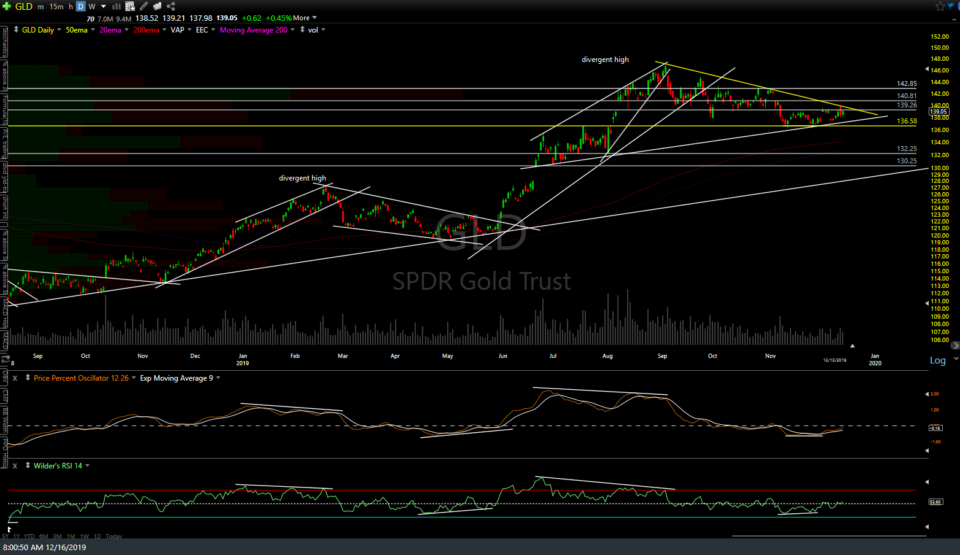
- GLD daily Dec 16th
Whether gold breaks to the upside or downside of this recent trading range will likely depend on where the US Dollar goes from here as the price of gold tends to be inversely correlated with the US Dollar. /DX US Dollar futures cracking below trendline support although still holding above the 96.434ish support for now with the next sell signal to come on a solid break below that level. 60-minute chart below.
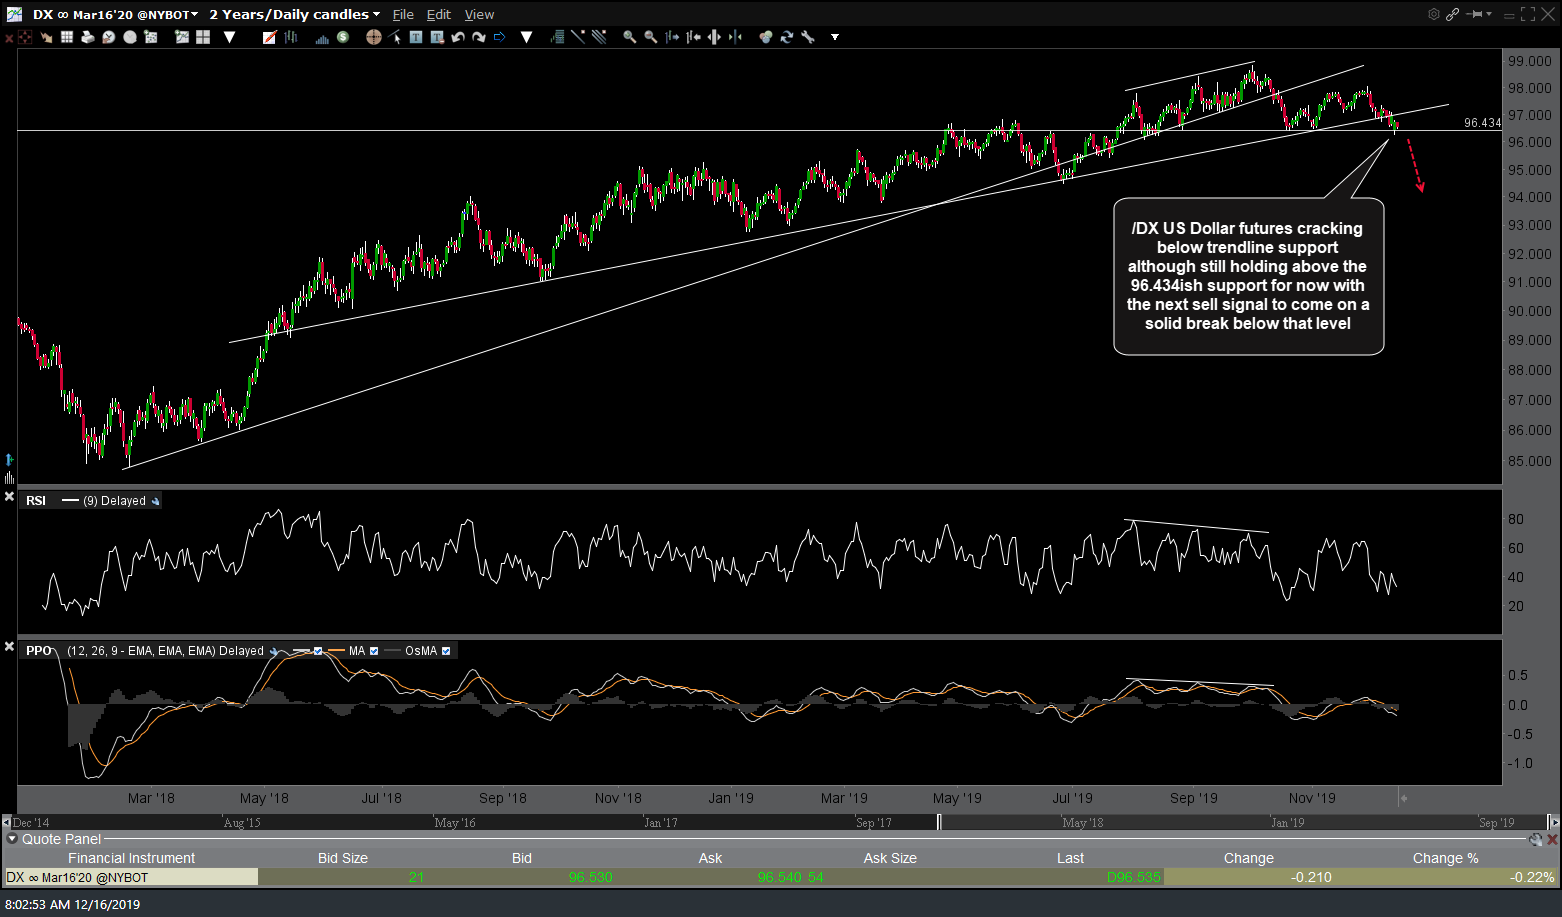
DX 60m Dec 16th
On a somewhat related note to gold, the next near-term trend in the other big ‘risk-off’ asset, TLT (30-yr Treasury Bond ETF), is likely dependent on which way this triangle pattern breaks.

TLT daily Dec 16th
/KC (coffee futures) has started to succumb to the overbought conditions & negative divergences on Friday with a sharp leg down to bounce off trendline support & may need still have some more downside with the next sell signal to come on a break below that same trendline.
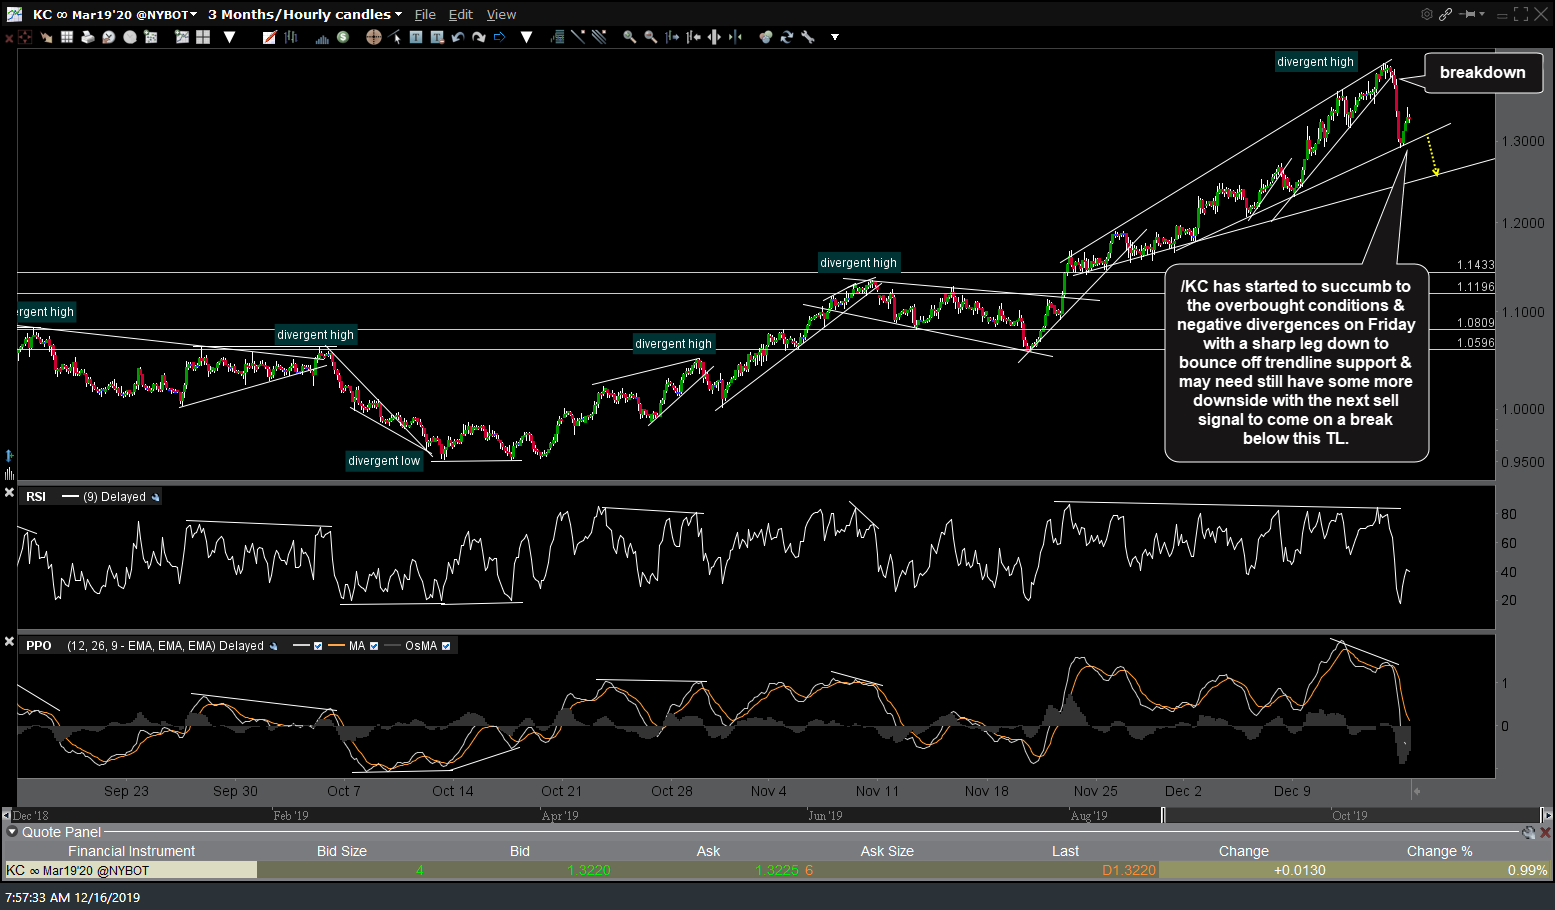
KC 60m Dec 16th
/NG (natural gas futures) is pinching between downtrend line + 2.326 resistance & uptrend line support with a break above or below likely to spark the next rally or leg down. 60-minute chart.
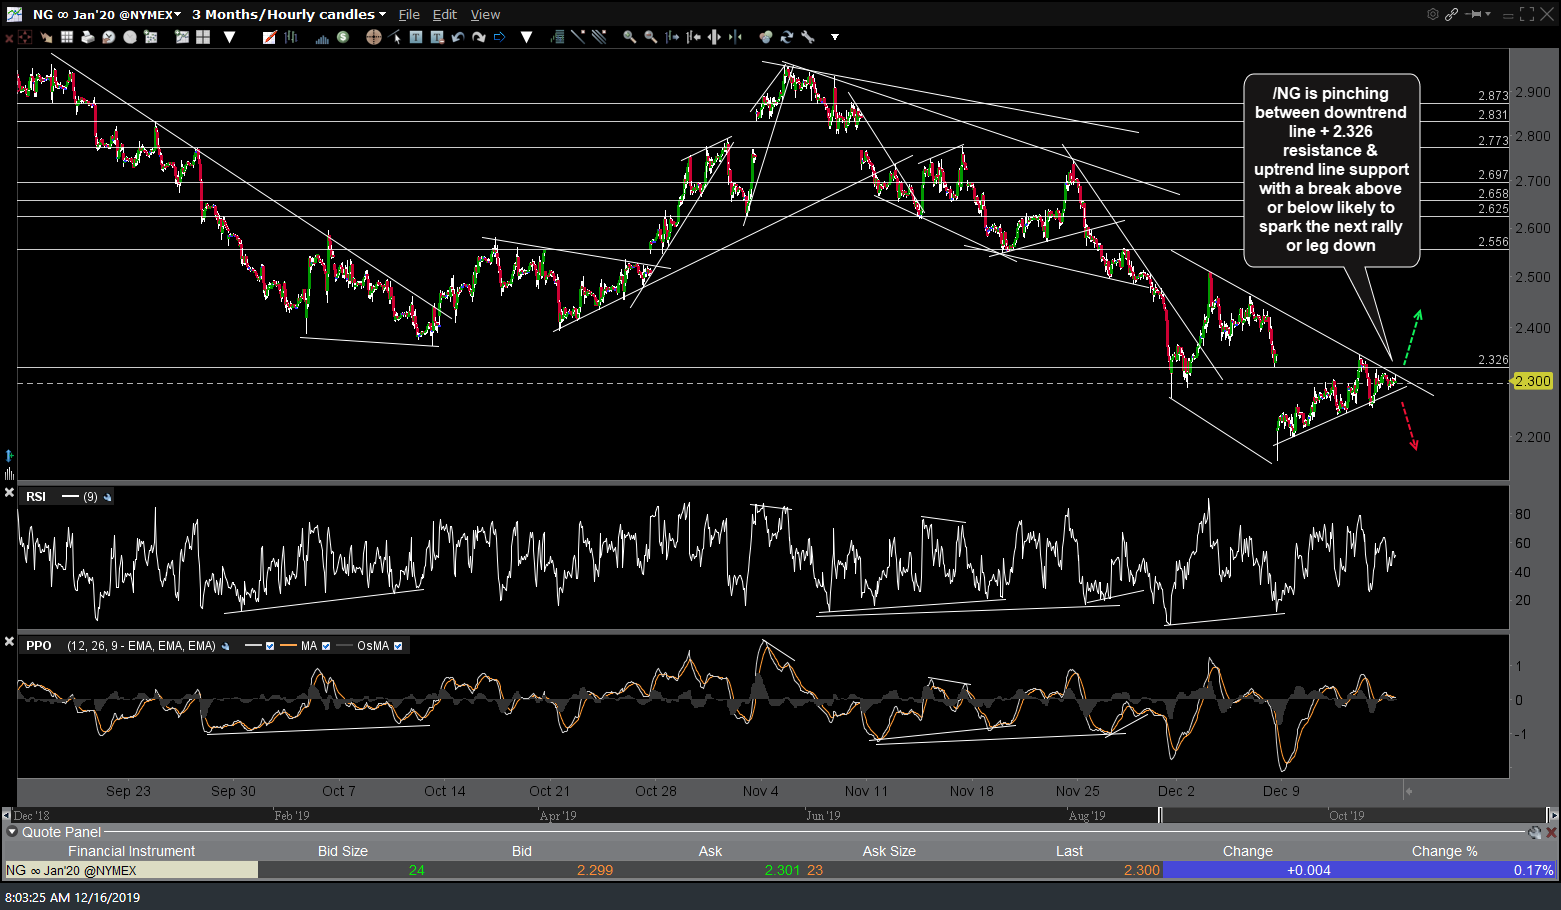
NG 60m Dec 16th
/CL (crude oil futures) is walking up trendline support with divergences in place that could be the catalyst for a correction on a solid break below the trendline with 58.67 as the first support/target. However, as of now, the trend remains bullish as divergences are not sell signals & may be extended or negated should /CL continue to rally.

CL 60m Dec 16th