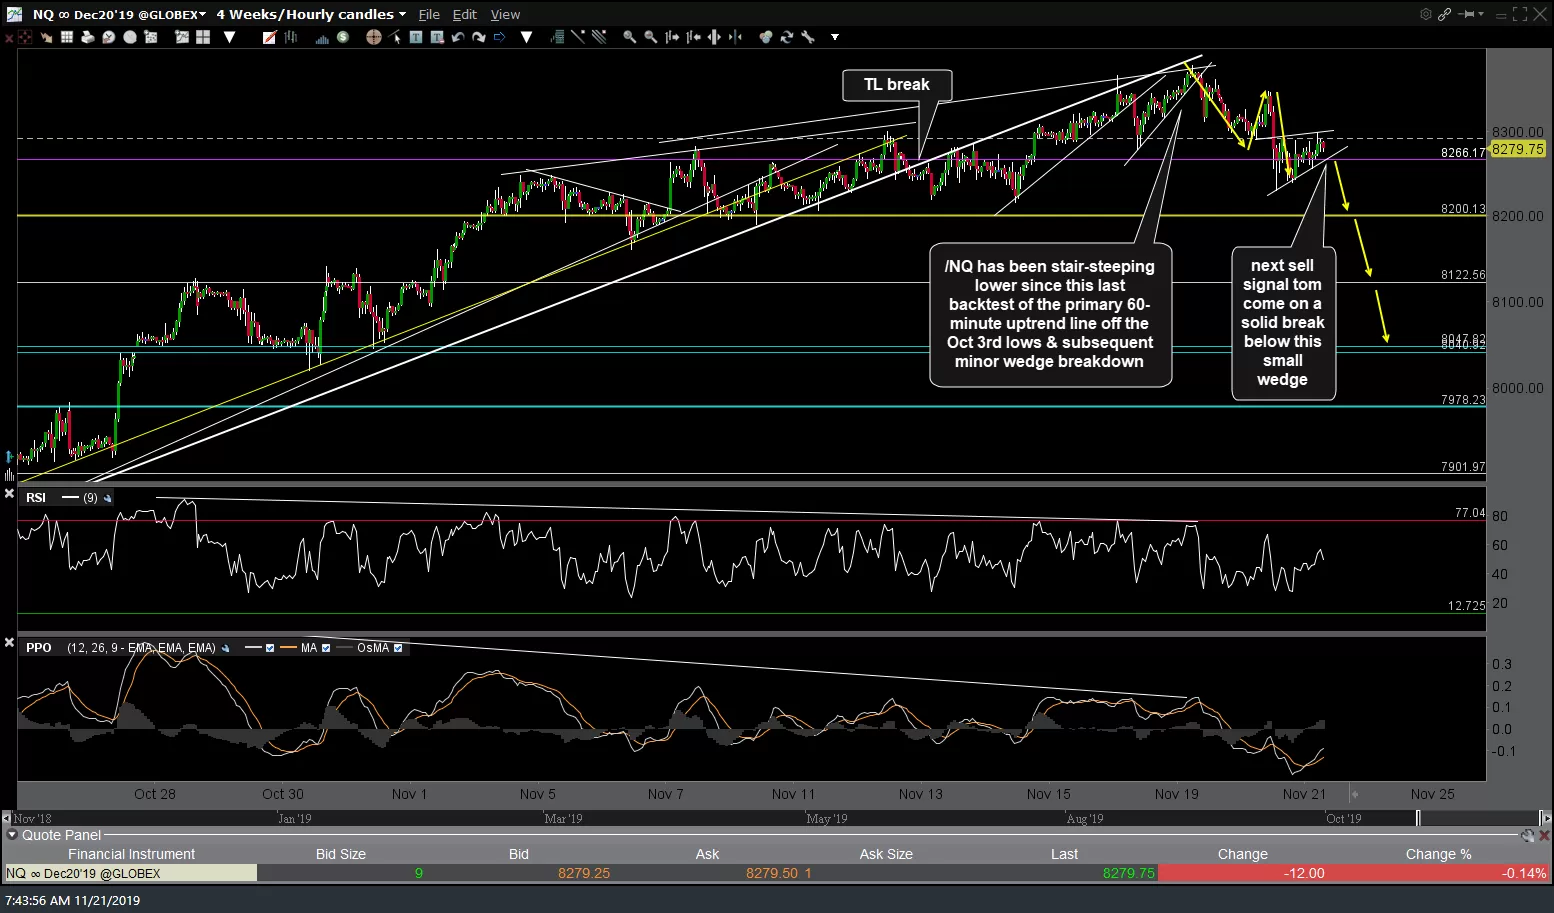
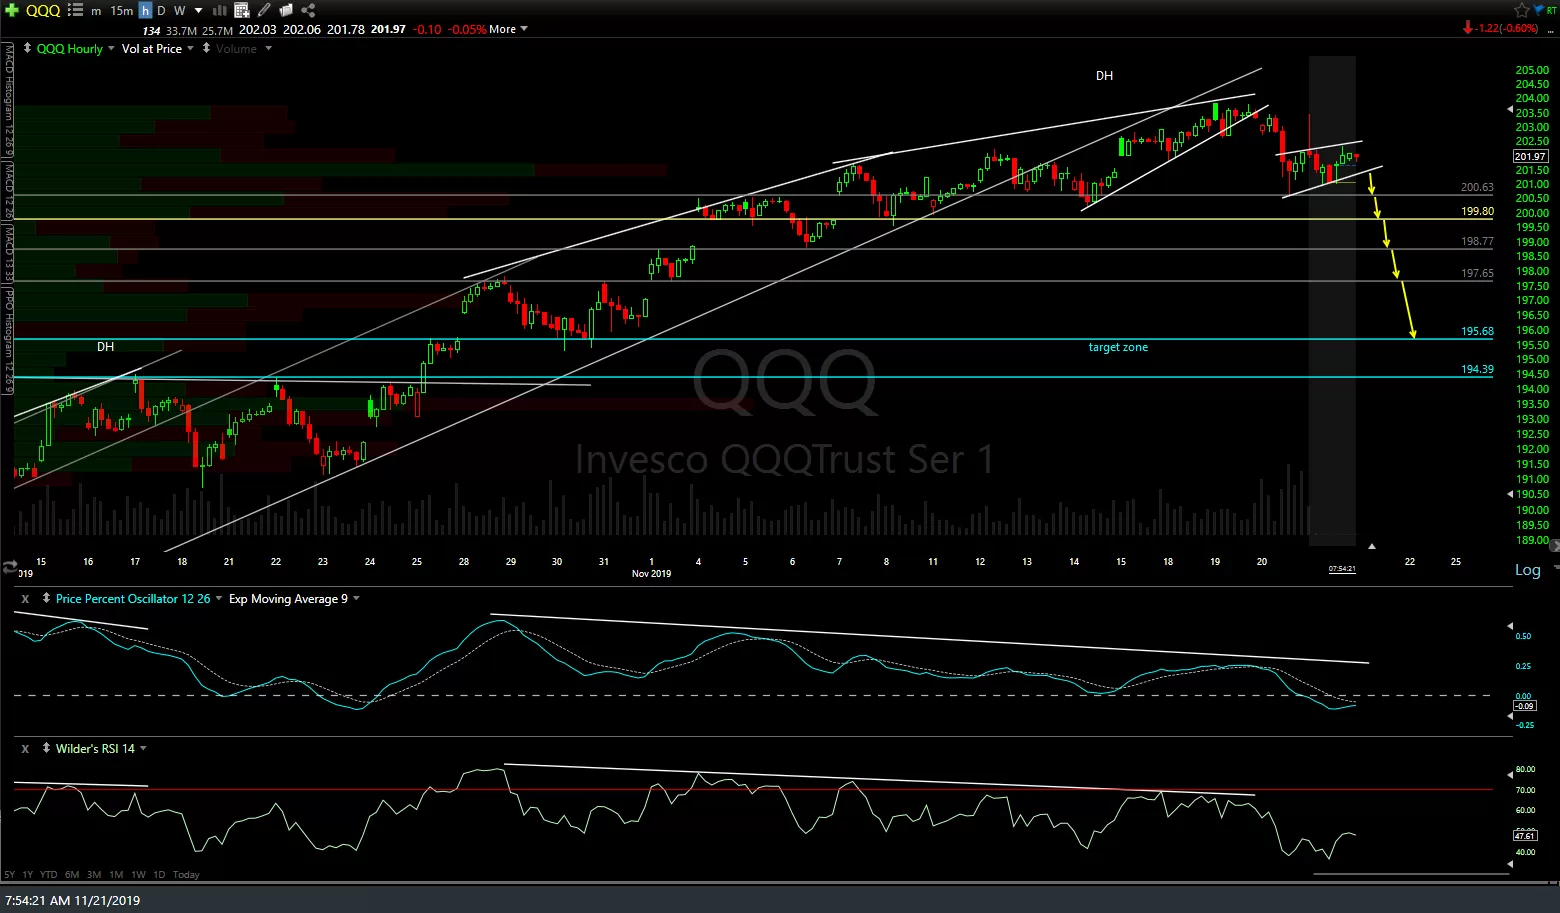
While far from an all-inclusive list, here are a few of the charts that I’m watching today. /NQ Nasdaq 100 has been stair-steeping lower since this last backtest of the primary 60-minute uptrend line off the Oct 3rd lows & subsequent minor wedge breakdown with the next sell signal tom come on a solid break below this small wedge. Comparable levels included on the QQQ 60-minute charts below as well.
-

- /NQ 60m Nov 21st
-
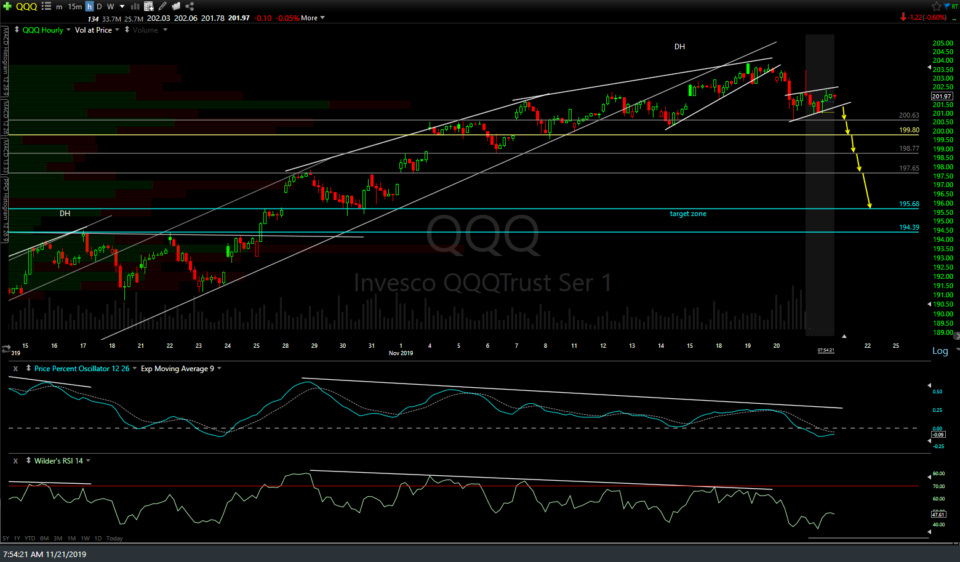
- QQQ 60m Nov 21st
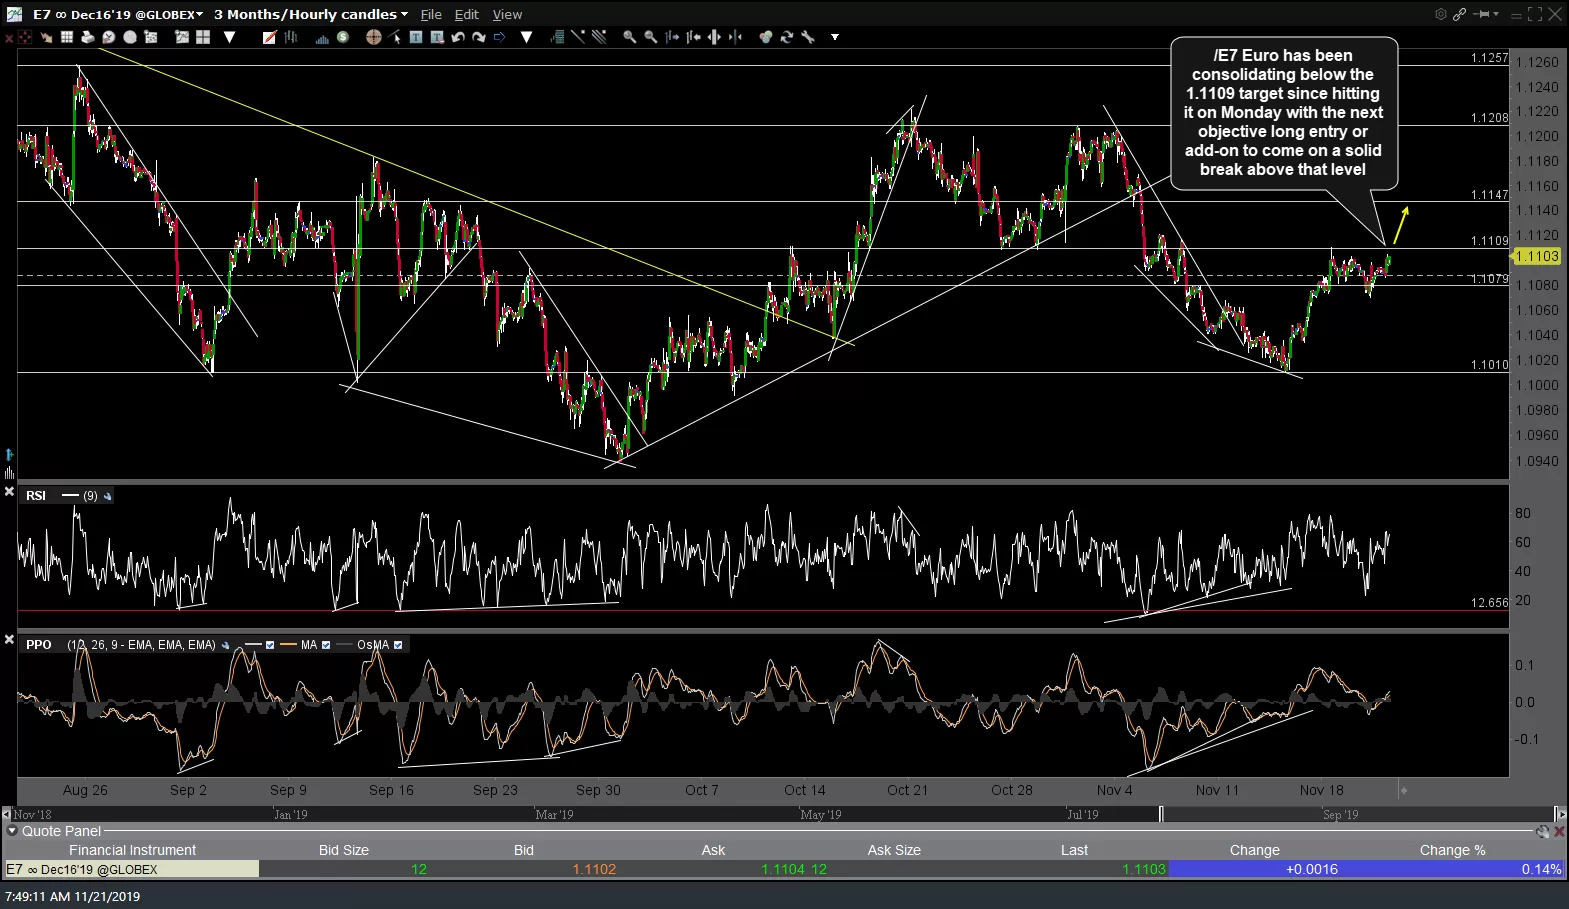
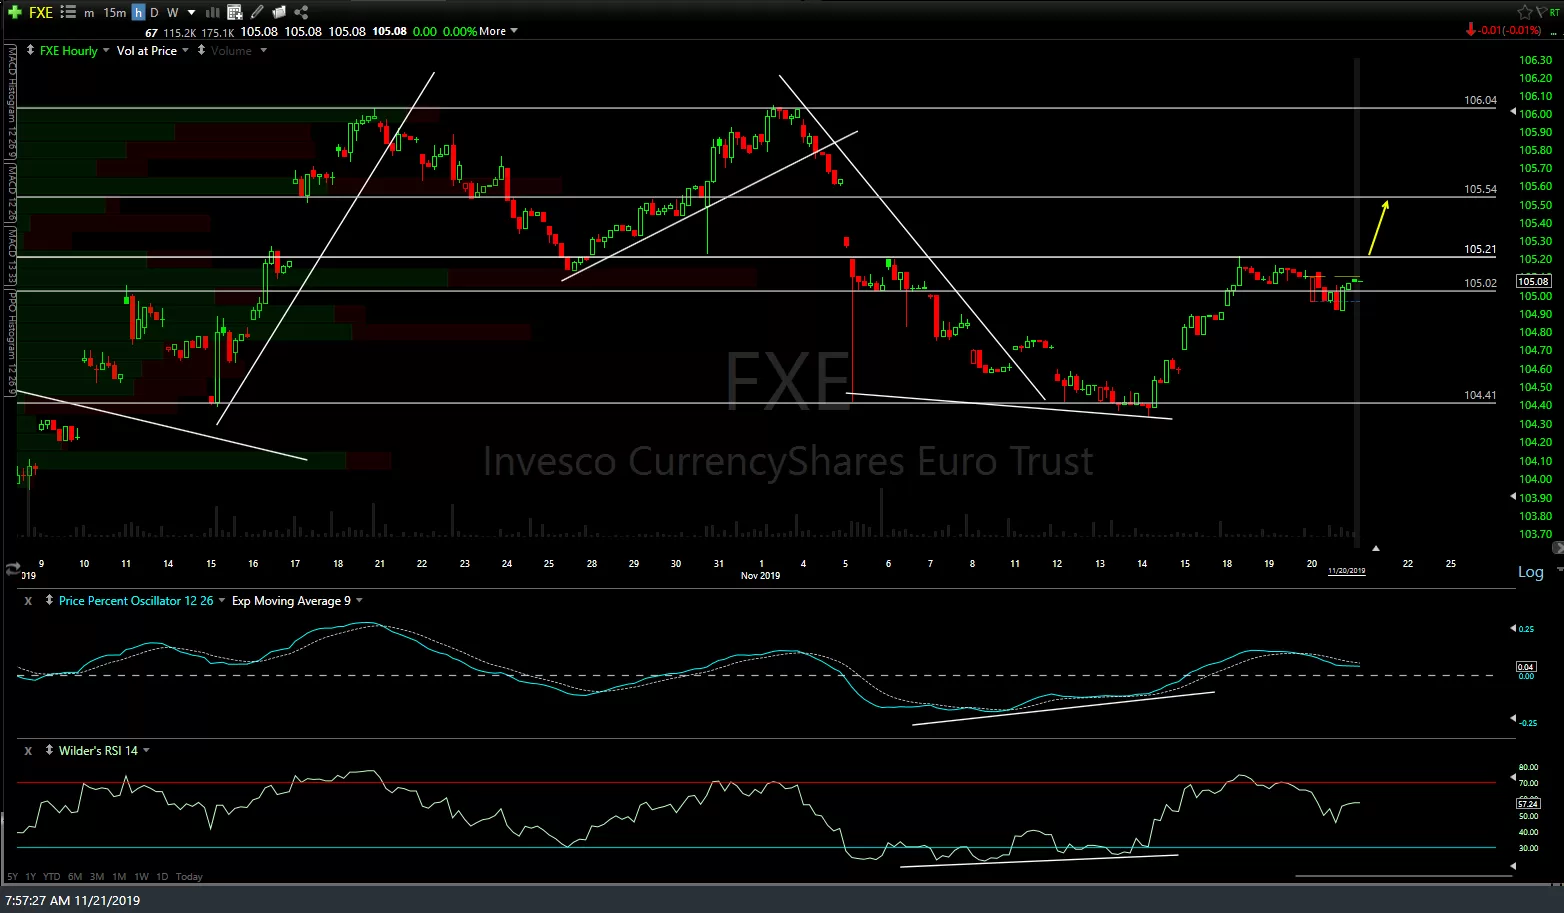
/E7 Euro has been consolidating below the 1.1109 target since hitting it on Monday with the next objective long entry or add-on to come on a solid break above that level with comparable levels included on the FXE 60-minute chart below as well.
-
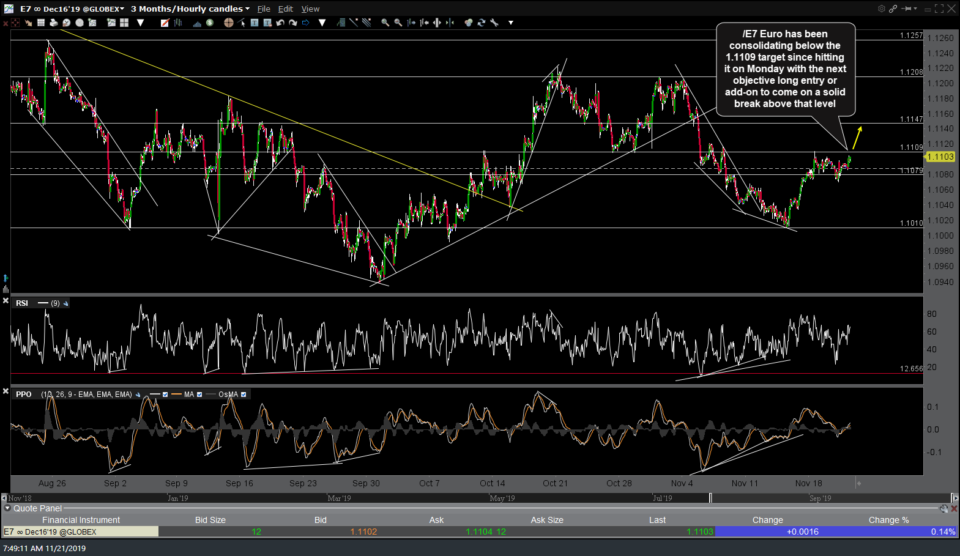
- /E7 60m Nov 21st
-
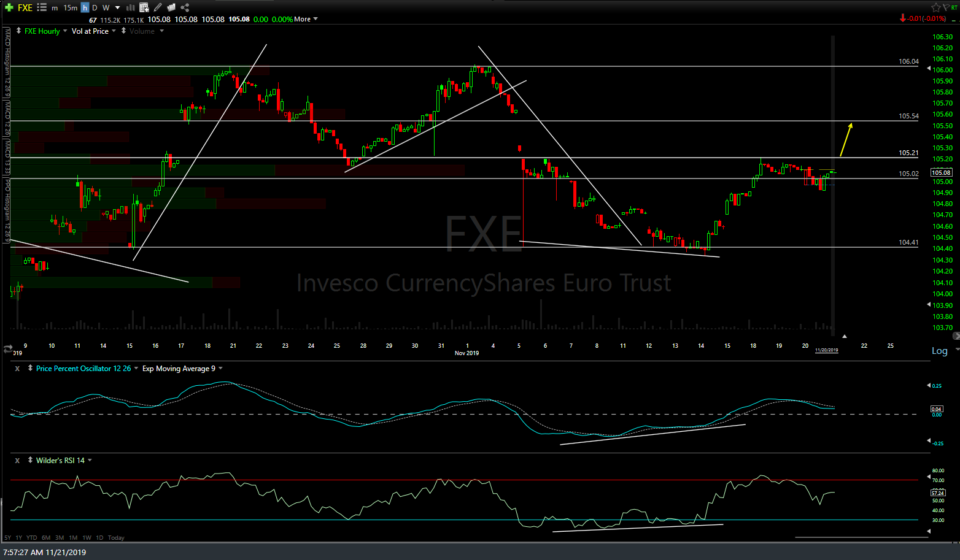
- FXE 60m Nov 21st
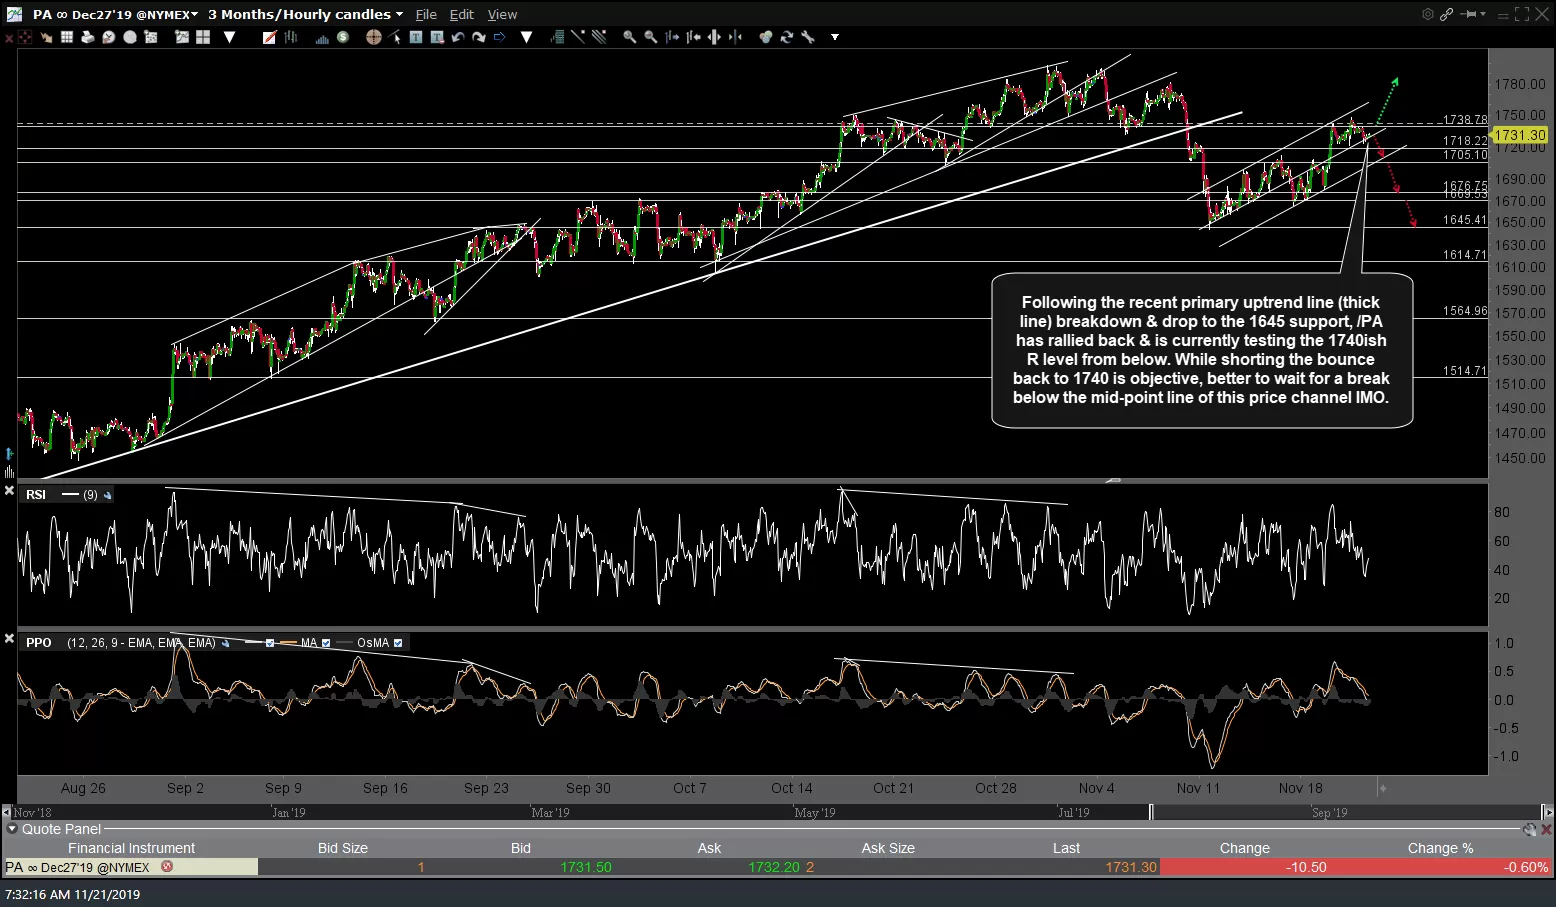
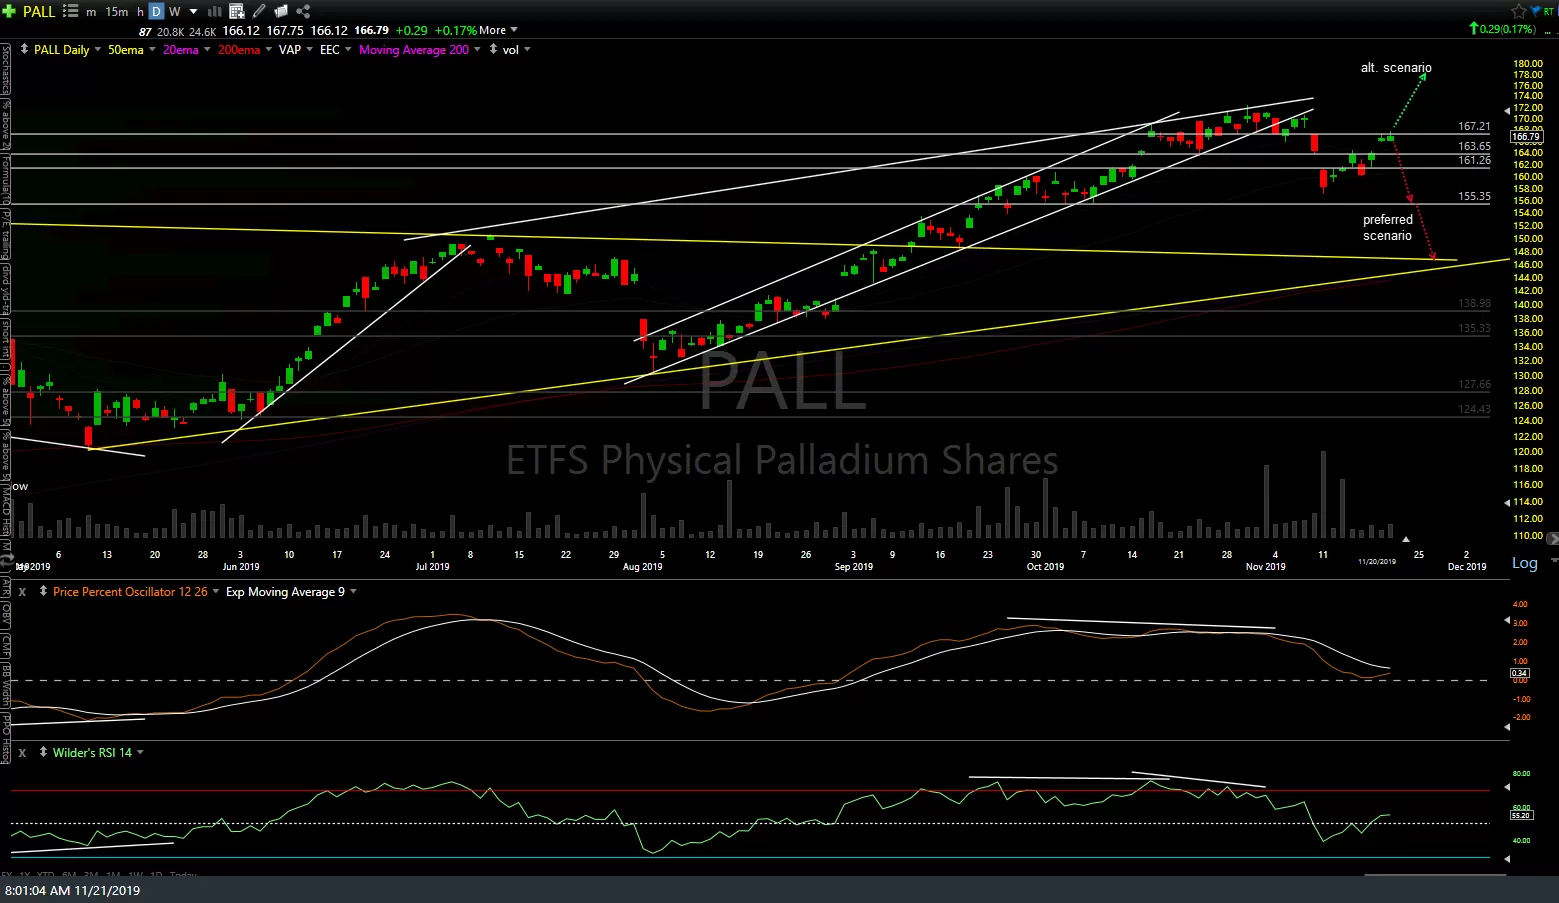
Following the recent primary uptrend line (thick line) breakdown & drop to the 1645 support, /PA has rallied back & is currently testing the 1740ish R level from below. While shorting the bounce back to 1740 is objective, better to wait for a break below the mid-point line of this price channel IMO. PALL daily chart included below as well.
-
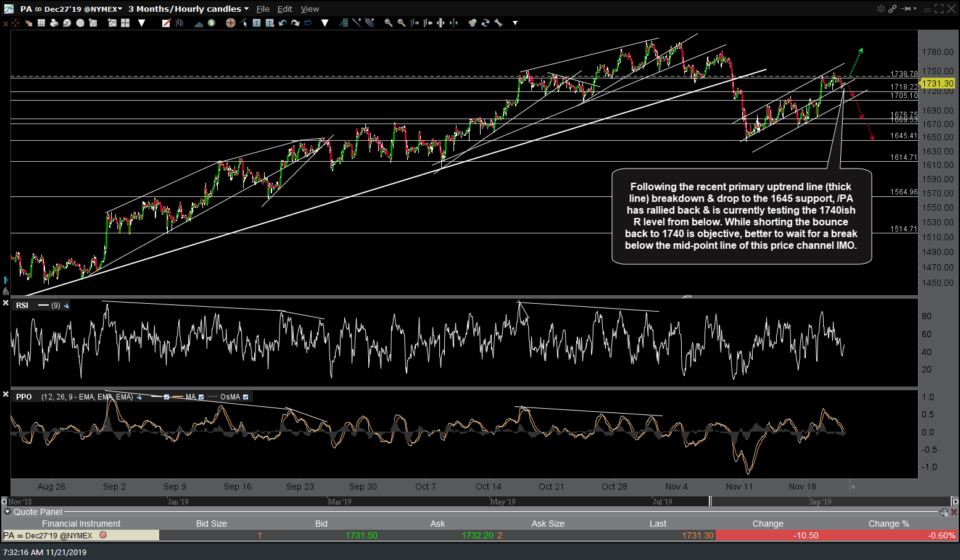
- /PA 60m Nov 21st
-
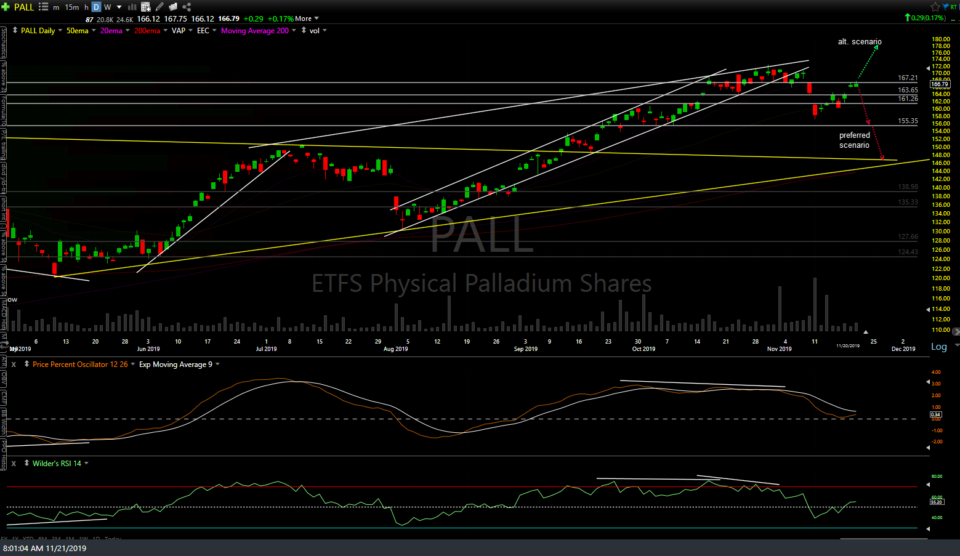
- PALL daily Nov 21st
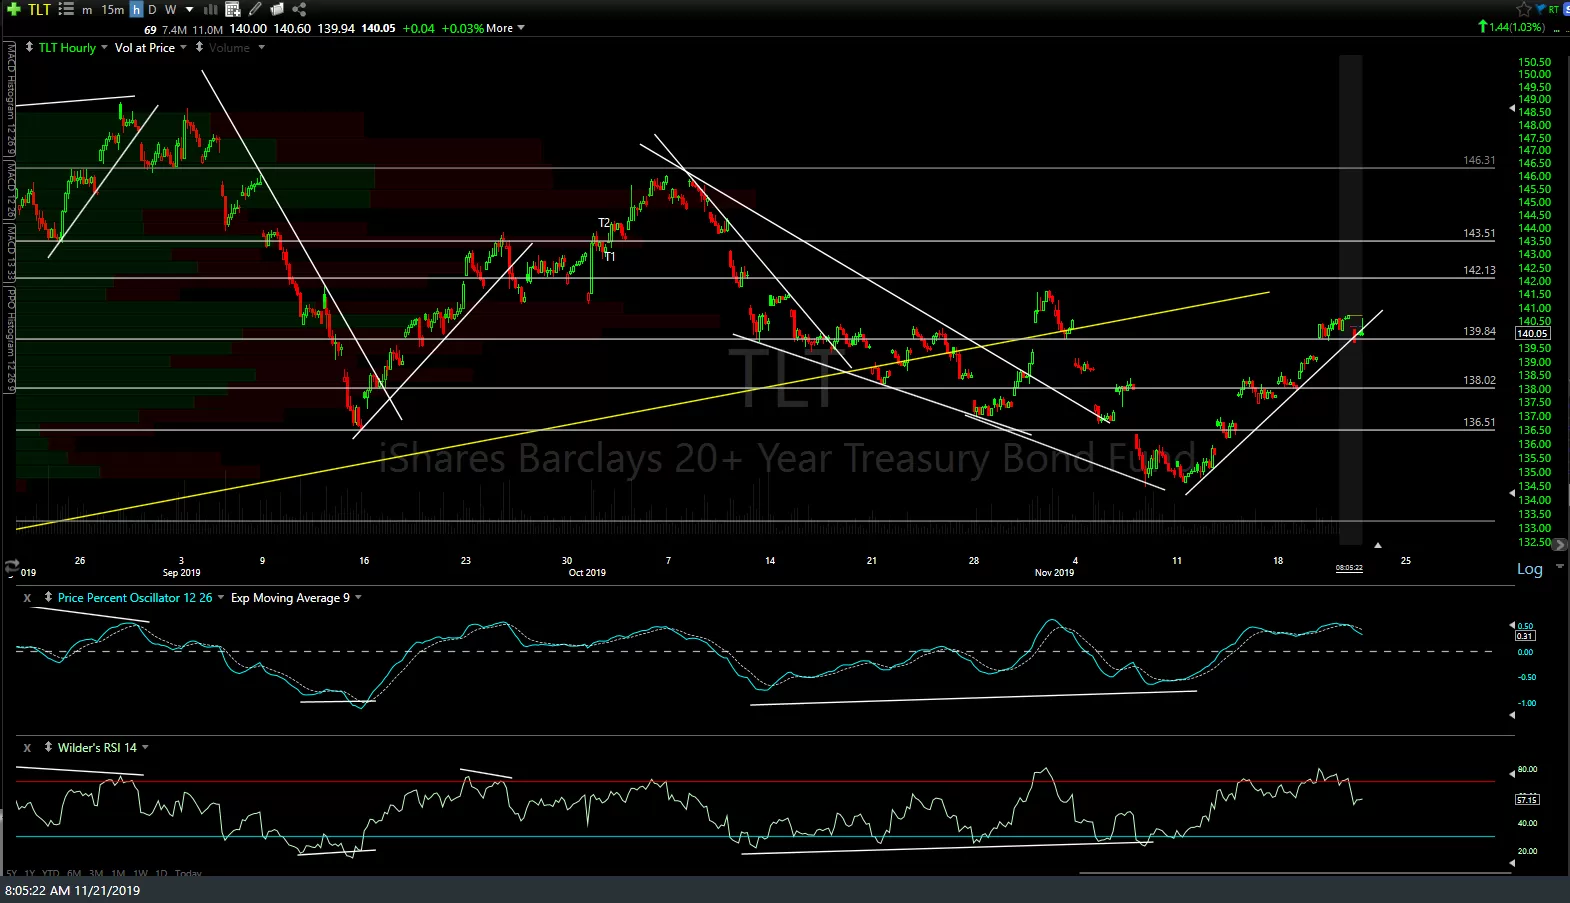
/ZB (30-yr Treasury bond) & TLT have made a nice run off the recent divergent low but are getting a bit extended with a near-term pullback likely unless the stock market moves lower from here.
-
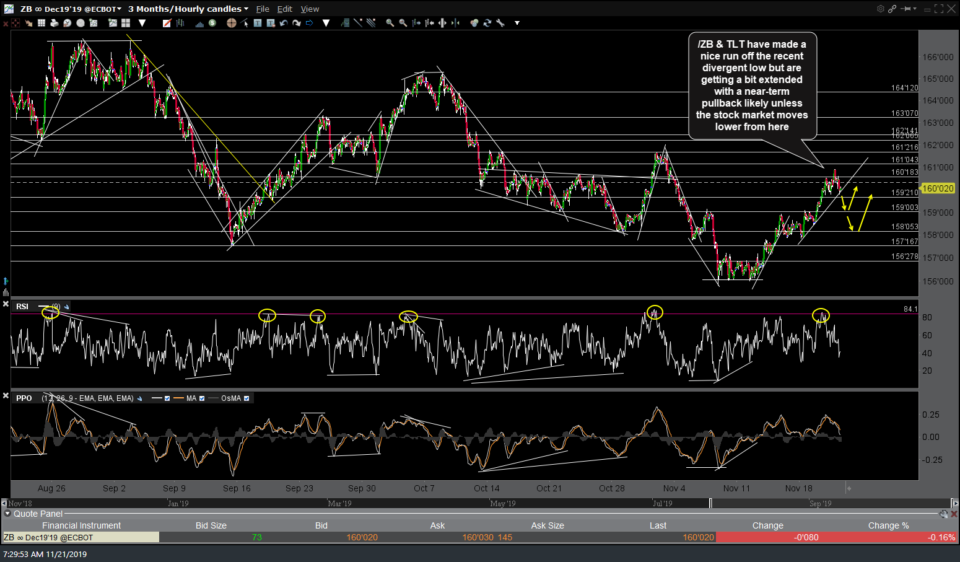
- /ZB 60m Nov 21st

-
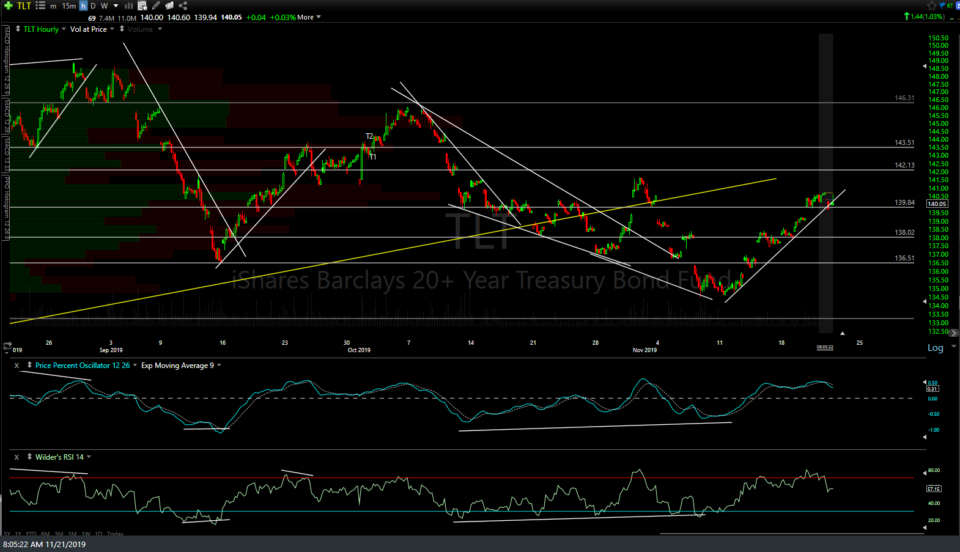
- TLT 60m Nov 21st
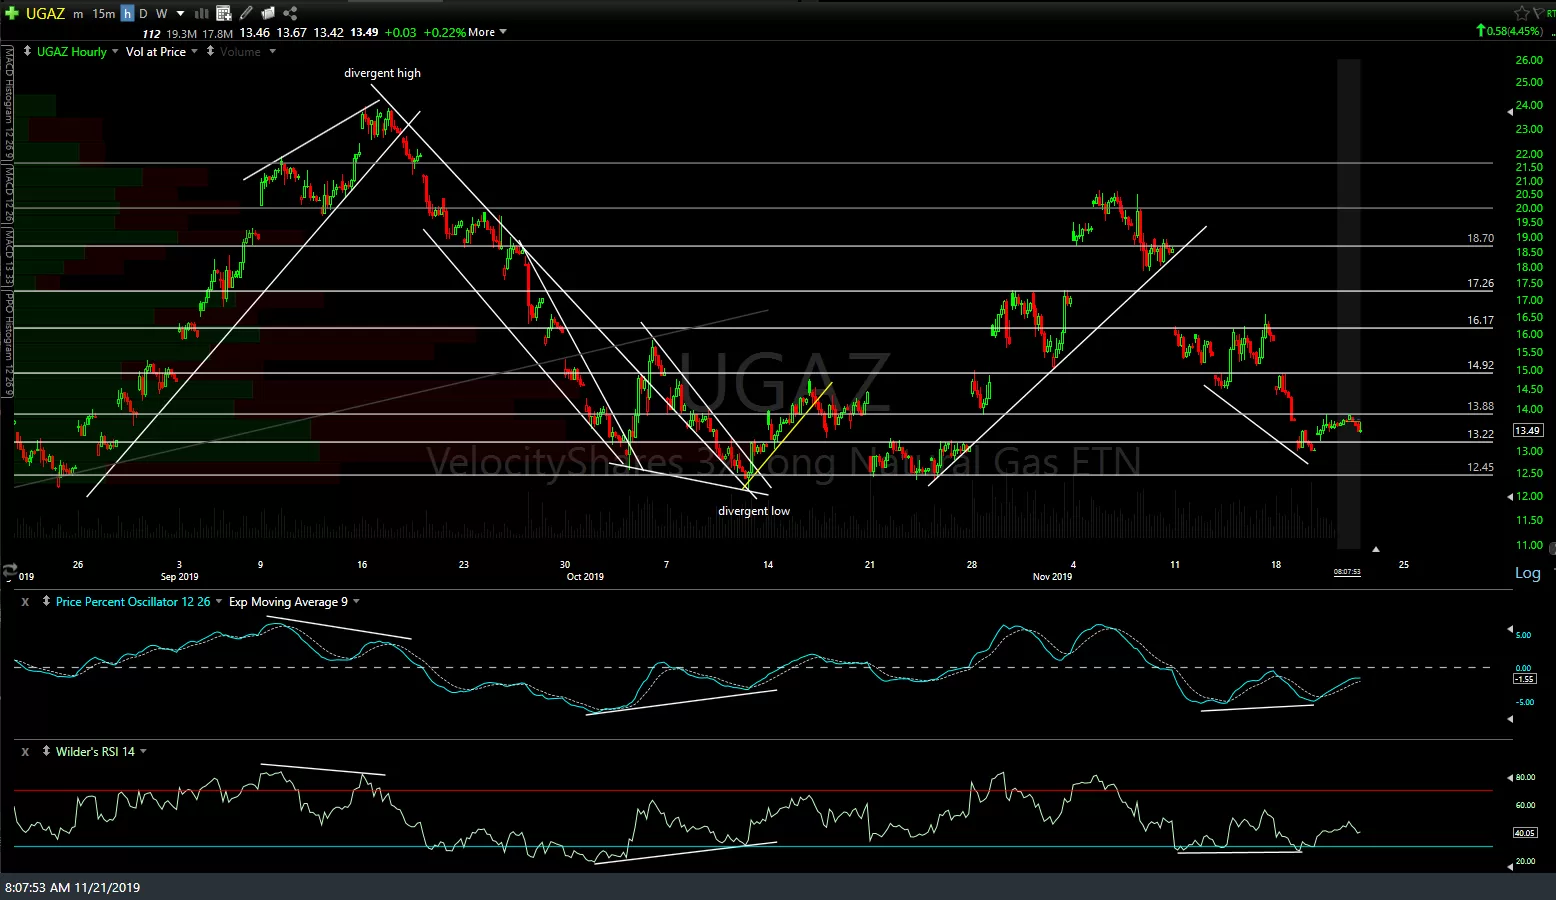
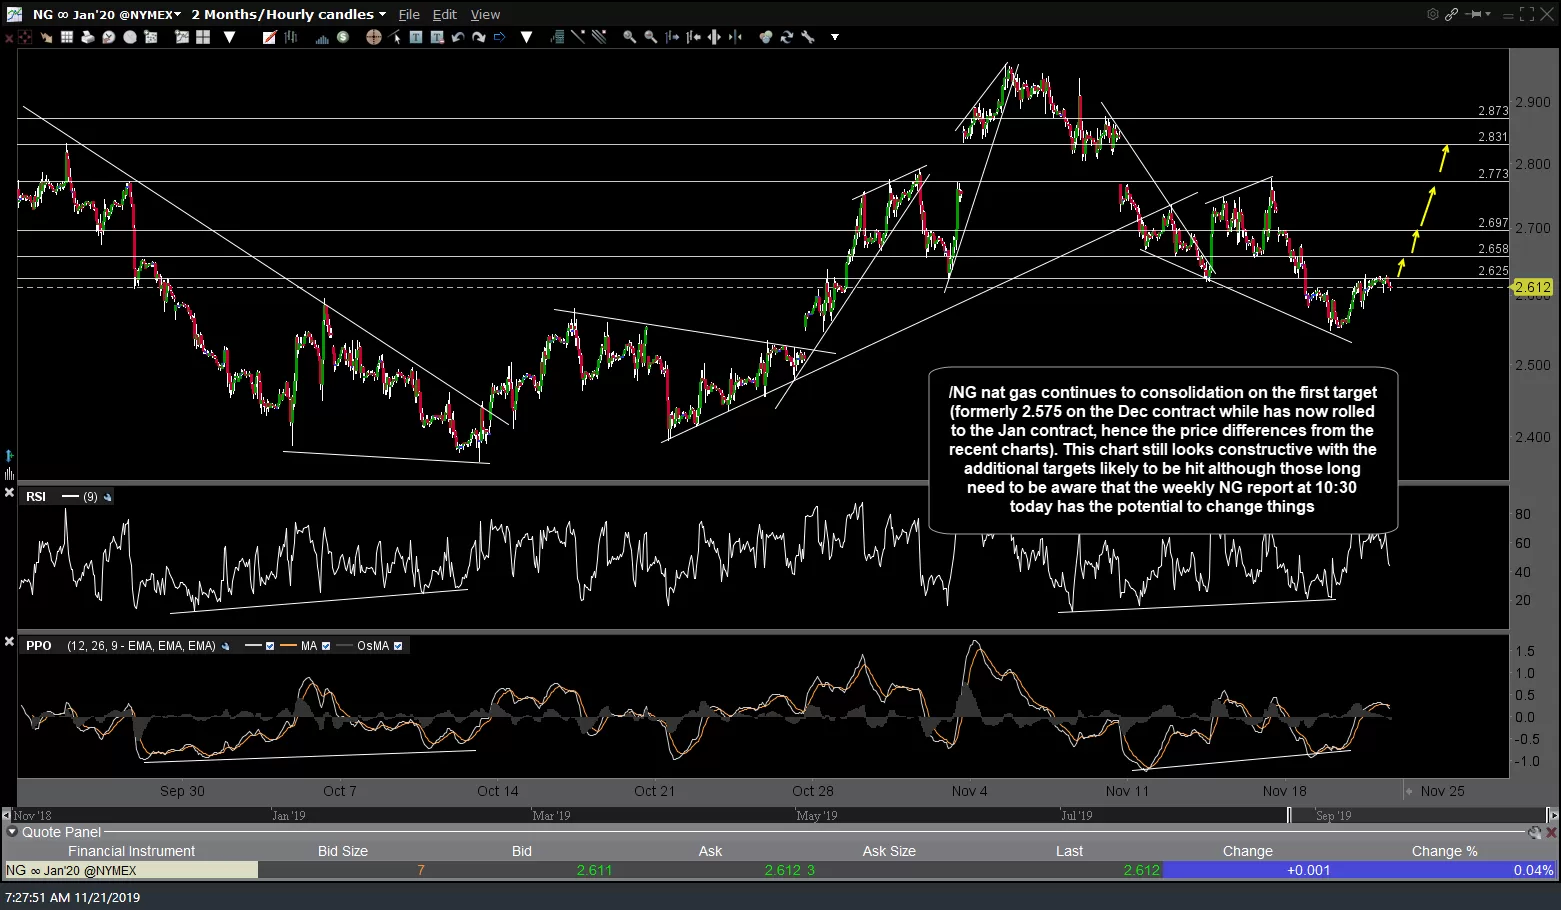
/NG natural gas continues to consolidation on the first target (formerly 2.575 on the Dec contract while has now rolled to the Jan contract, hence the price differences from the recent charts). This chart still looks constructive with the additional targets likely to be hit although those long need to be aware that the weekly NG report at 10:30 today has the potential to change things. UGAZ 60-minute chart included below as well.
-
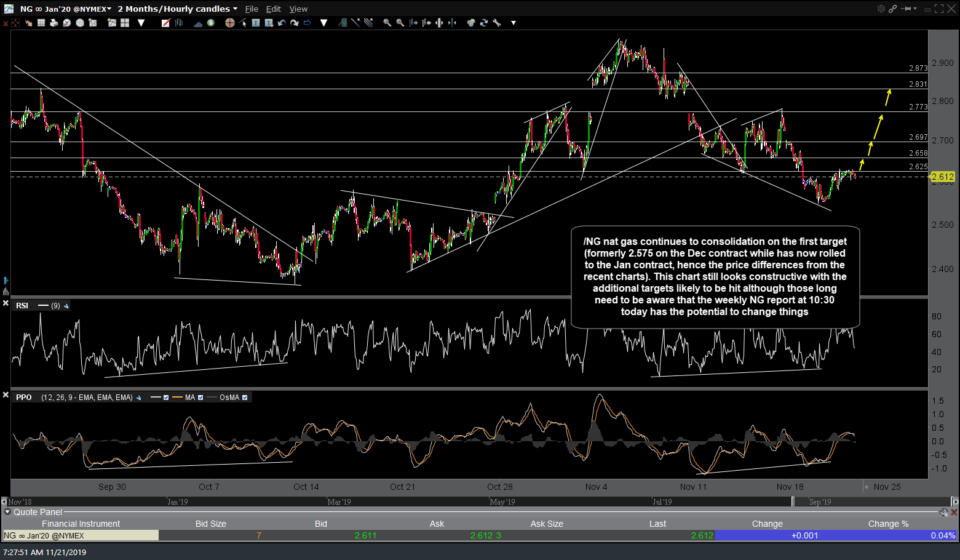
- NG 60m Nov 21st
-
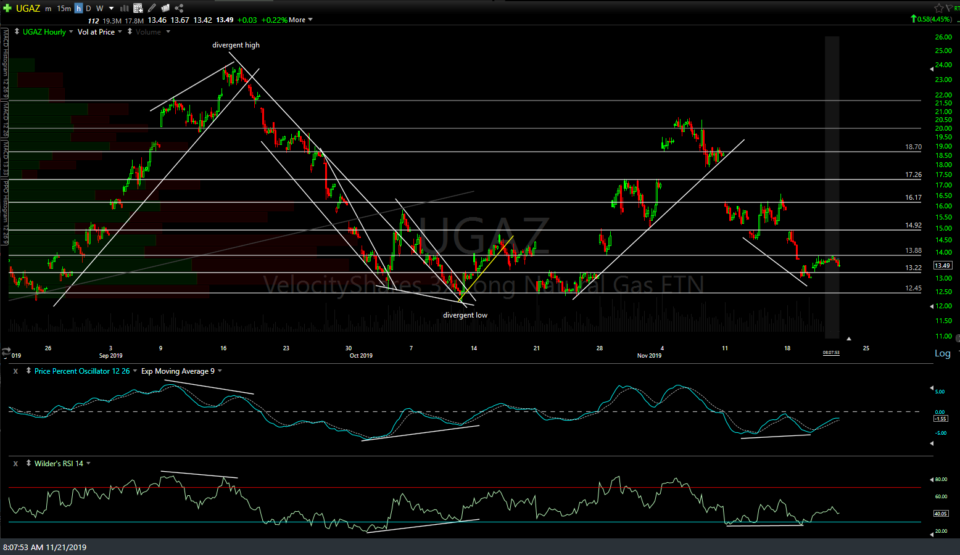
- UGAZ 60m Nov 21st