We’ll keep this one simple with a follow up to each of the securities covered in Friday’s pre-market Charts I’m Watching post. (Friday’s chart first followed by the updated 60-minute charts).
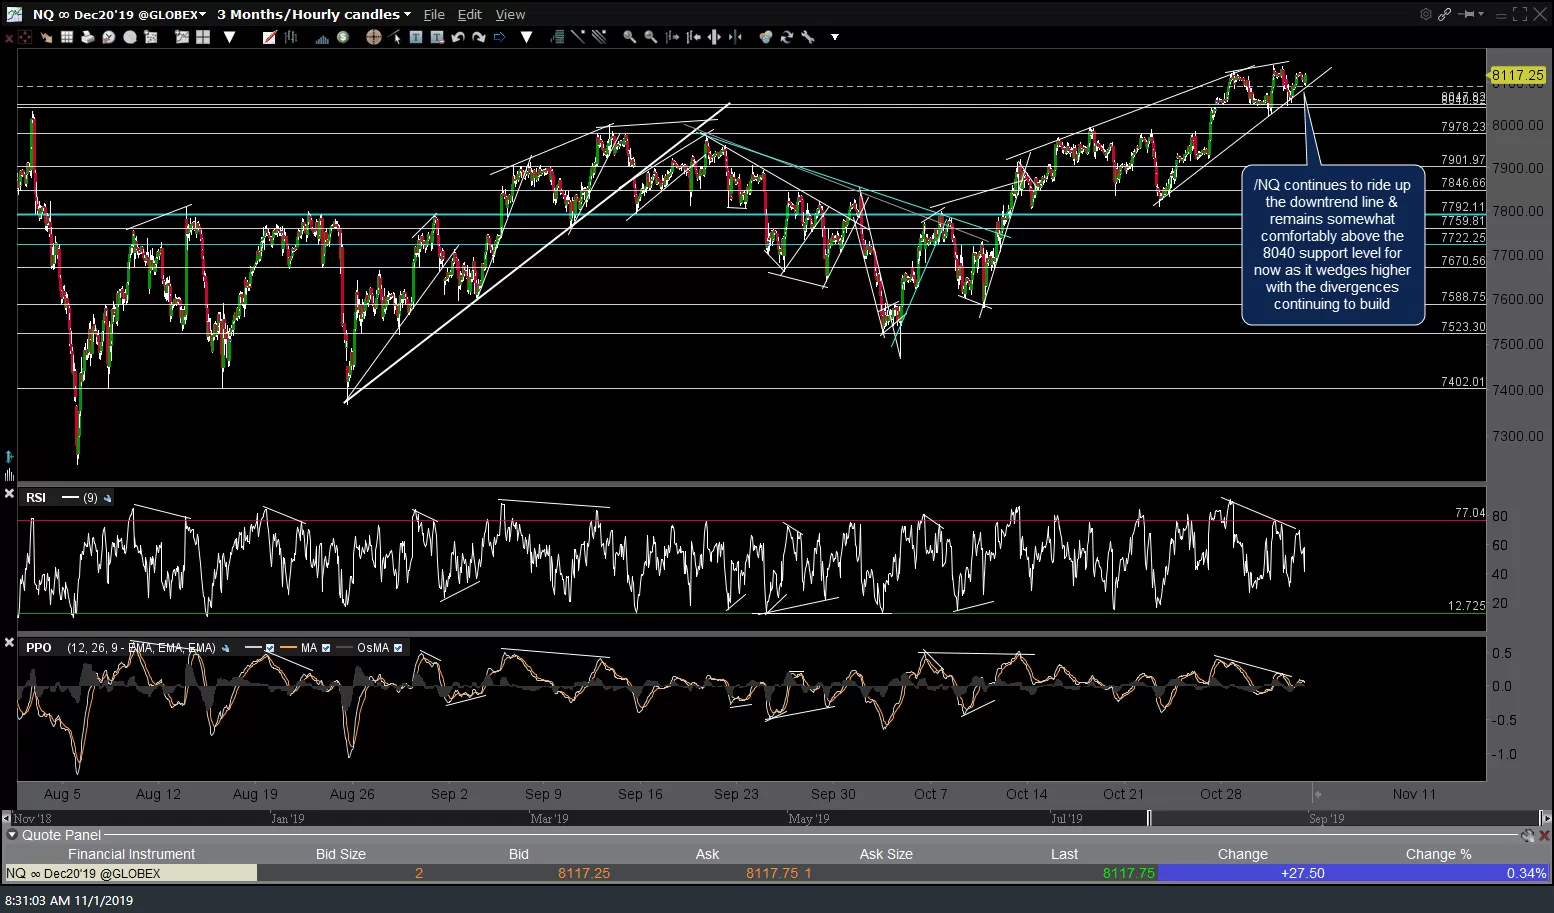
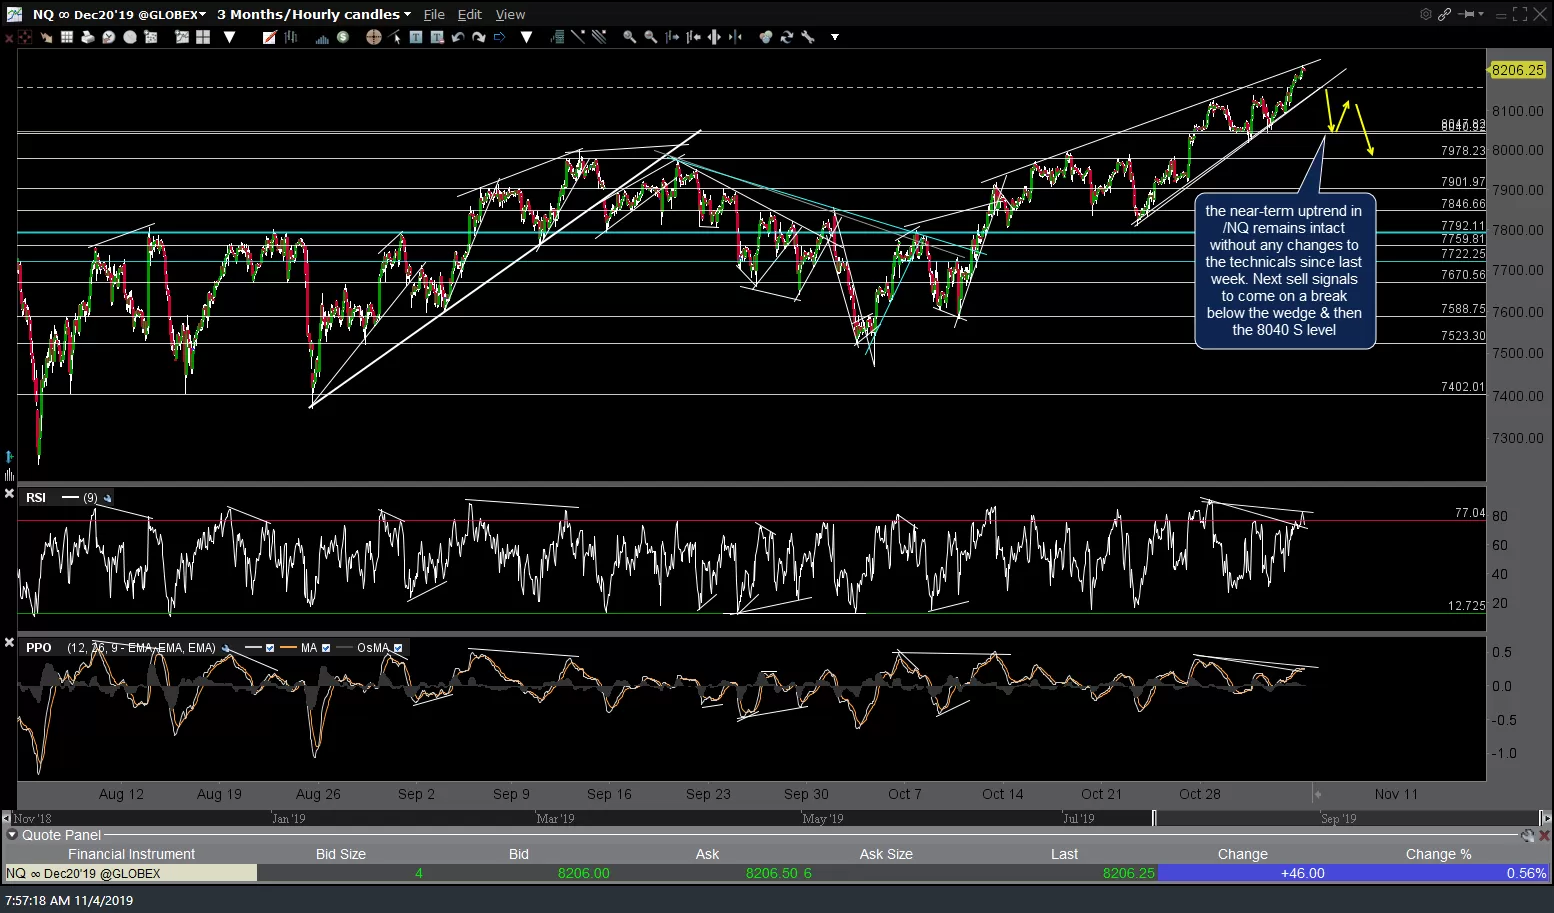
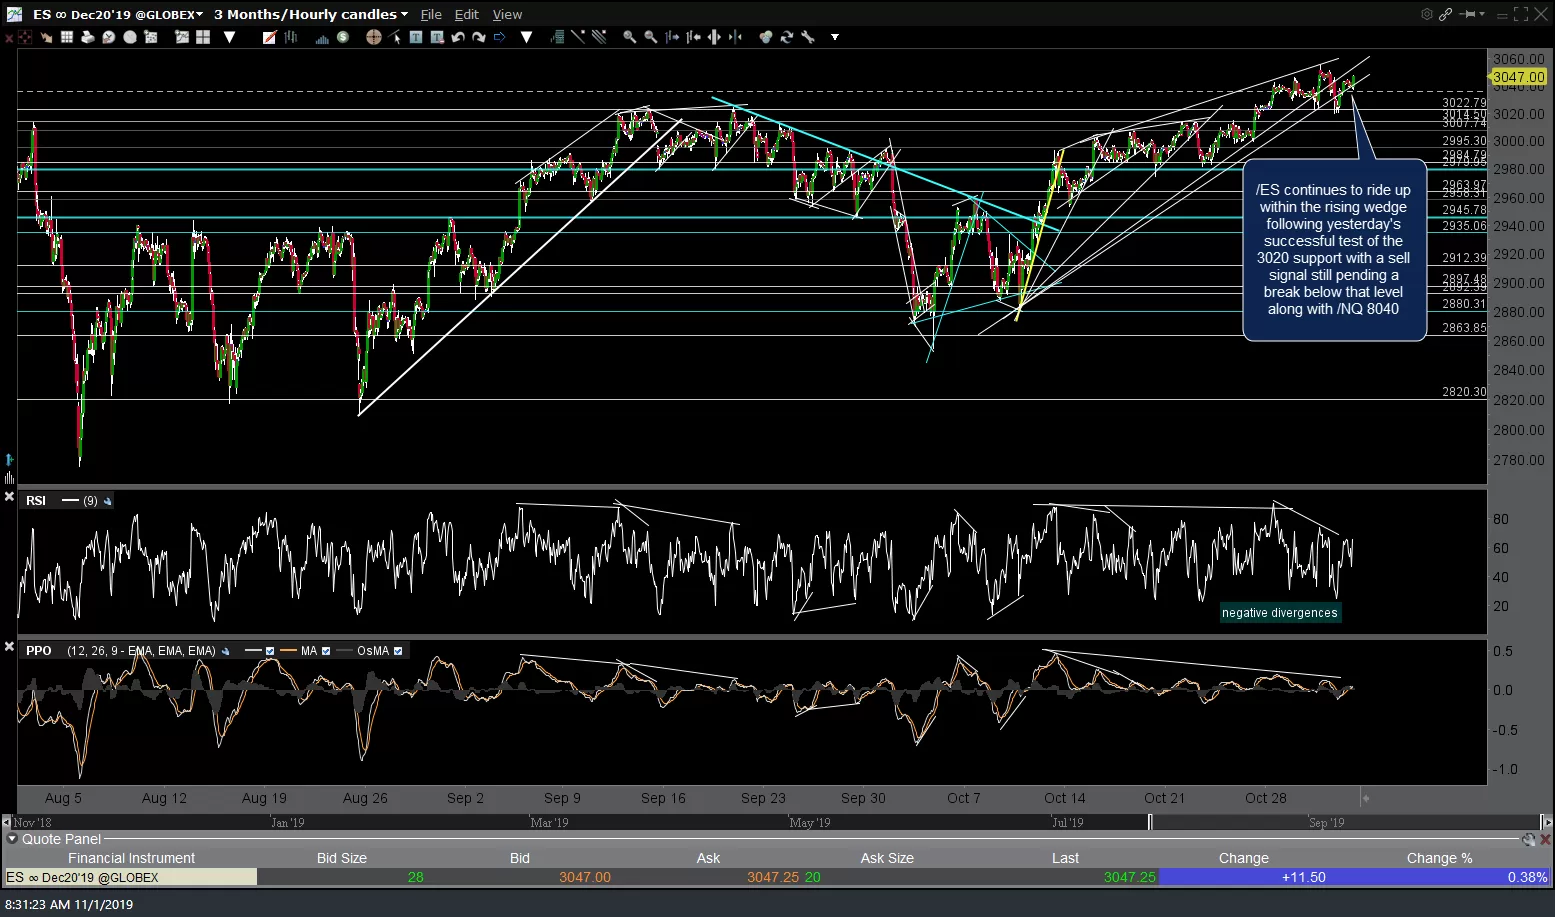
The near-term uptrend in /NQ remains intact without any changes to the technicals since last week. The next sell signals still to come on a break below the wedge & then the 8040 support level along with comparable breakdowns/sell signals in /ES.
-

- NQ 60m Nov 1st
-
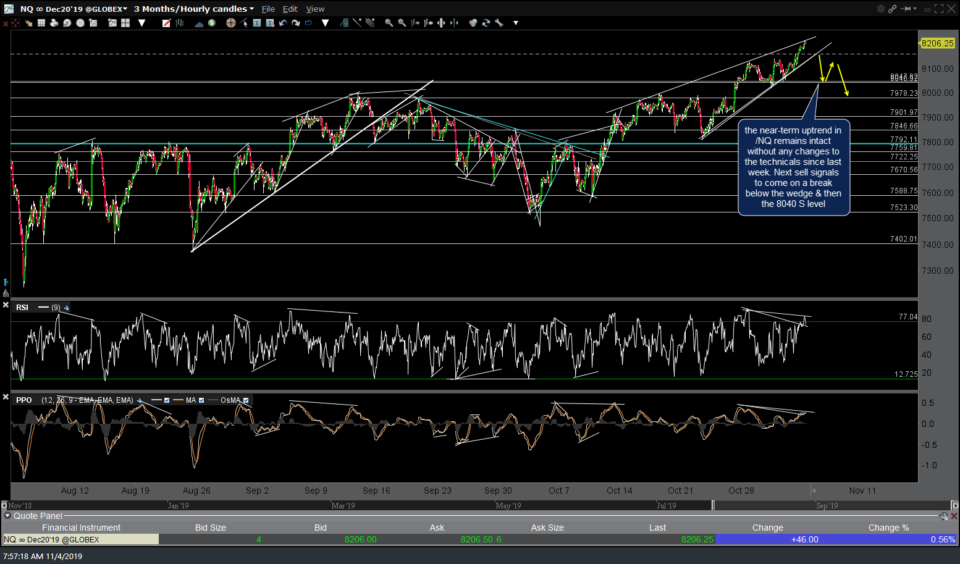
- NQ 60m Nov 4th
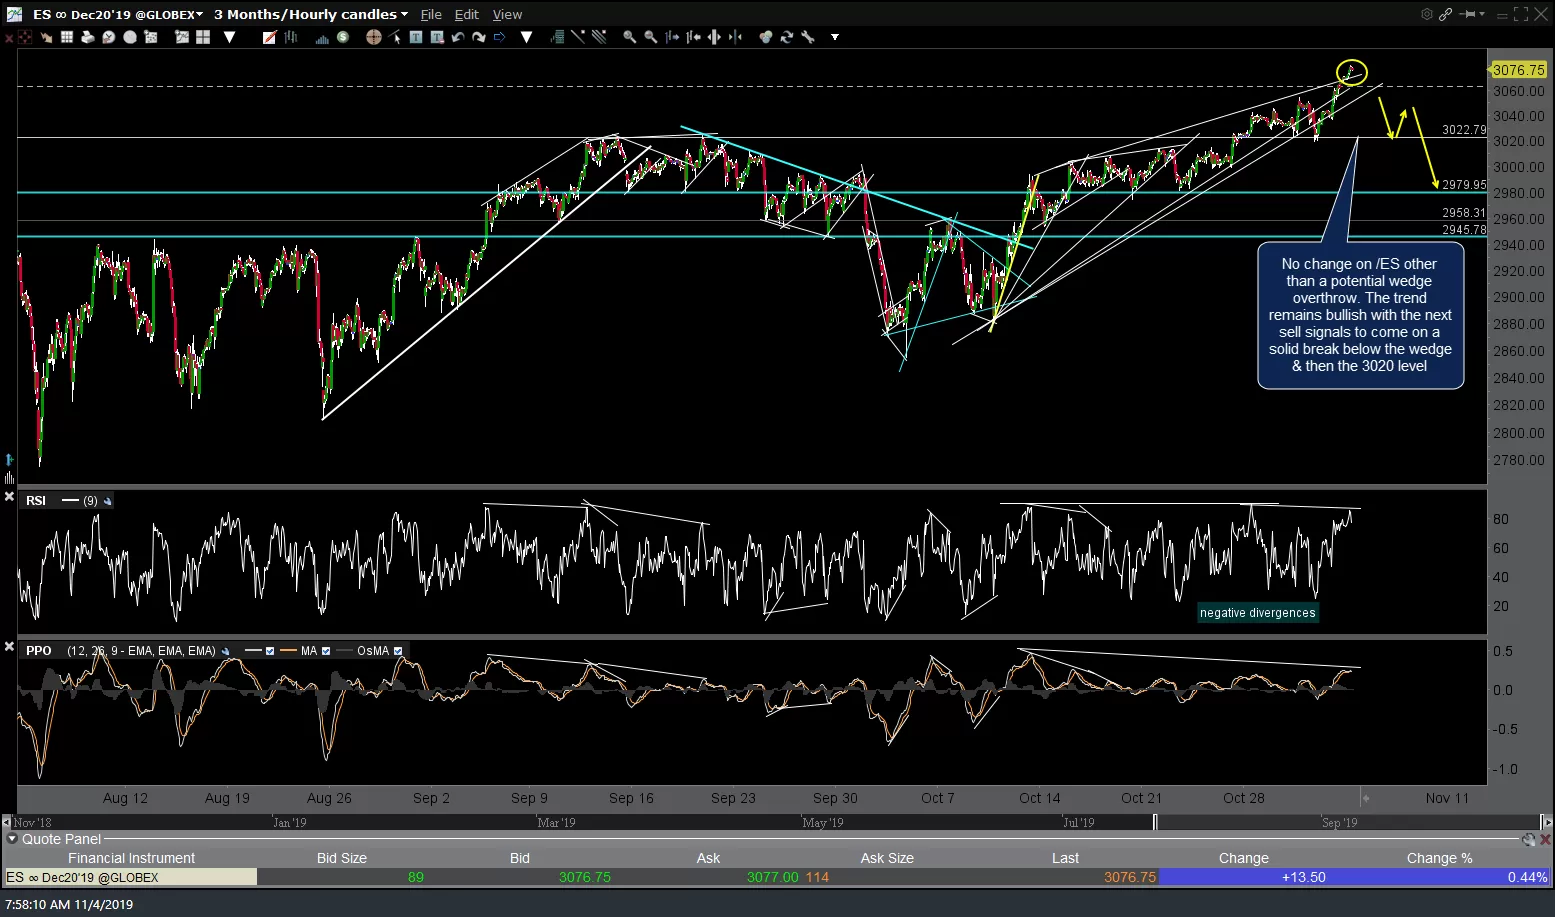
Likewise, no change on /ES other than a potential wedge overthrow. The trend remains bullish with the next sell signals to come on a solid break below the wedge & then the 3020 level.
-

- ES 60m Nov 1st
-

- ES 60m Nov 4th
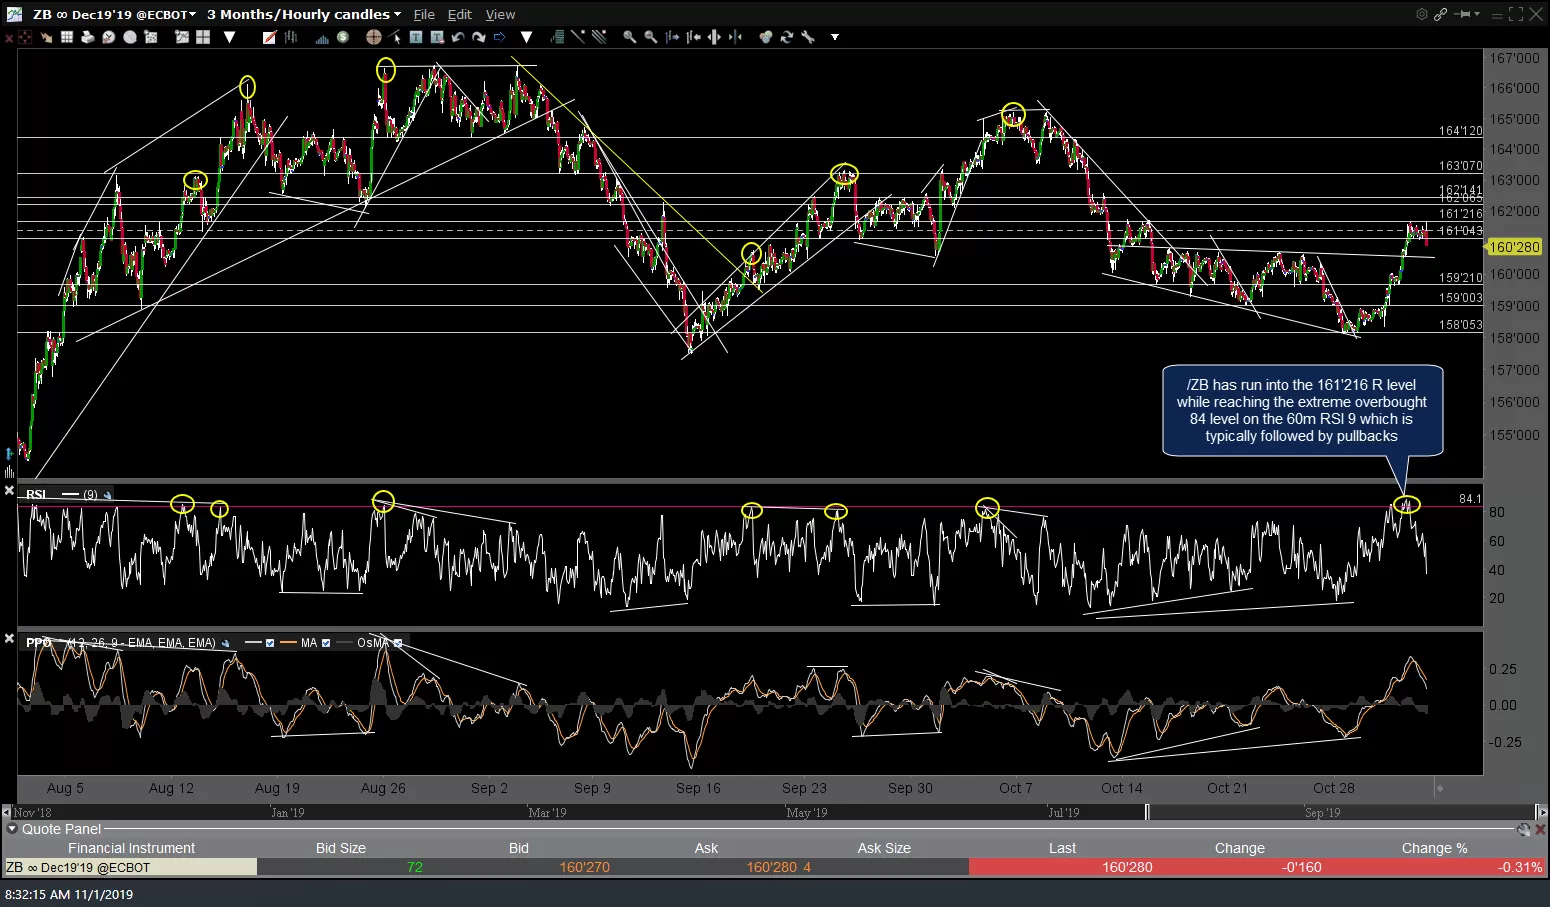
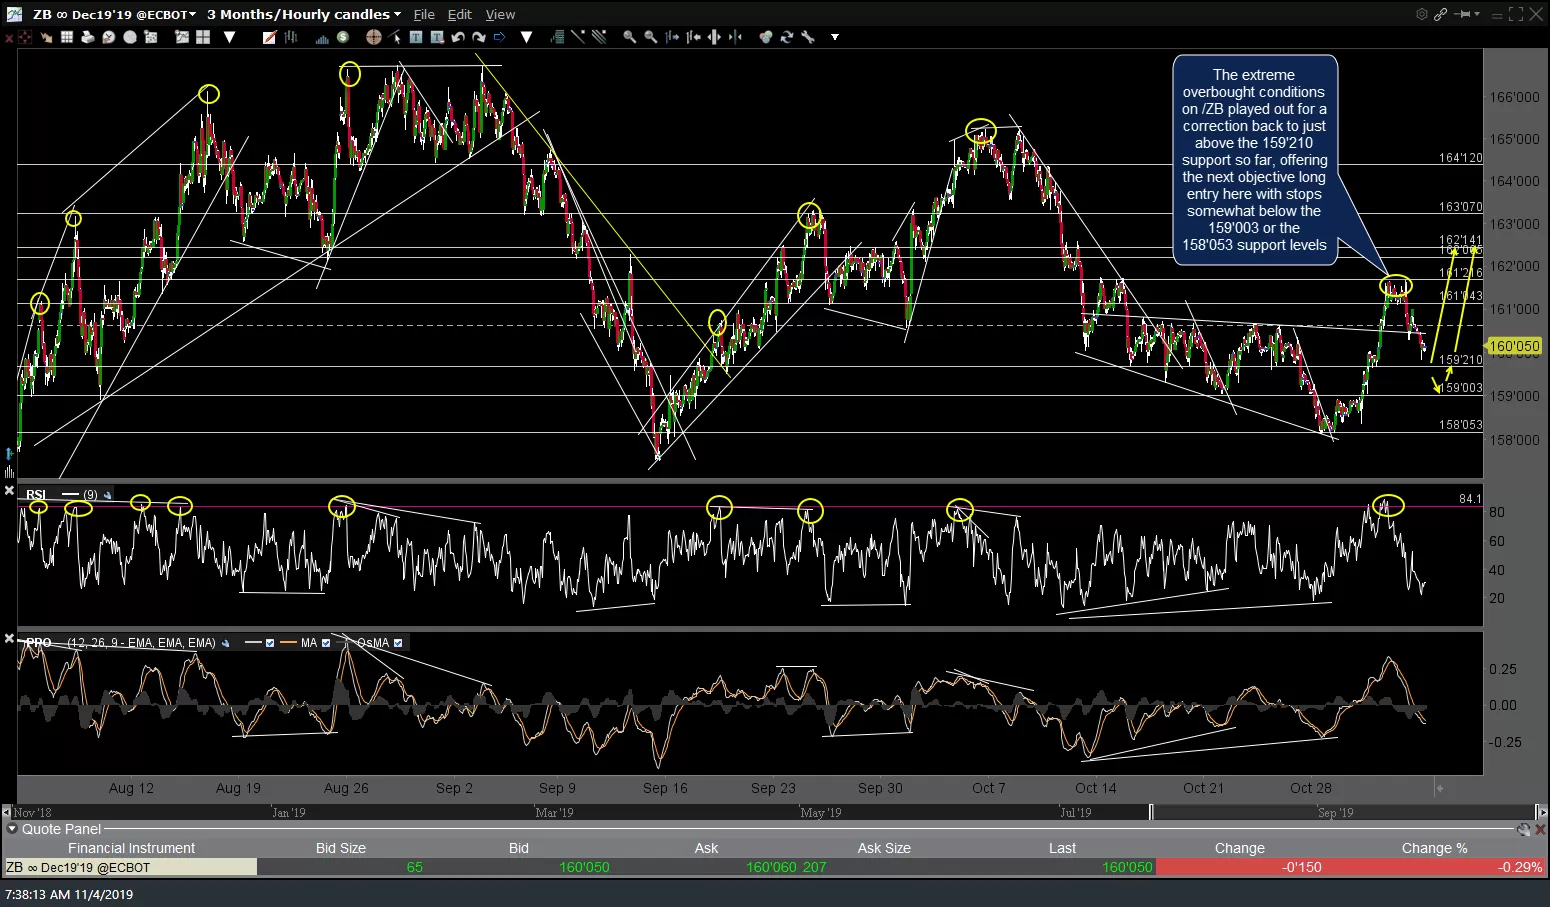
The extreme overbought conditions on /ZB (30-yr T-bond ETF) played out for a correction back to just above the 159’210 support so far, offering the next objective long entry on /ZB or TLT here with stops somewhat below the 159’003 or the 158’053 support levels.
-

- ZB 60m Nov 1st
-

- ZB 60m Nov 4th
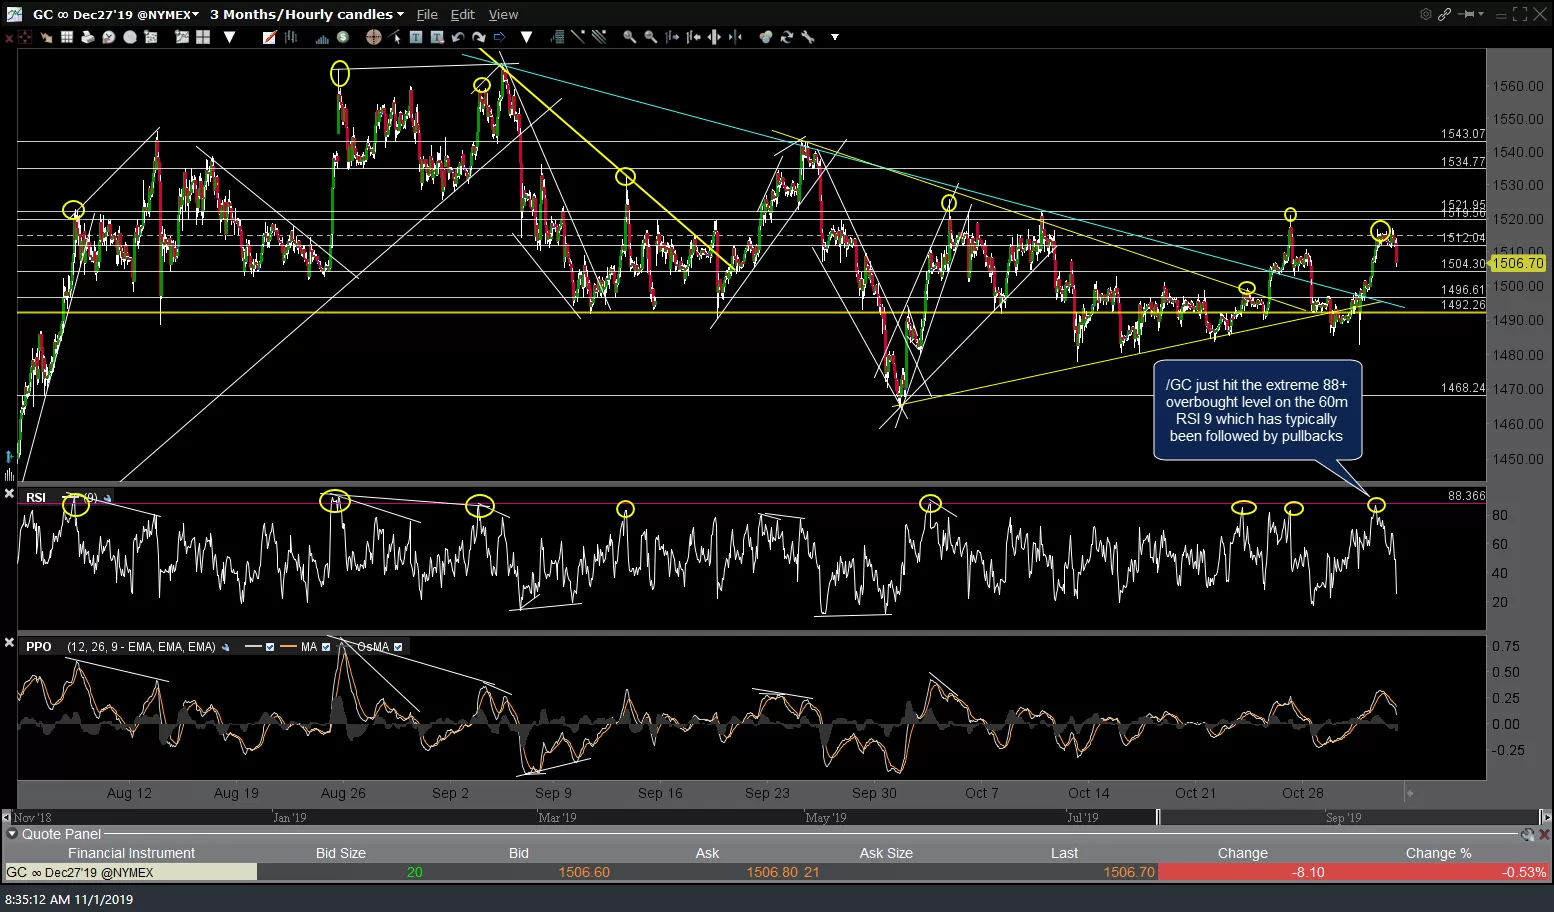
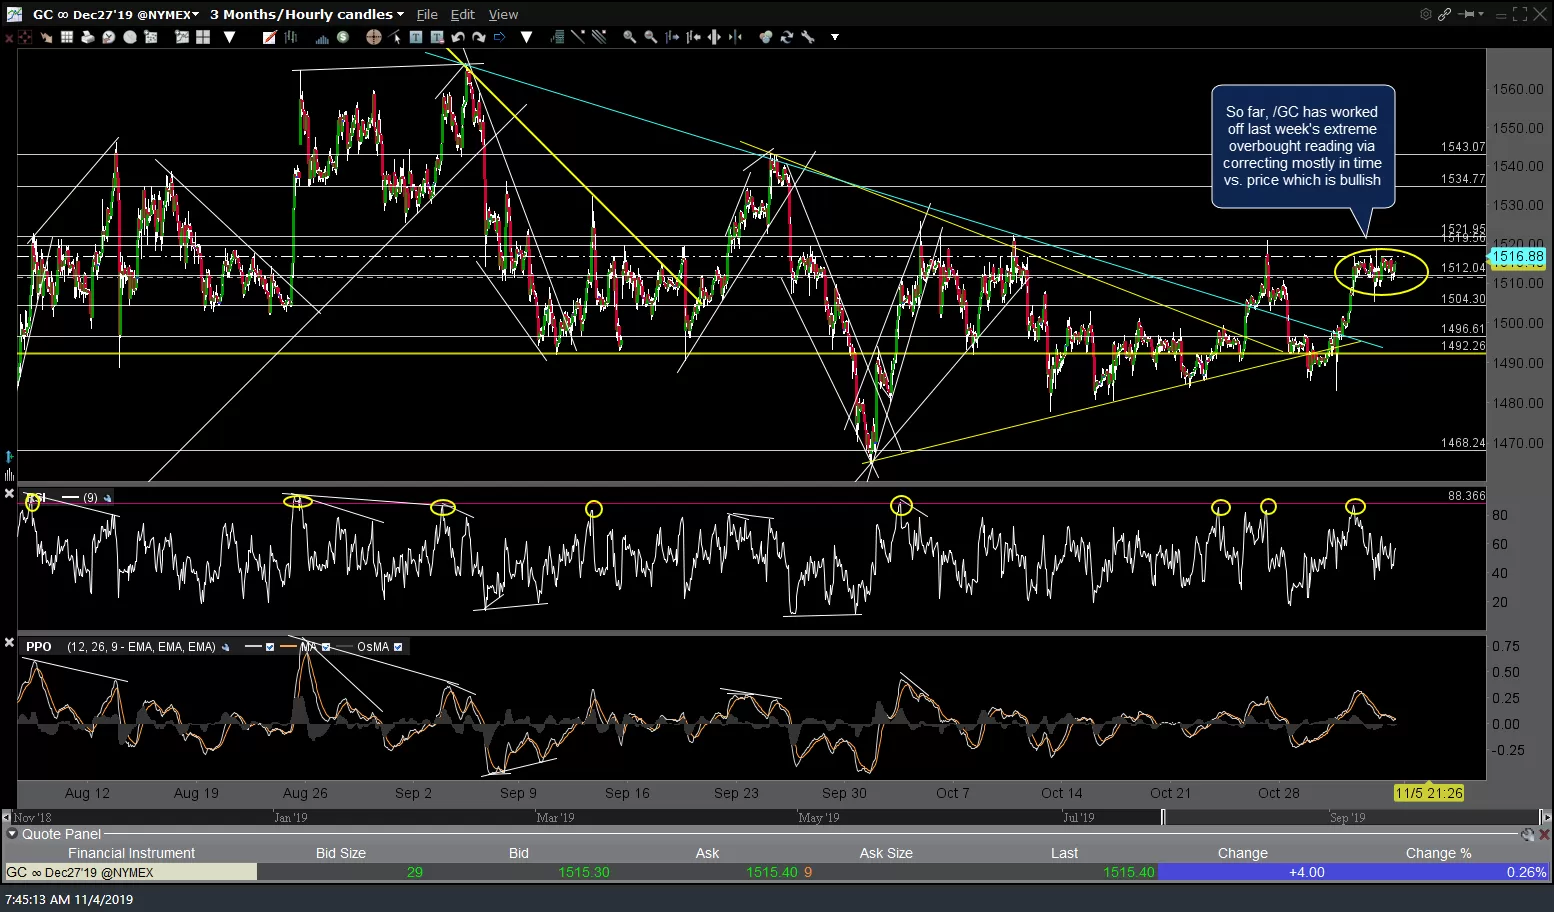
So far, /GC gold has worked off last week’s extreme overbought reading via correcting mostly in time vs. price which is bullish.
-

- GC 60m Nov 1st
-

- GC 60m Nov 4th
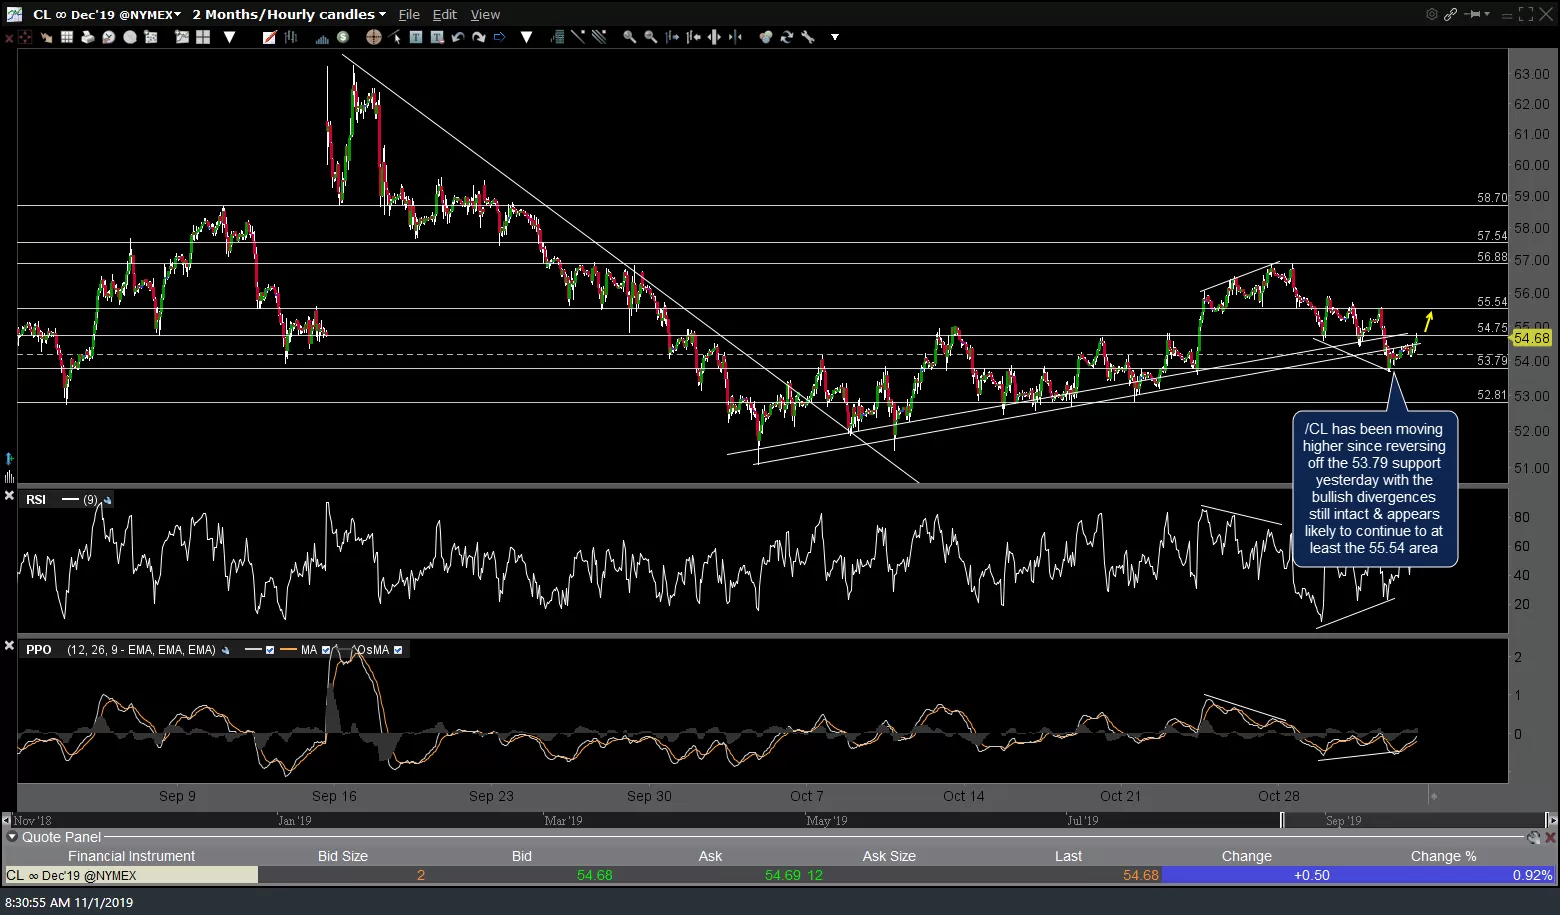
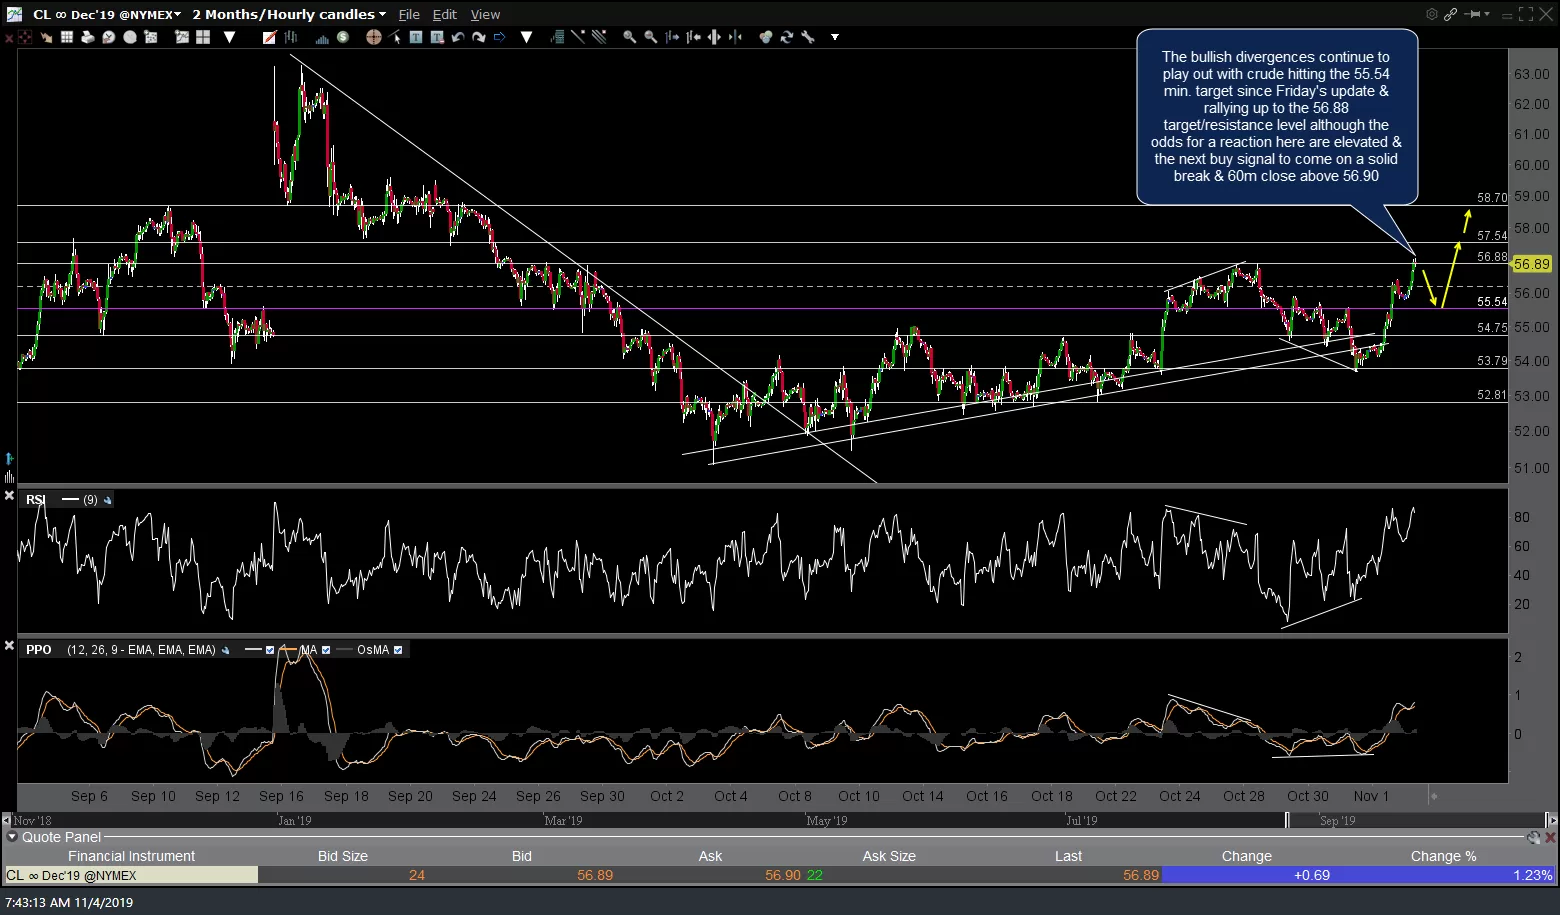
The bullish divergences continue to play out with crude hitting the 55.54 minimum price target since Friday’s update & rallying up to the 56.88 target/resistance level although the odds for a reaction here are elevated & the next buy signal to come on a solid break & 60m close above 56.90.
-

- CL 60m Nov 1st
-

- CL 60m Nov 4th
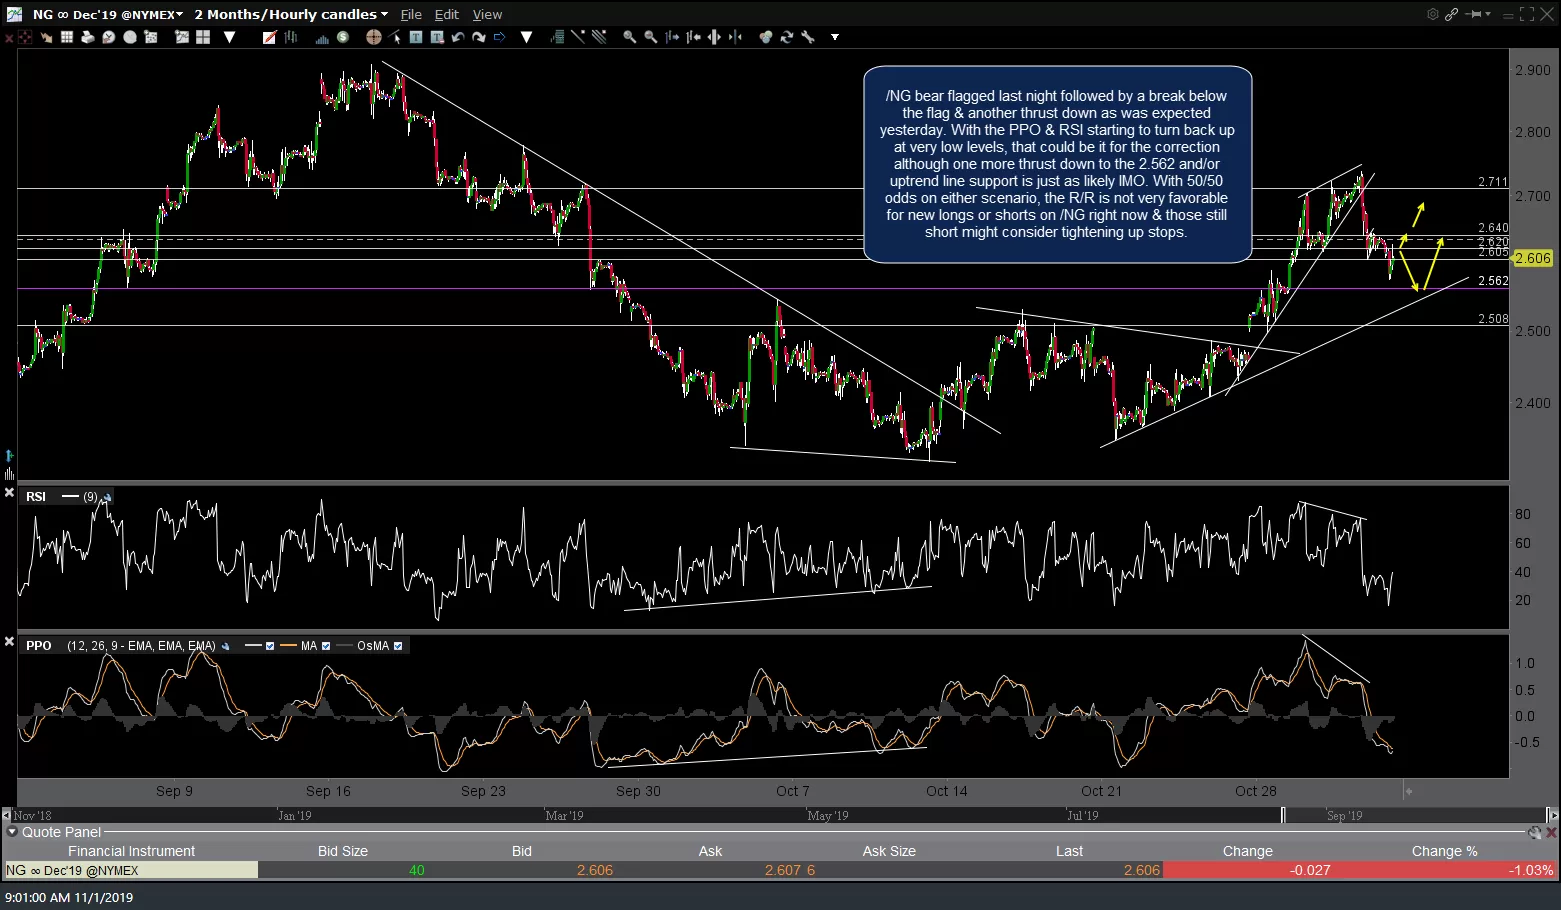
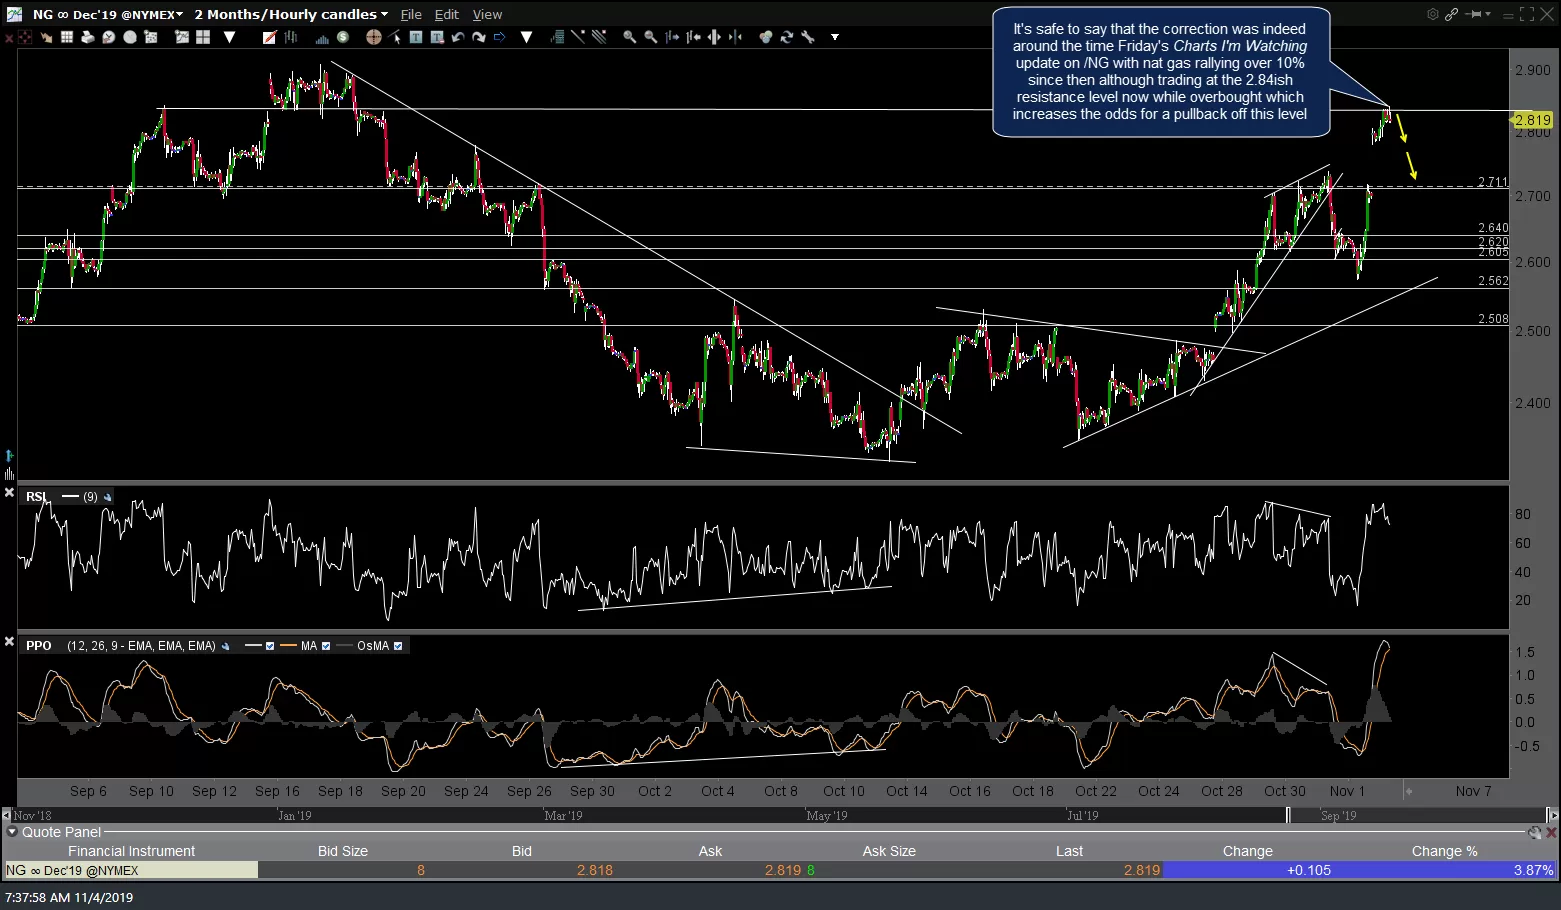
It’s safe to say that the correction was indeed around the time Friday’s Charts I’m Watching update on /NG with nat gas rallying over 10% since then although trading at the 2.84ish resistance level now while overbought which increases the odds for a pullback off this level.
-

- NG 60m Nov 1st
-

- NG 60m Nov 4th
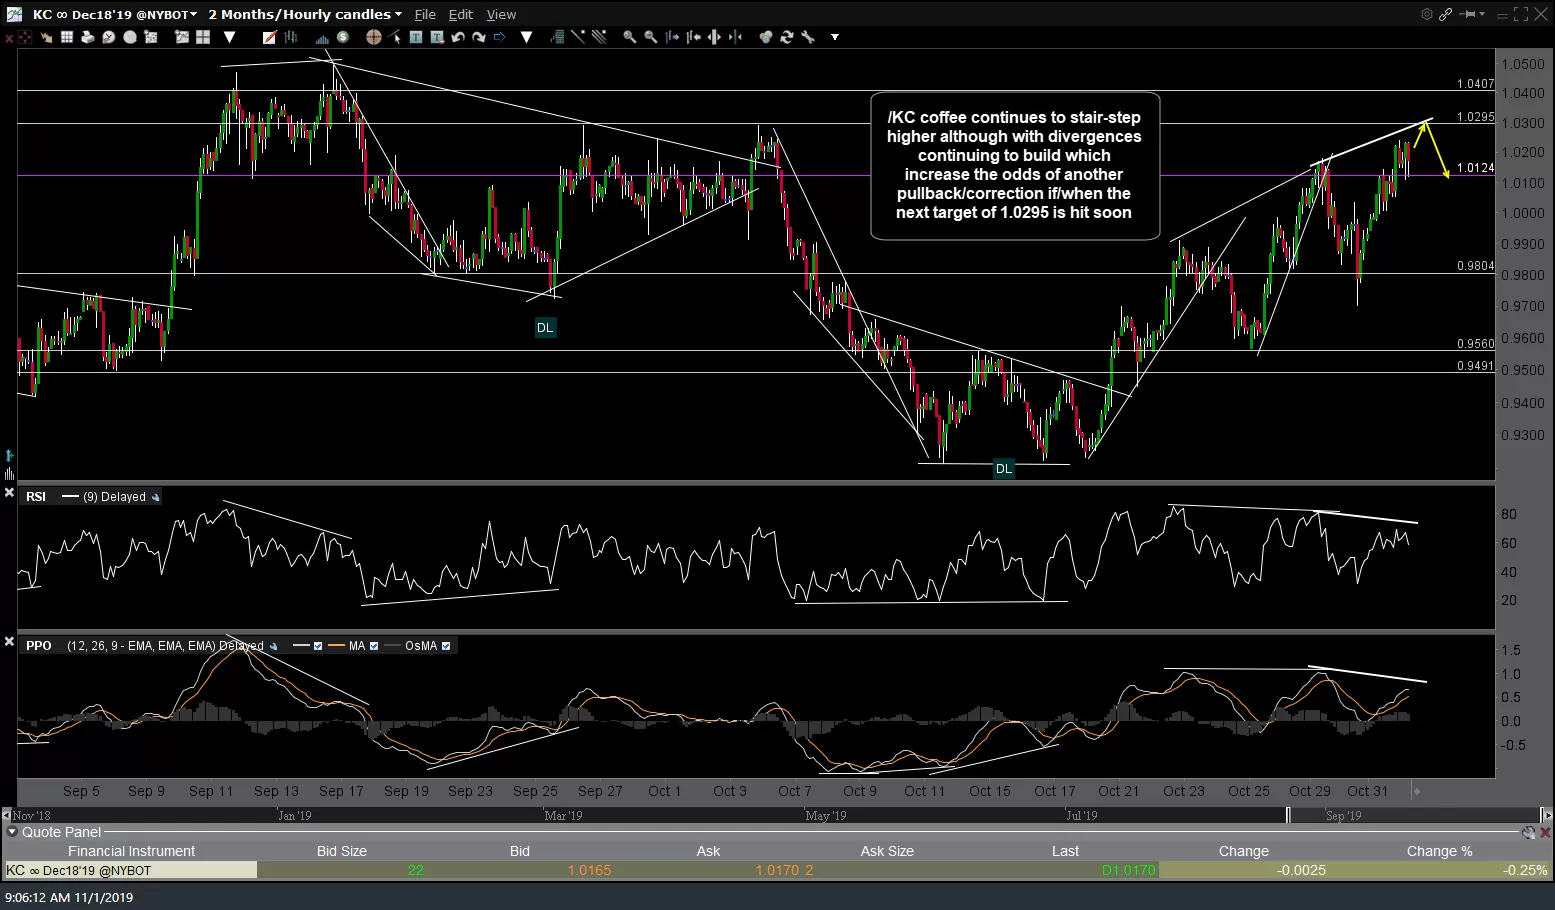
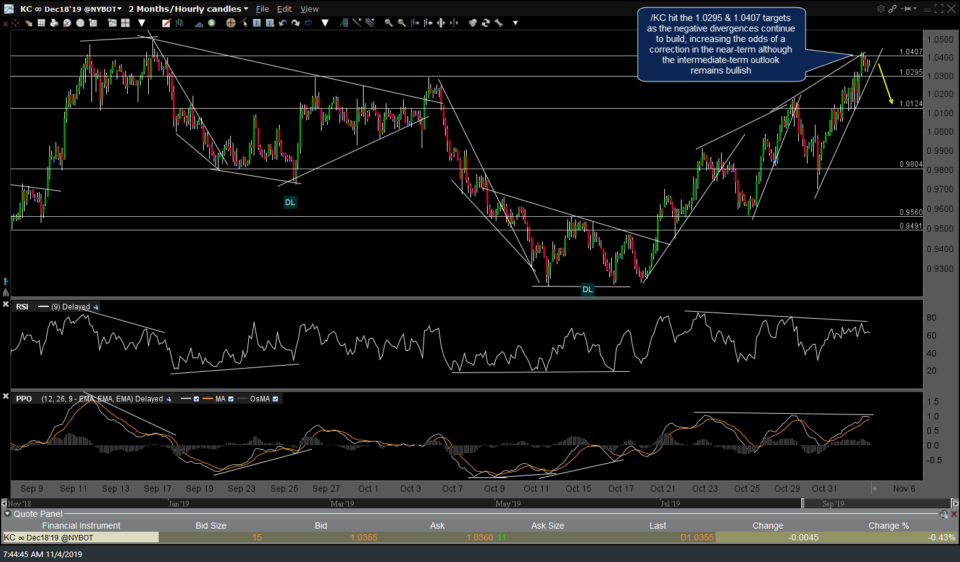
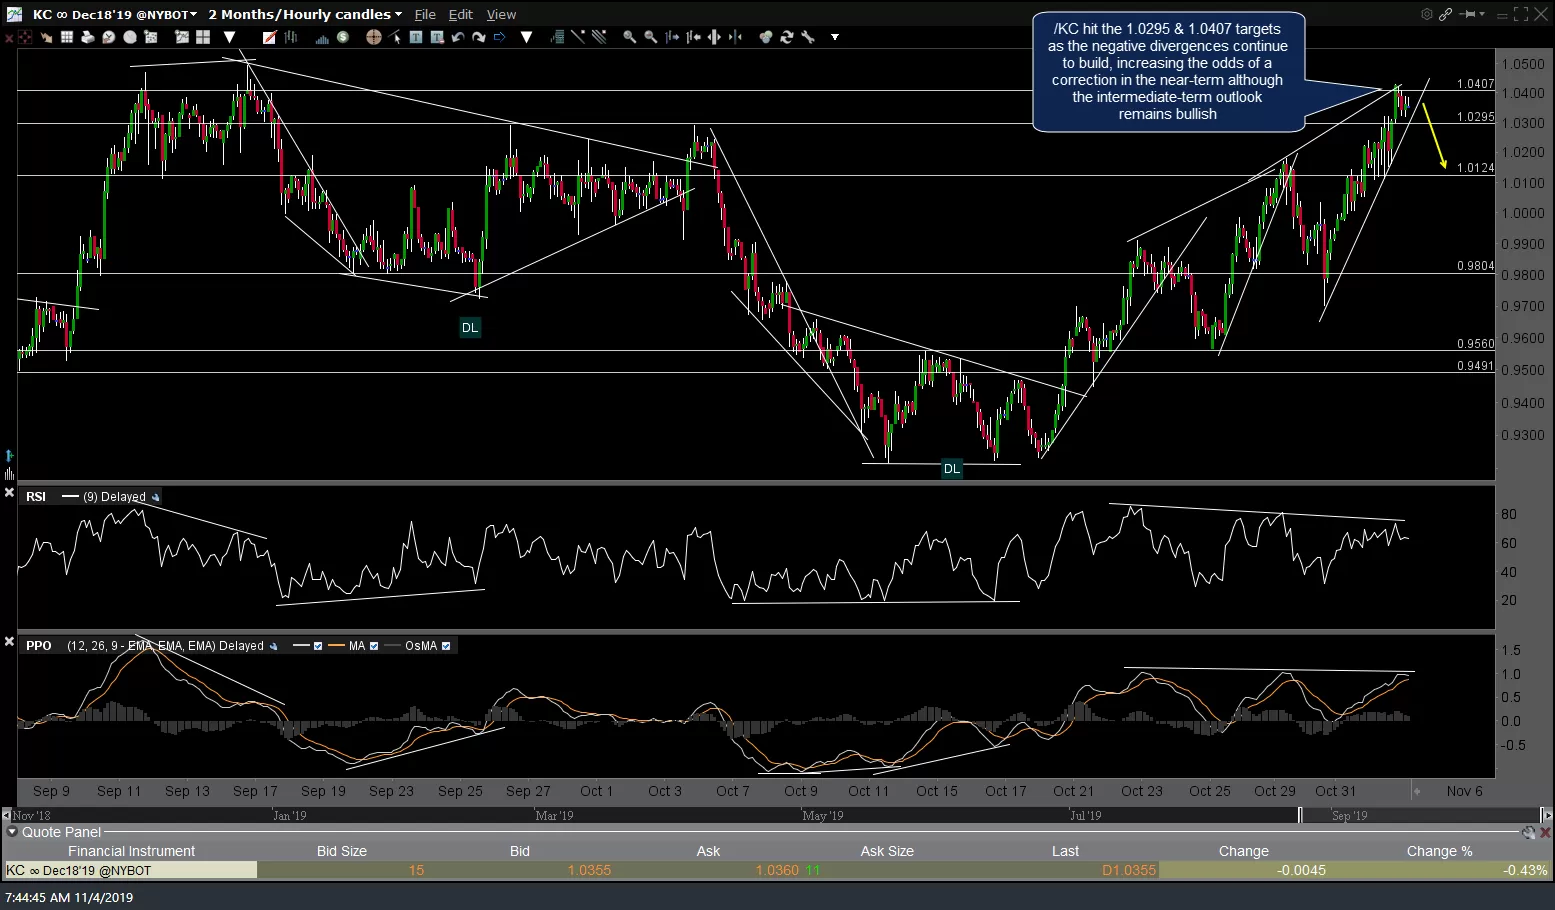
/KC coffee hit the 1.0295 & 1.0407 targets as the negative divergences continue to build, increasing the odds of a correction in the near-term although the intermediate-term outlook remains bullish.
-
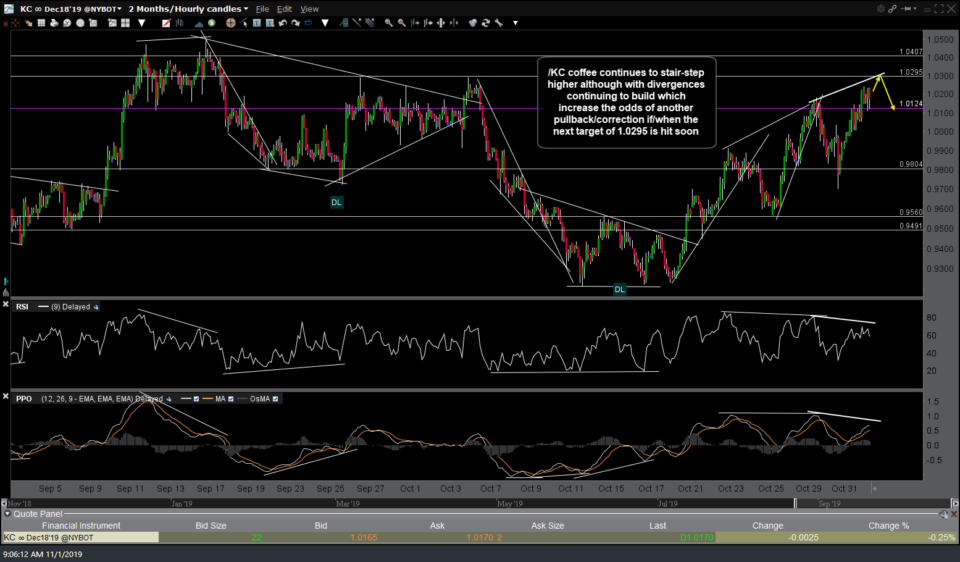
- KC 60m Nov 1st
-
- KC 60m Nov 4th
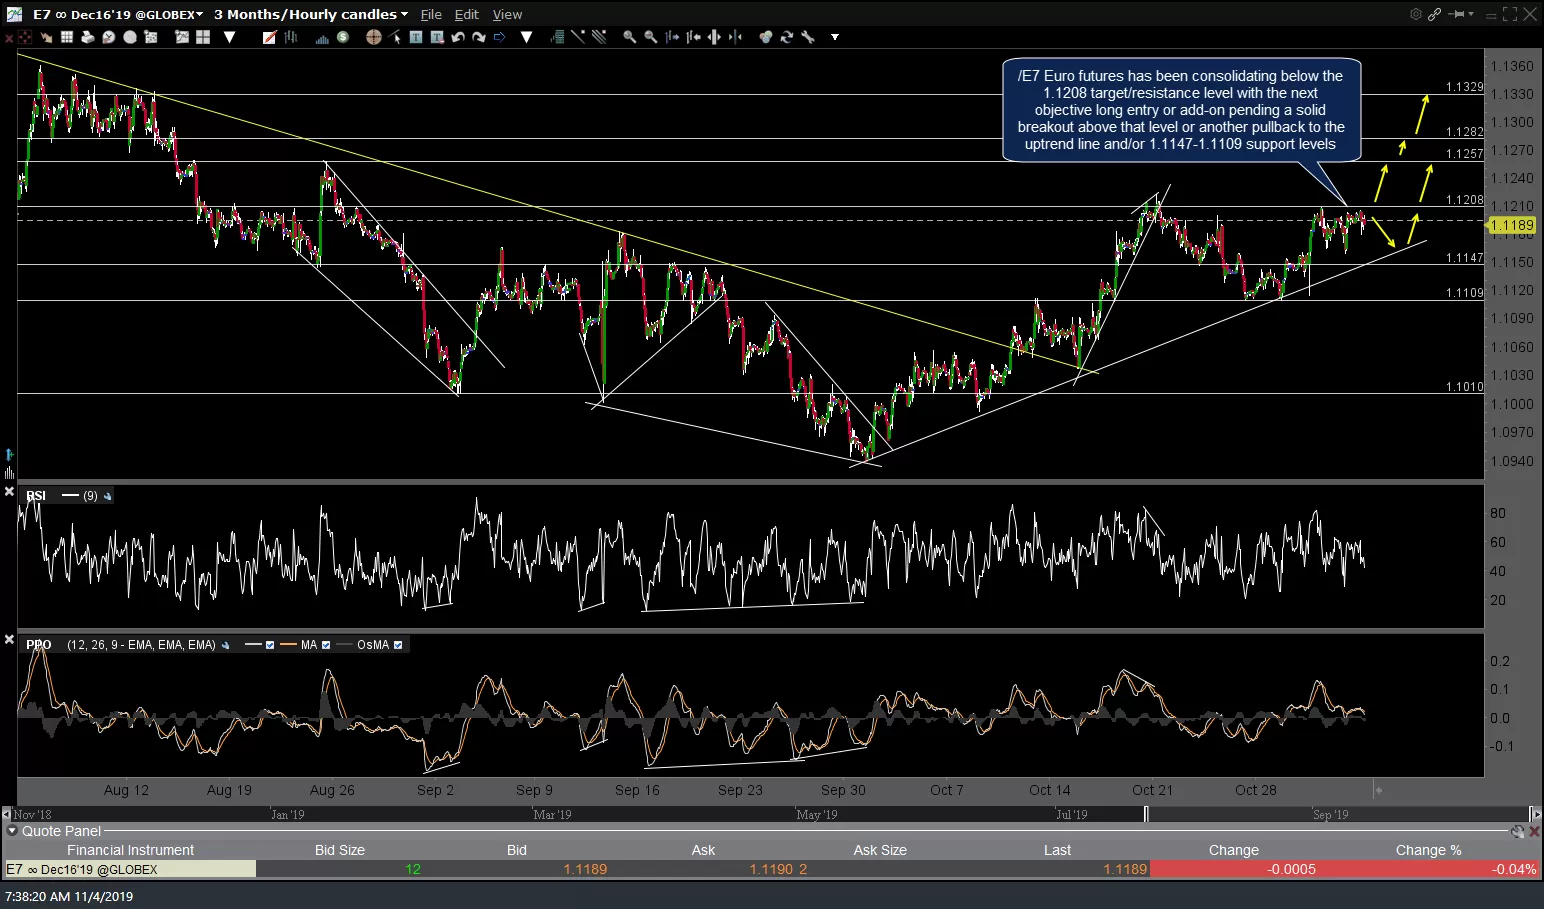
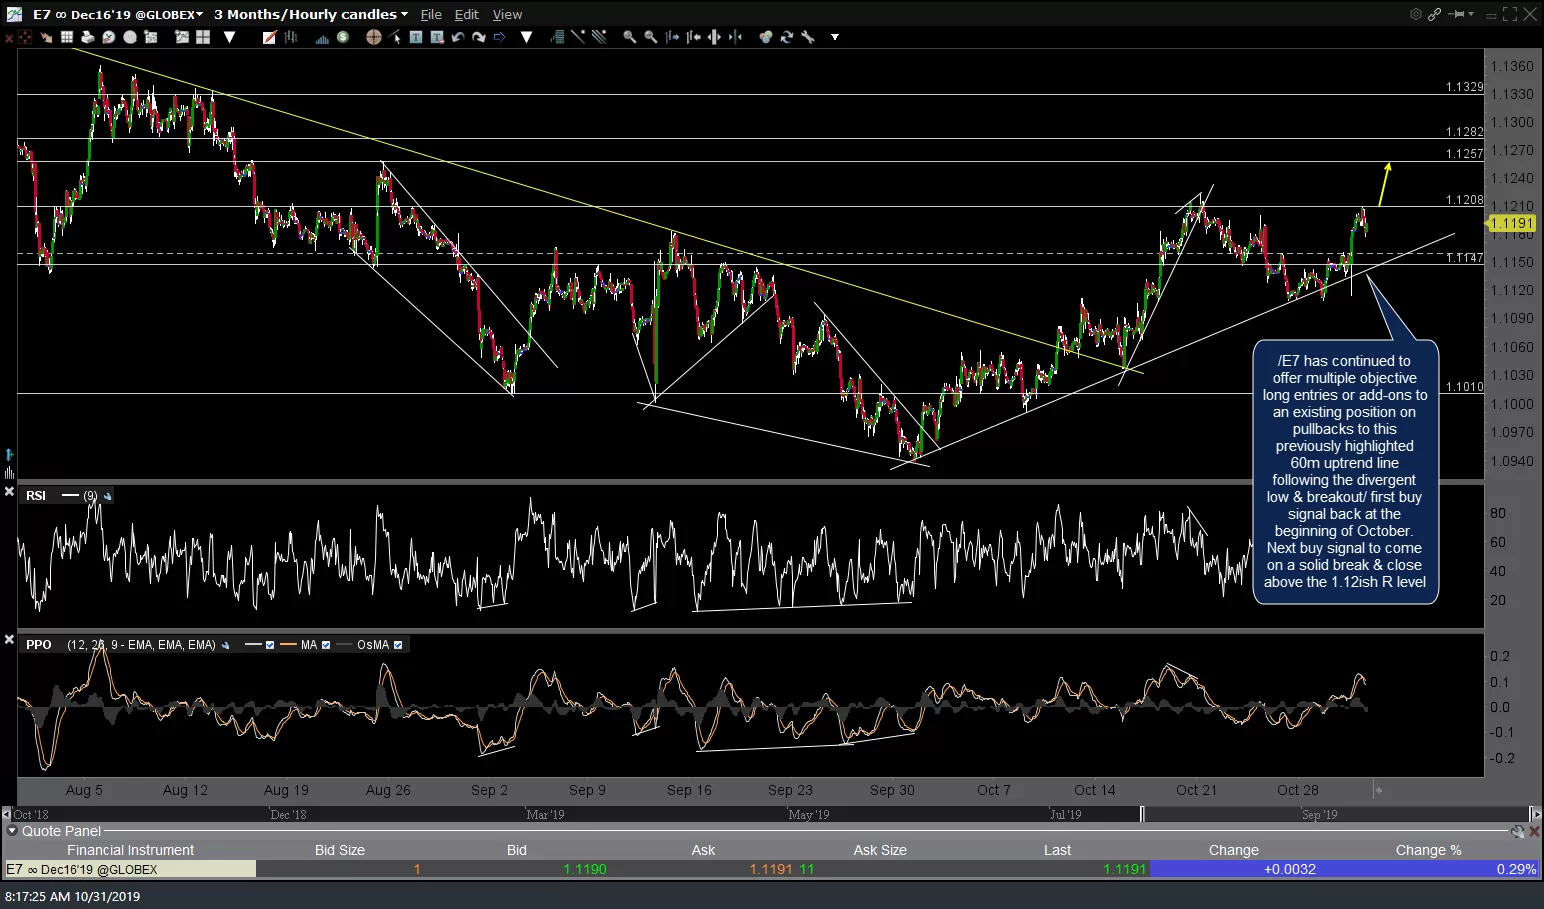
Although the last update on /E7 Euro futures was posted on Thursday, I figured that I’d include another update here as well. /E7 Euro futures continues to consolidate below the 1.1208 target/resistance level with the next objective long entry or add-on pending a solid breakout above that level or another pullback to the uptrend line and/or 1.1147-1.1109 support levels. Thursday’s & today’s updated 60-minute charts below.
-

- E7 60m Oct 31st
-

- E7 60m Nov 4th