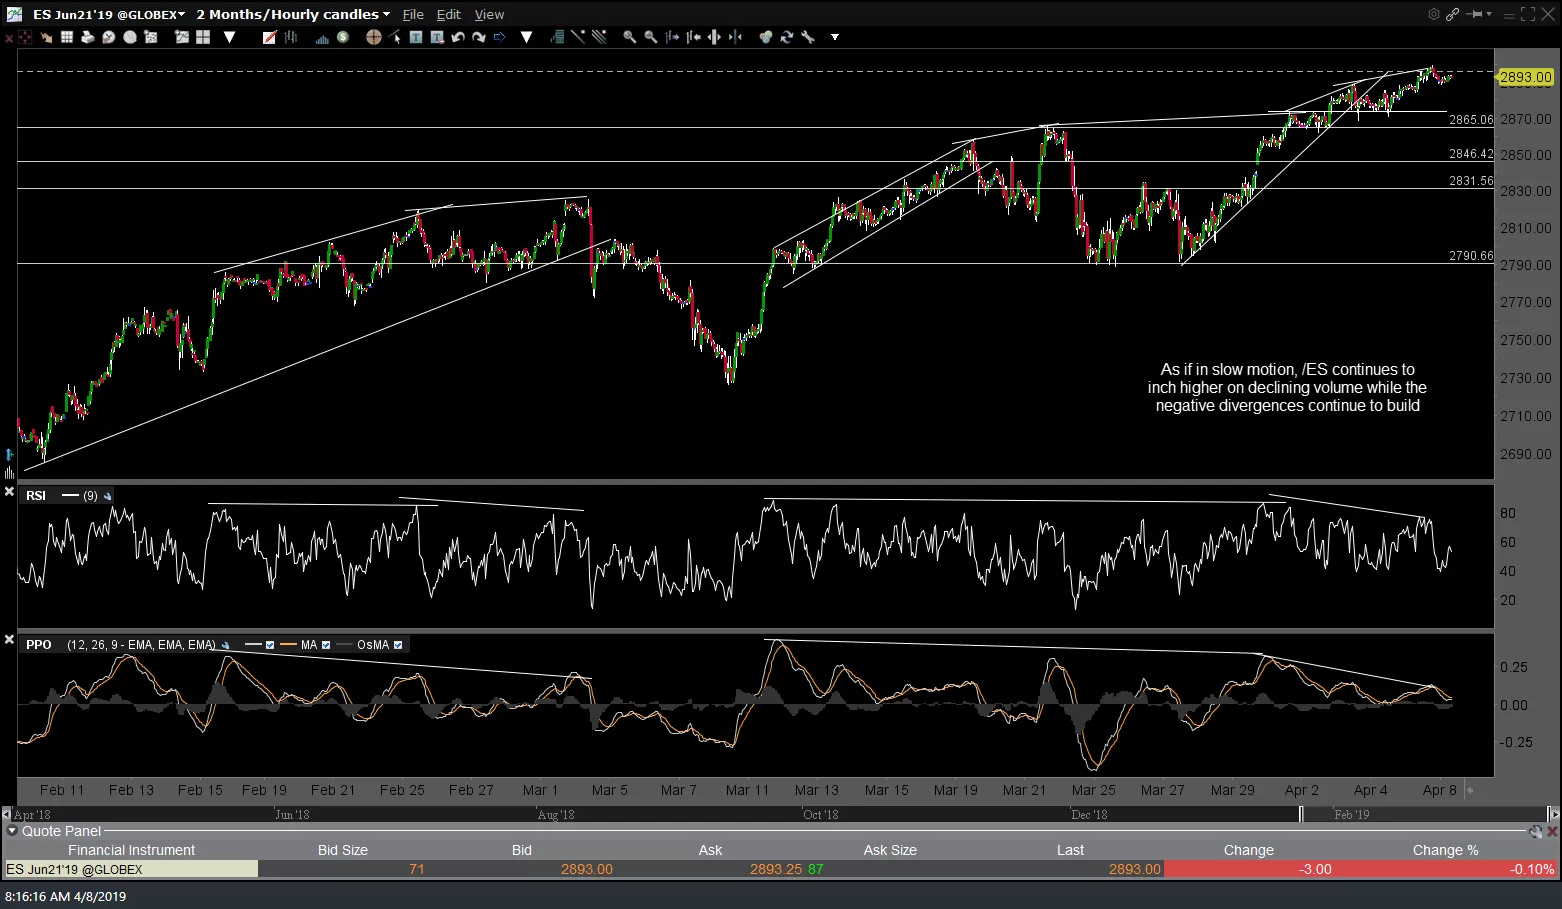
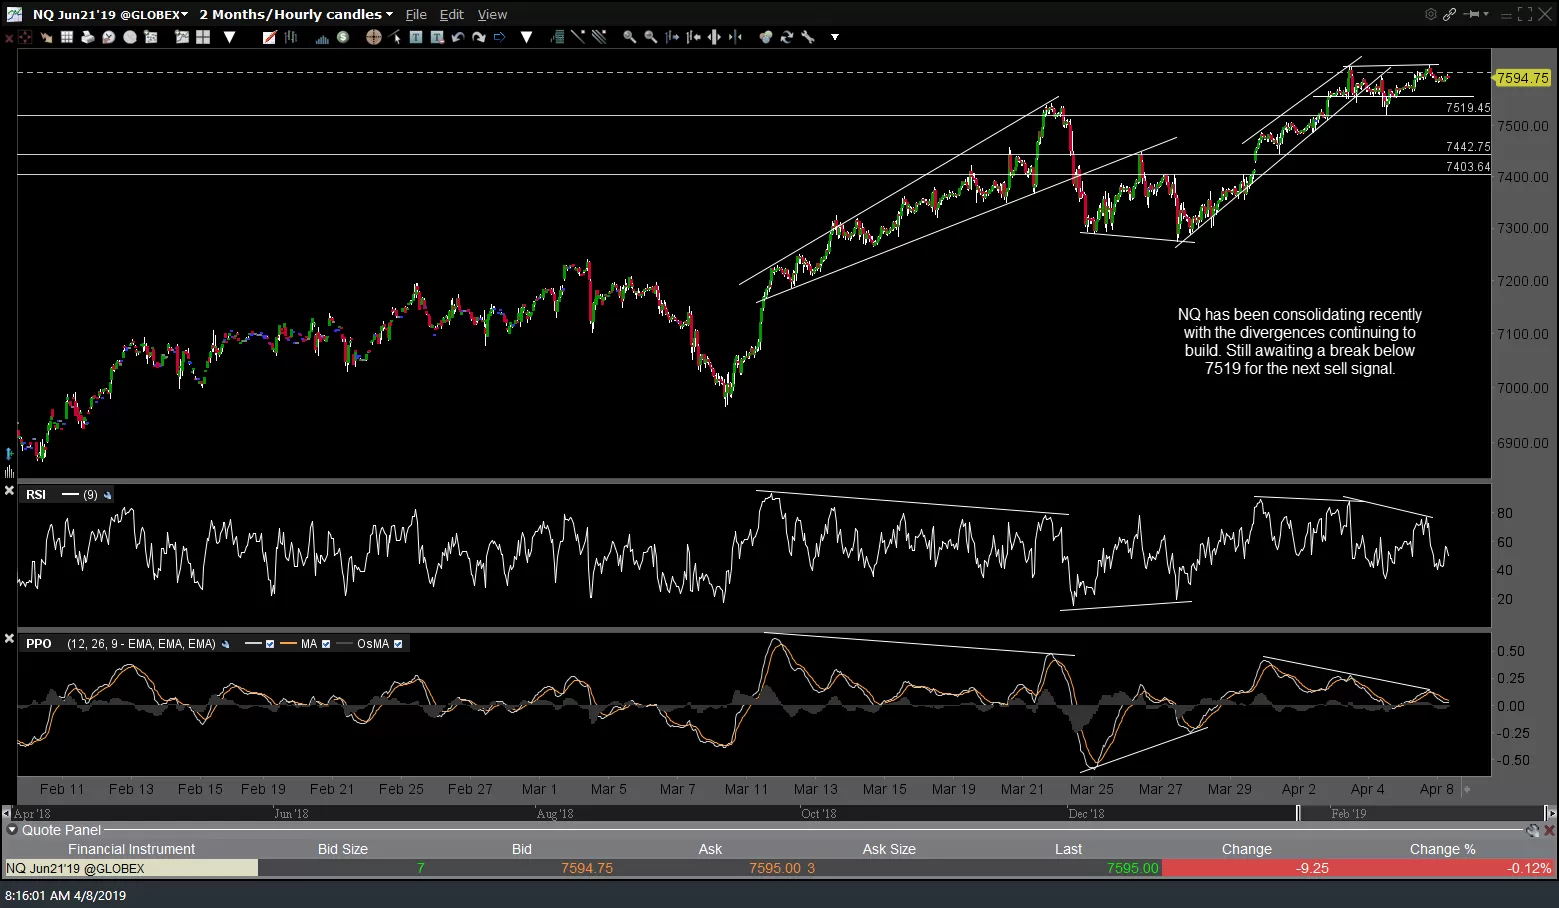
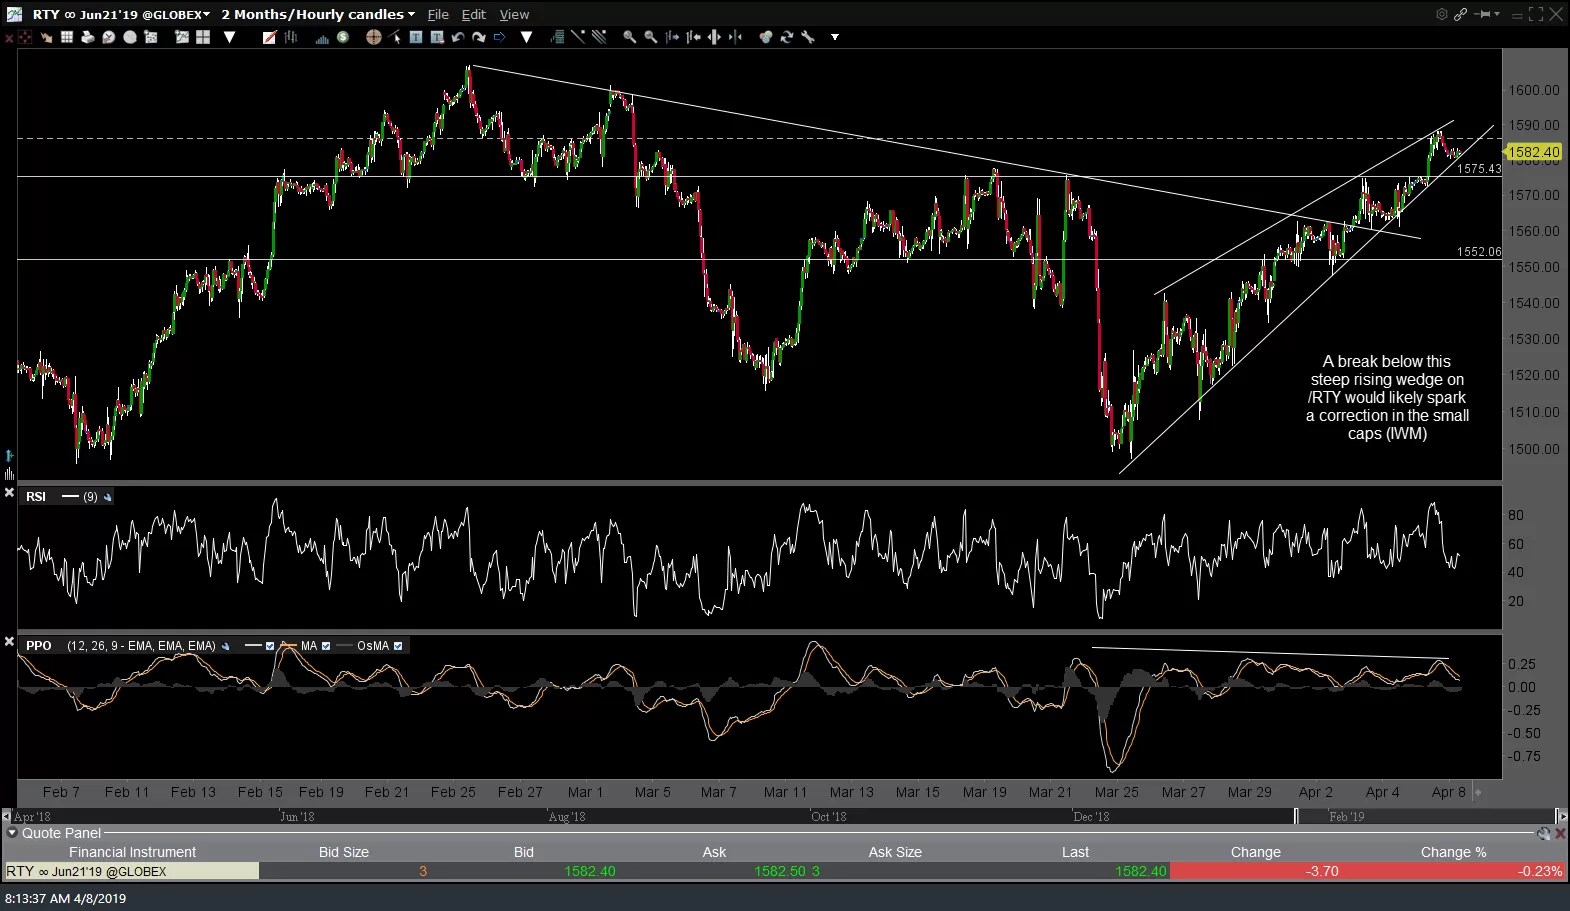
As if in slow motion, /ES (S&P 500 futures) continues to inch higher on declining volume while the negative divergences continue to build. /NQ (Nasdaq 100 futures) has been consolidating recently while the divergences continuing to build as well. Still awaiting a break below /NQ 7519 for the next sell signal. Likewise, a break below this steep rising wedge on /RTY would likely spark a correction in the small caps (IWM). 60-minute charts:
-

- ES 60-min April 8th
-
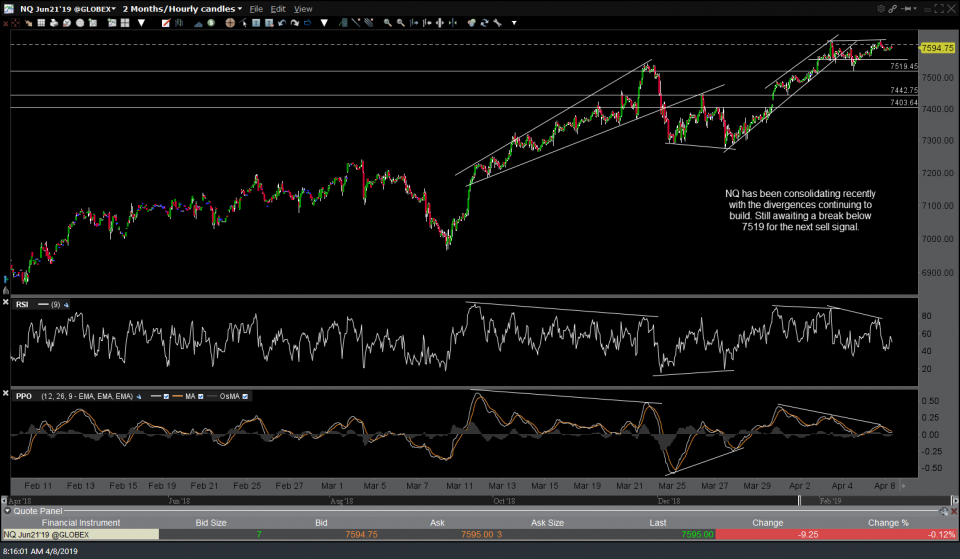
- NQ 60-min April 8th
-
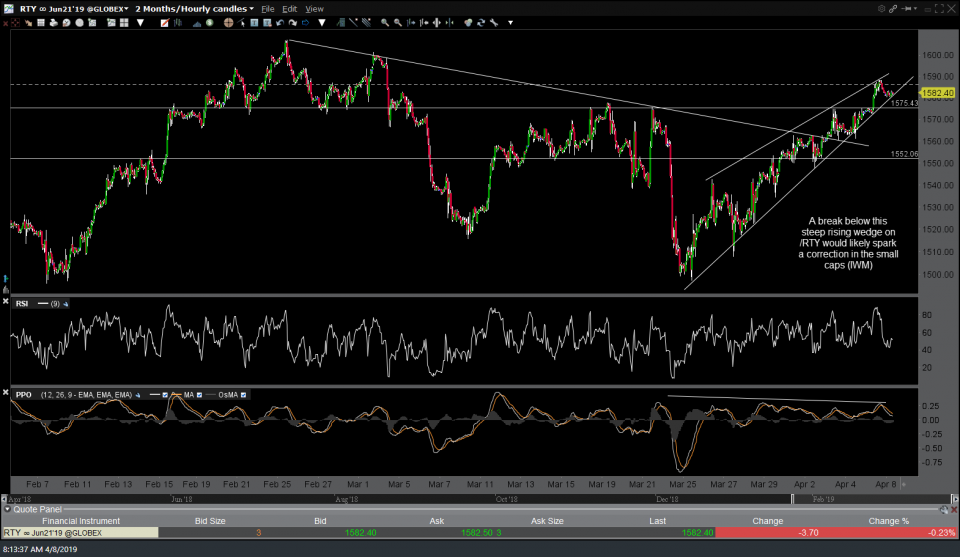
- RTY 60-min April 8th
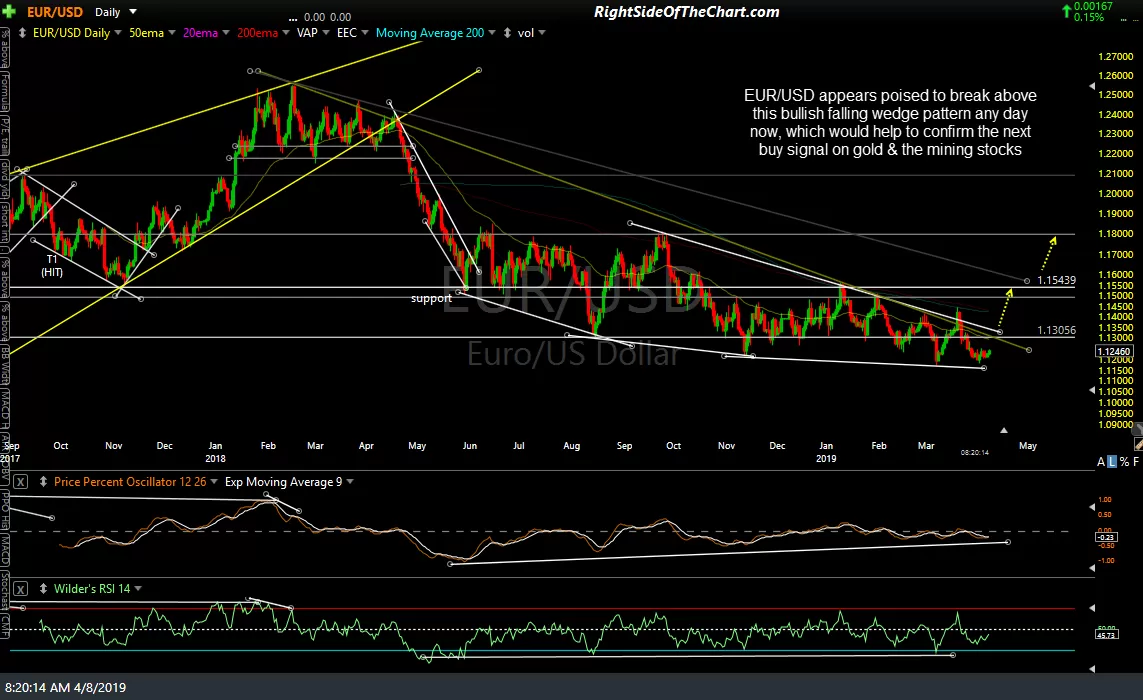
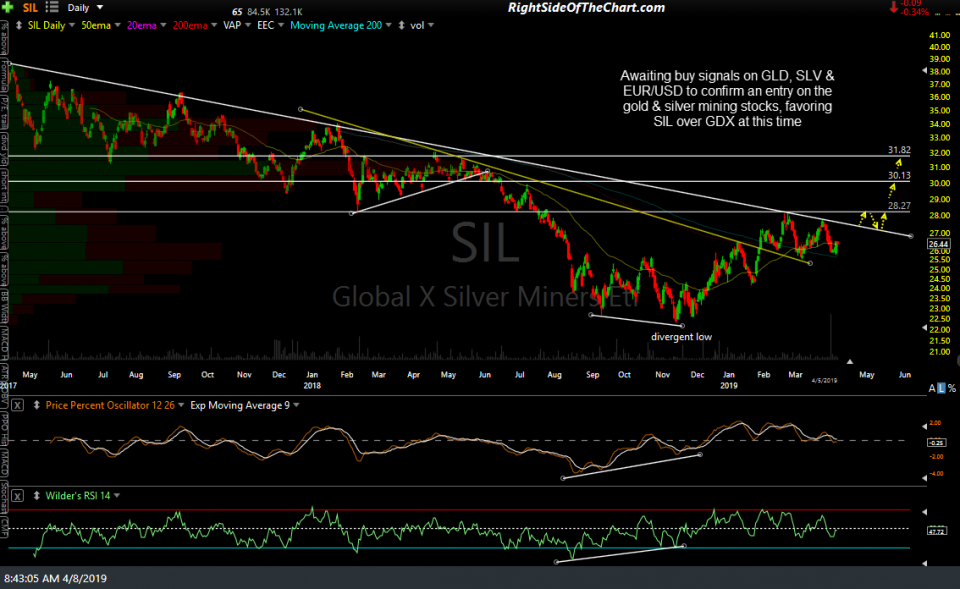
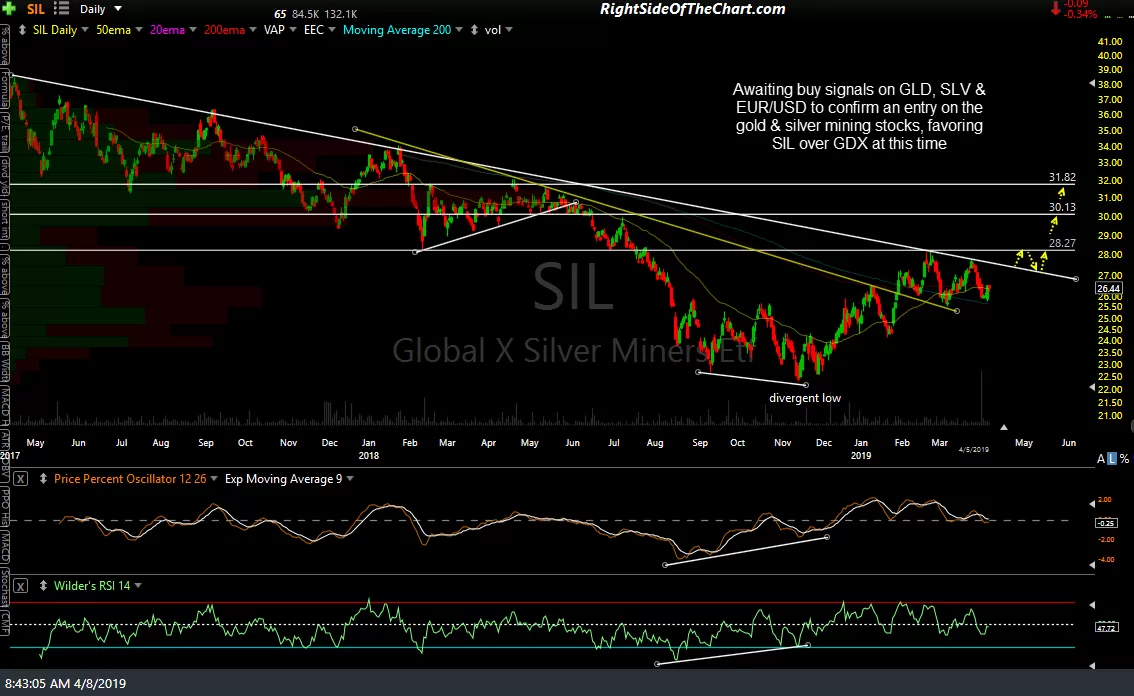
EUR/USD (Euro/$USD forex pair) appears poised to break above this bullish falling wedge pattern any day now, which would help to confirm the next buy signal on gold & the mining stocks. Awaiting buy signals on GLD, SLV & EUR/USD to confirm an entry on the gold & silver mining stocks, favoring SIL (silver miners ETF) over GDX (gold miners ETF) at this time. Daily charts of EUR/USD & SIL below.
-

- EUR-USD daily April 8th
-
- SIL daily April 5th close
/CL crude futures continue to trade mostly in line with the equity markets & may be forming a broadening wedge aka megaphone pattern on this 60-minute time frame. Should stock index futures charts above all trigger sell signals & start correcting soon, crude oil would most likely follow suit while providing more bang for you buck on a short trade. Also worth noting is the fact that both /CL & USO are at resistance while overbought on the daily time frames.

CL 60-min April 8th
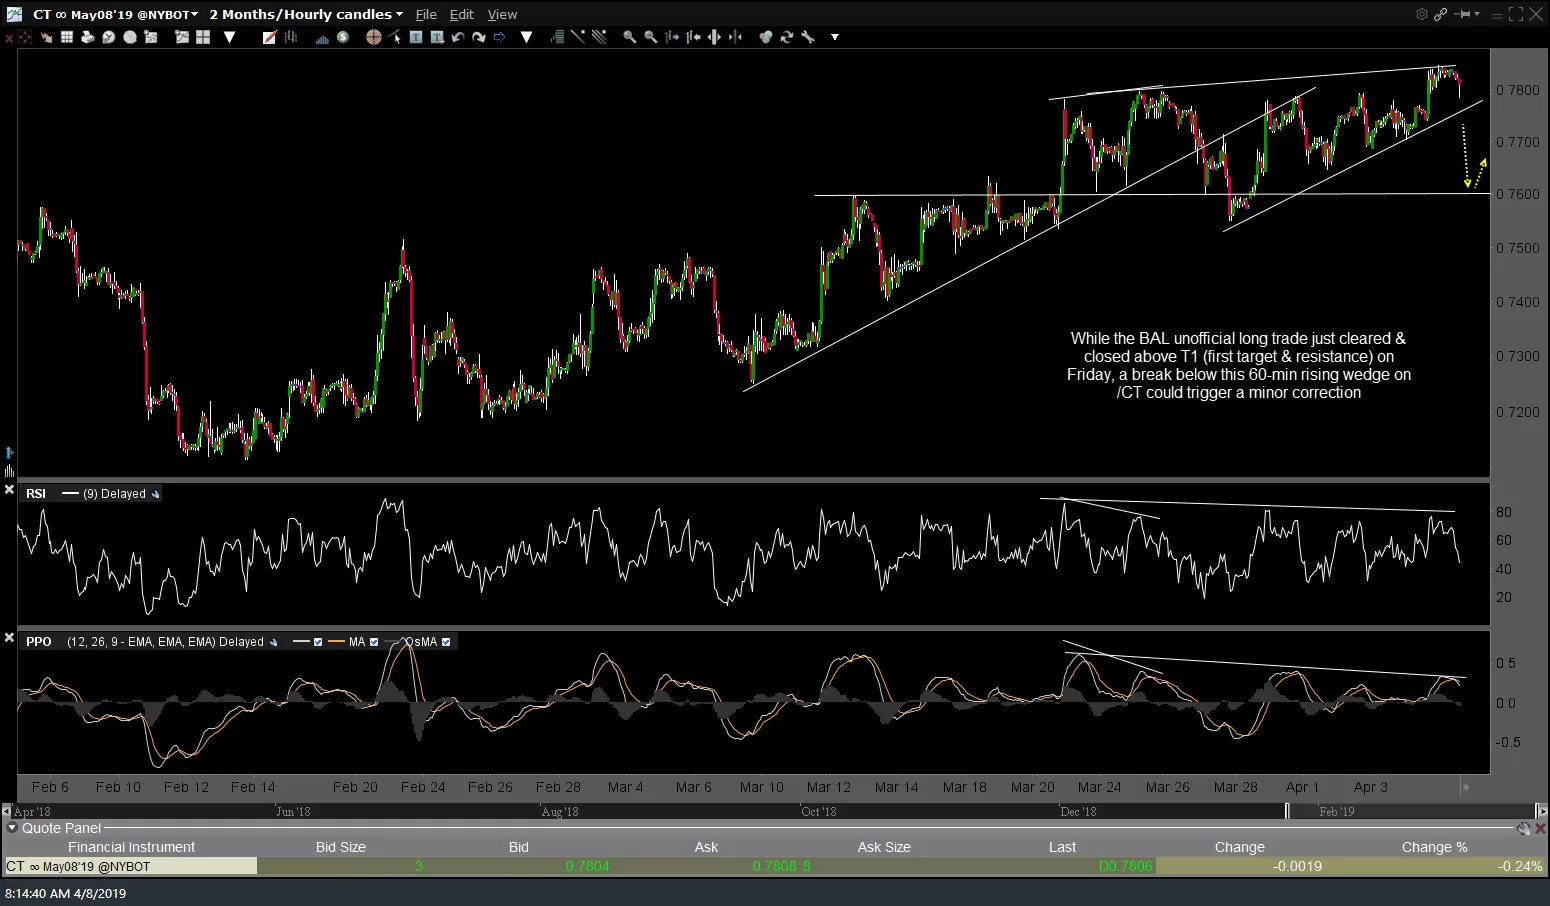
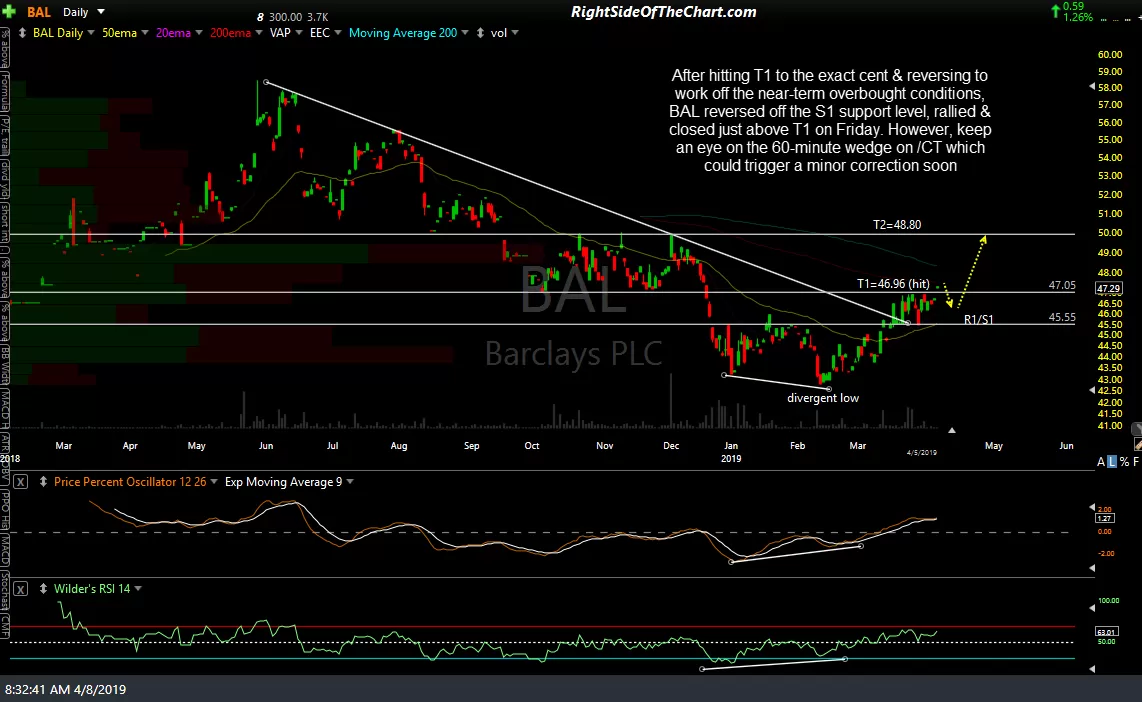
After hitting T1 to the exact cent on March 26th & reversing from there to work off the near-term overbought conditions, BAL (cotton ETN)reversed off the S1 support level, rallied & closed just above T1 on Friday. However, keep an eye on the 60-minute wedge on /CT which could trigger a minor correction soon.
-
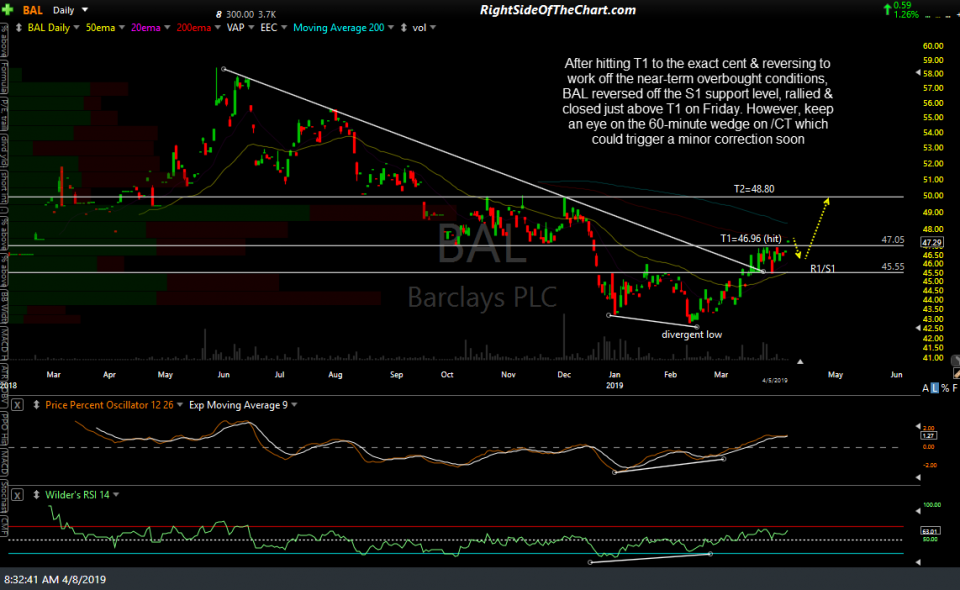
- BAL daily April 5th close
-
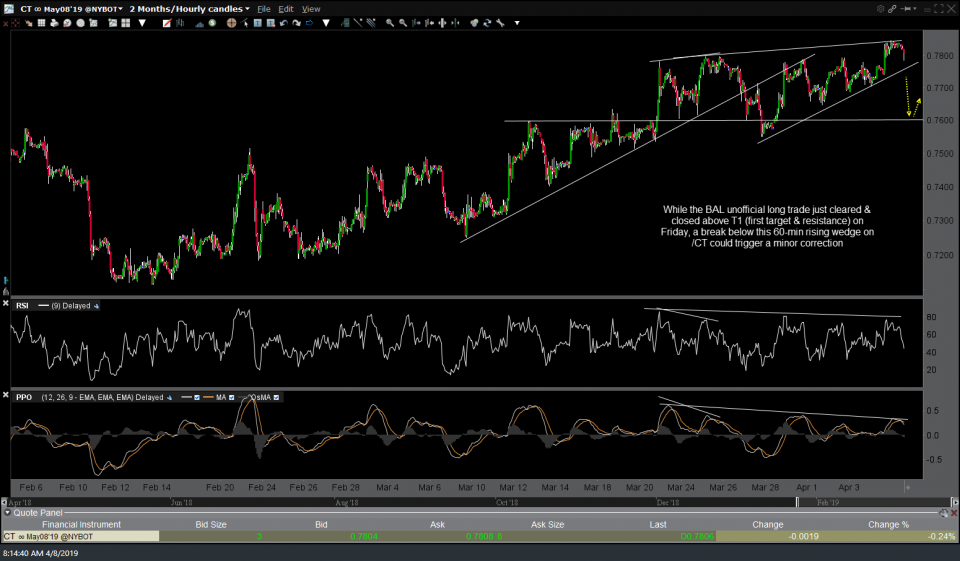
- CT 60-min April 8th