Here’s a quick overview of some of the recently highlighted trade ideas including my trading plan. I have positions in all of these plus various miscellaneous swing & longer-term trend positions so feel free to post a chart request for any other trade ideas, whether shared here or your own.
With trading volumes typically tapering off into the end of the year & whipsaws/false breakouts usually increasing as a result, I typically step down my active trading in the last few weeks of December, spending more time with family & away from my desk. I often talk about the benefits of using OCO (one-cancels-the-other) orders, which has the two-fold benefits of both discipline (sticking with your trading plan and booking profits or losses too early by second guessing a trade) as well as providing the luxury of not having to be in front of the computer all day. You can click here to view video on using OCO orders that I made back in 2018 for those not already familiar with them.
In order to let the dust settle following a market-moving FOMC announcement, my preference for the QQQ short position is to wait until after the close next Tuesday & then set a stop just above the most recent reaction high between now & then. My reasoning is that I suspect any post-FOMC rally will peak on Monday, at the latest, plus one day for a little margin of error). Such a stop does allow for the potential for unquantified losses but this was & remains only a relatively small starter position on what I’m still viewing as a long-term trend position with the intention of scaling in, or adding to, if & when the additional sell signals/support breaks that I’ve been outlining in recent videos occur (the last of which will be those key purple support levels on QQQ & the Magnificent 7 stocks, at which point would warrant a full/aggressive short position). Daily chart of QQQ with the intermediate-term swing targets below (long-term trend targets remain on weekly charts).
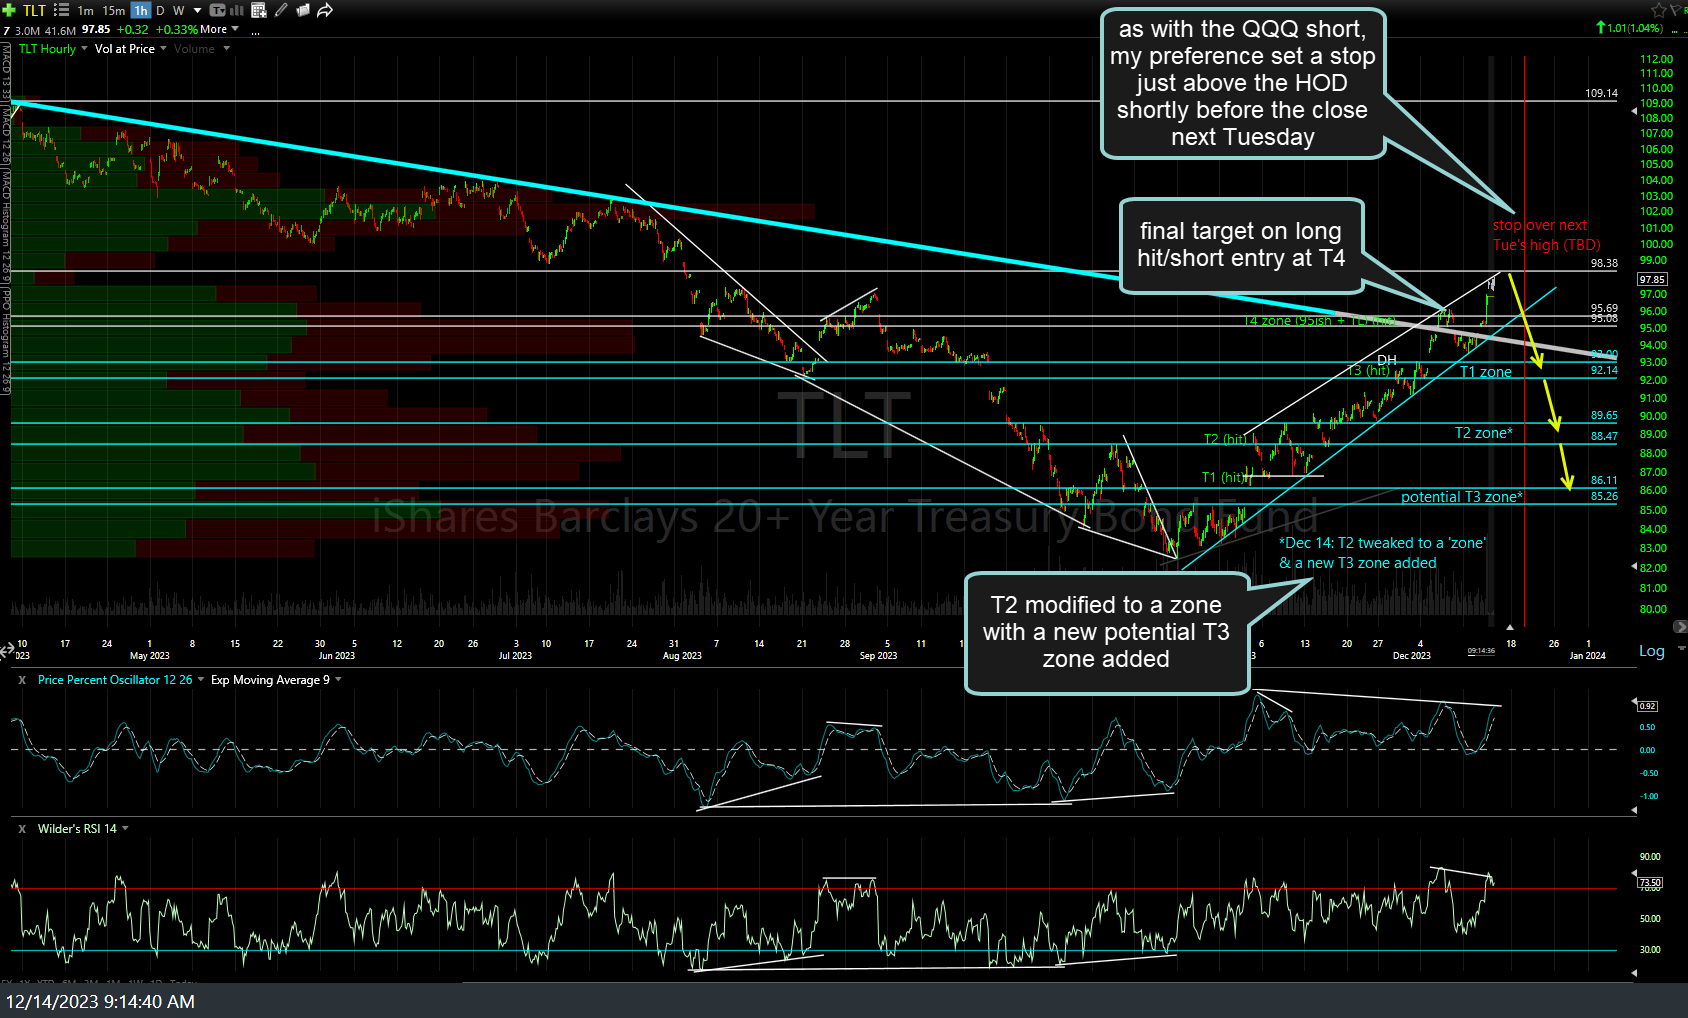
I plan to use the same strategy (stop set just above the most recent reaction high between now & Tuesday’s close) on TLT which was entered at the top of the 4th & final price target zone for the recent long trade entered off the Oct low. That also allows for an unquantifiable loss although as I type (~10 am ET), that trade is only 2% above last week’s entry price & based on the technical posture, including but not limited to the extreme near-term overbought conditions, it appears the upside between now & Tuesday’s close is limited. Of course, that is my trading plan & certainly may not be suitable for everyone. TLT 60-minute chart below.
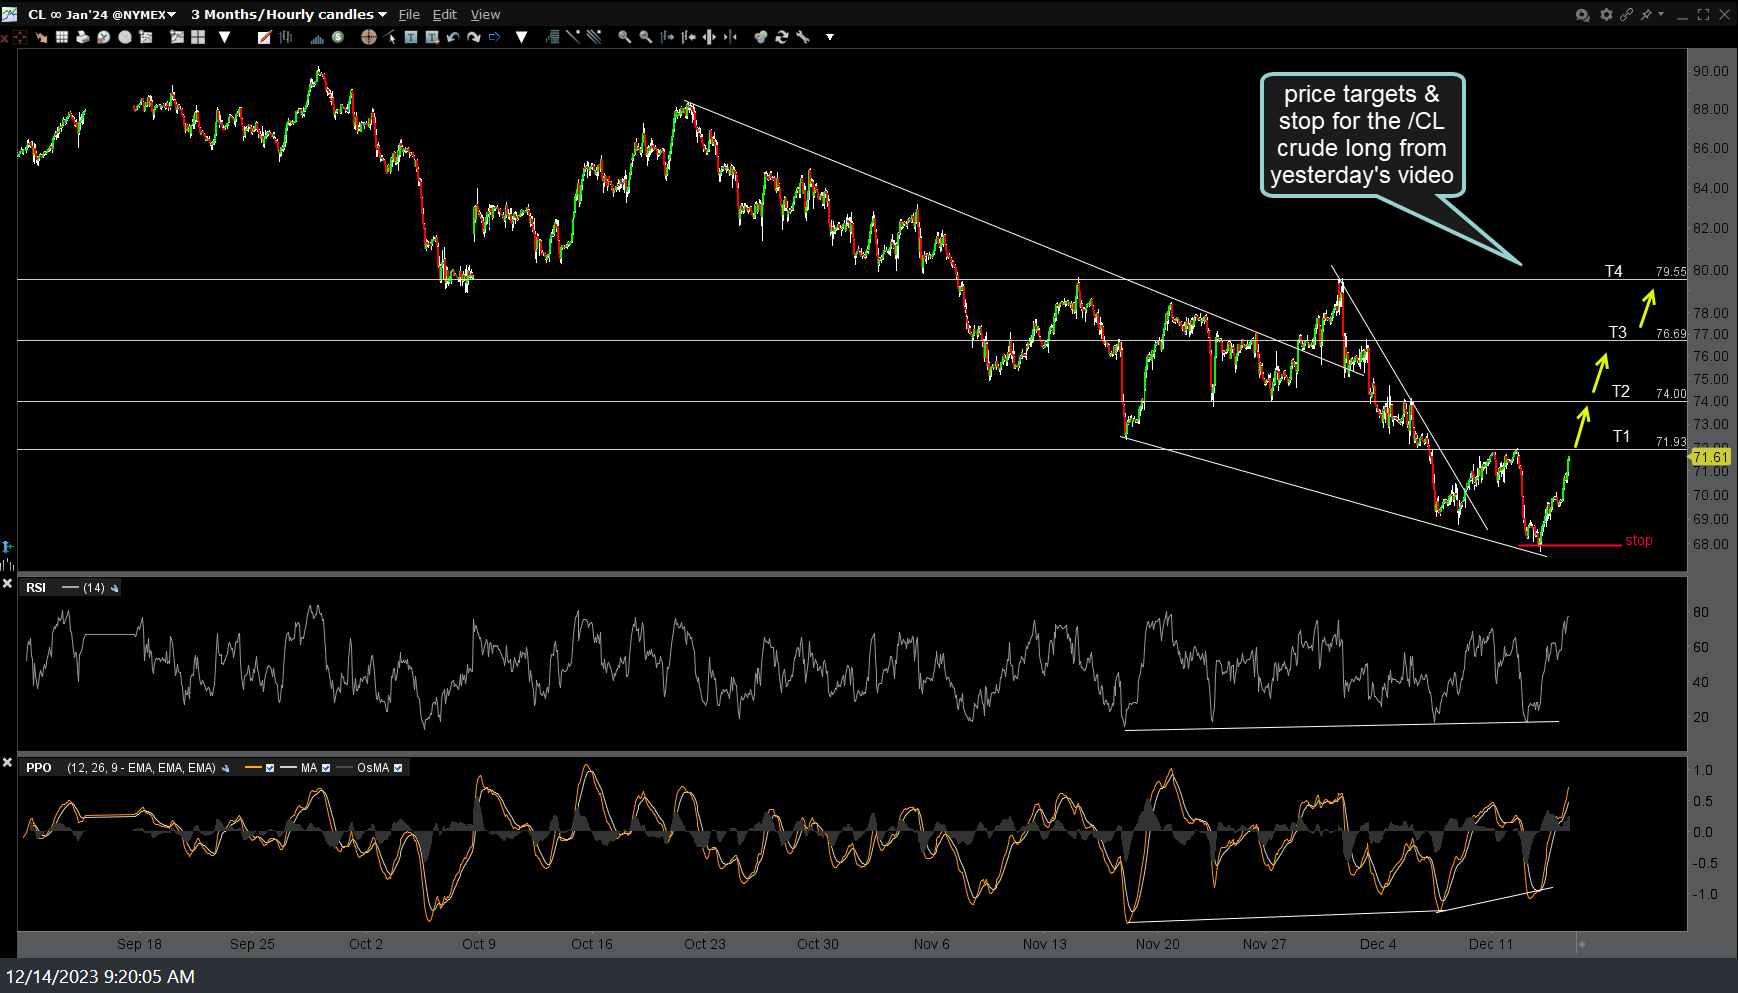
I highlighted both crude oil & natural gas as objective longs in yesterday’s video. /CL (crude futures) has continues to climb & most likely will do so, especially if the stock market continues to rally and/or yields continue to fall (as a bet on renewed hopes for economic growth/diminished recession expectations). I took the trade primarily based on the bullish technicals as discuss in yesterday’s video but I also view this as an indirect hedge to my index shorts & if I’m really lucky, both will play out going forward. Either way, prices targets & suggested stop on the 60-minute chart below (USO or other crude ETN traders can align these resistance levels/targets).
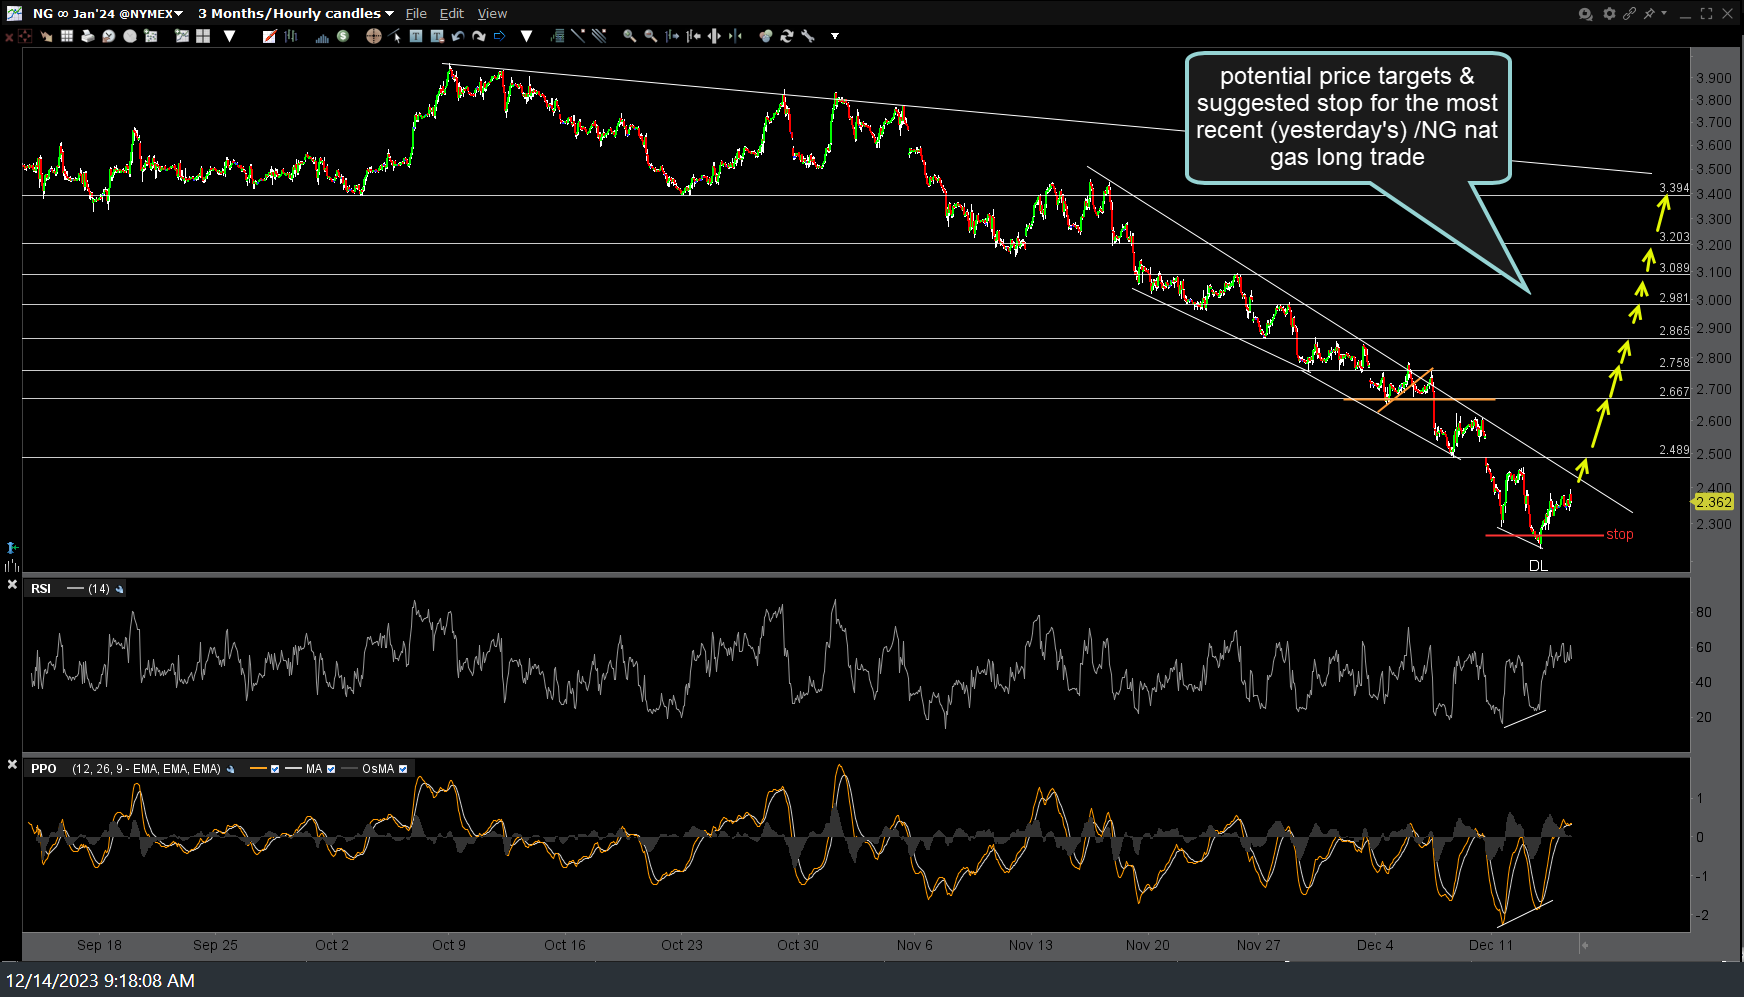
The 60-minute chart of /NG (natural gas futures) lists potential price targets & suggested stop for the most recent (yesterday’s) /NG nat gas long trade. UNG (nat gas ETN) traders can align these levels & I will be glad to mark up a chart of UNG, if requested in the comments below.
The WEAT (wheat ETN) swing trade will trigger a minor buy signal on break of this minor downtrend line with an even stronger buy signal on a solid break above T1 (which has already been hit twice). 60-minute chart with price targets & suggested stop.
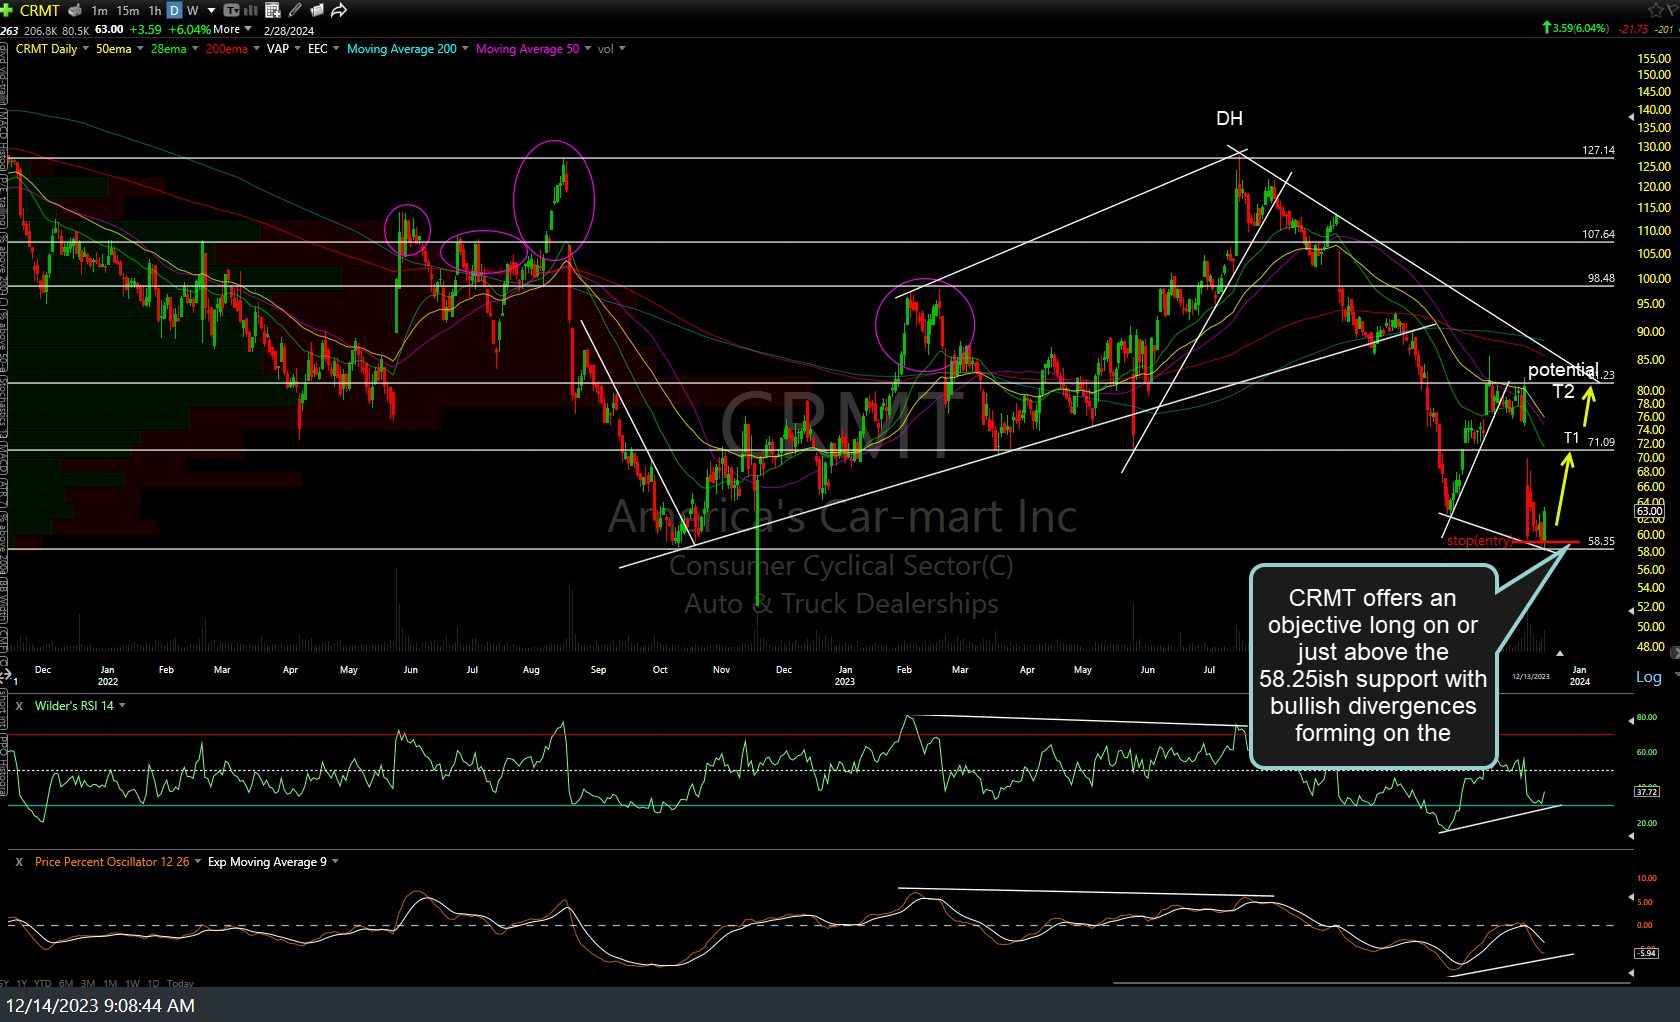
I haven’t been highlighting or even trading many individual stocks lately due to a lack of bullish setups that stand out but I did take CRMT (America’s Car-mart) off support yesterday as both a pure-play long based on the bullish technicals (oversold, at support, with positive divergences) as well as an indirect hedge to my QQQ/NQ short. CRMT offers an objective long on or just above the 58.25ish support with bullish divergences forming on the indicators. My preference is a stop slightly above yesterday’s lows with price targets around 71 (T1) and the intersecting downtrend line & 81ish price resistance as a potential 2nd target (potential meaning IF the stock market continues higher & I can’t make a decent case for a pullback if/when T1 is hit).


