
Now that the final targets on both the 60-minute & daily charts of TLT (20-30 yr Treasury bond ETF) have been hit, this is an objective time to reverse the trade by booking profits on the long & reversing to short for a pullback. Initial (trade setups) and updated 60-minute & daily charts below (I followed up with a daily chart listing only two price targets for less-active swing traders on Oct 26th, shortly after first posting the setup on the 60-minute chart of TLT on Oct 19th).

TLT 60m Oct 19th
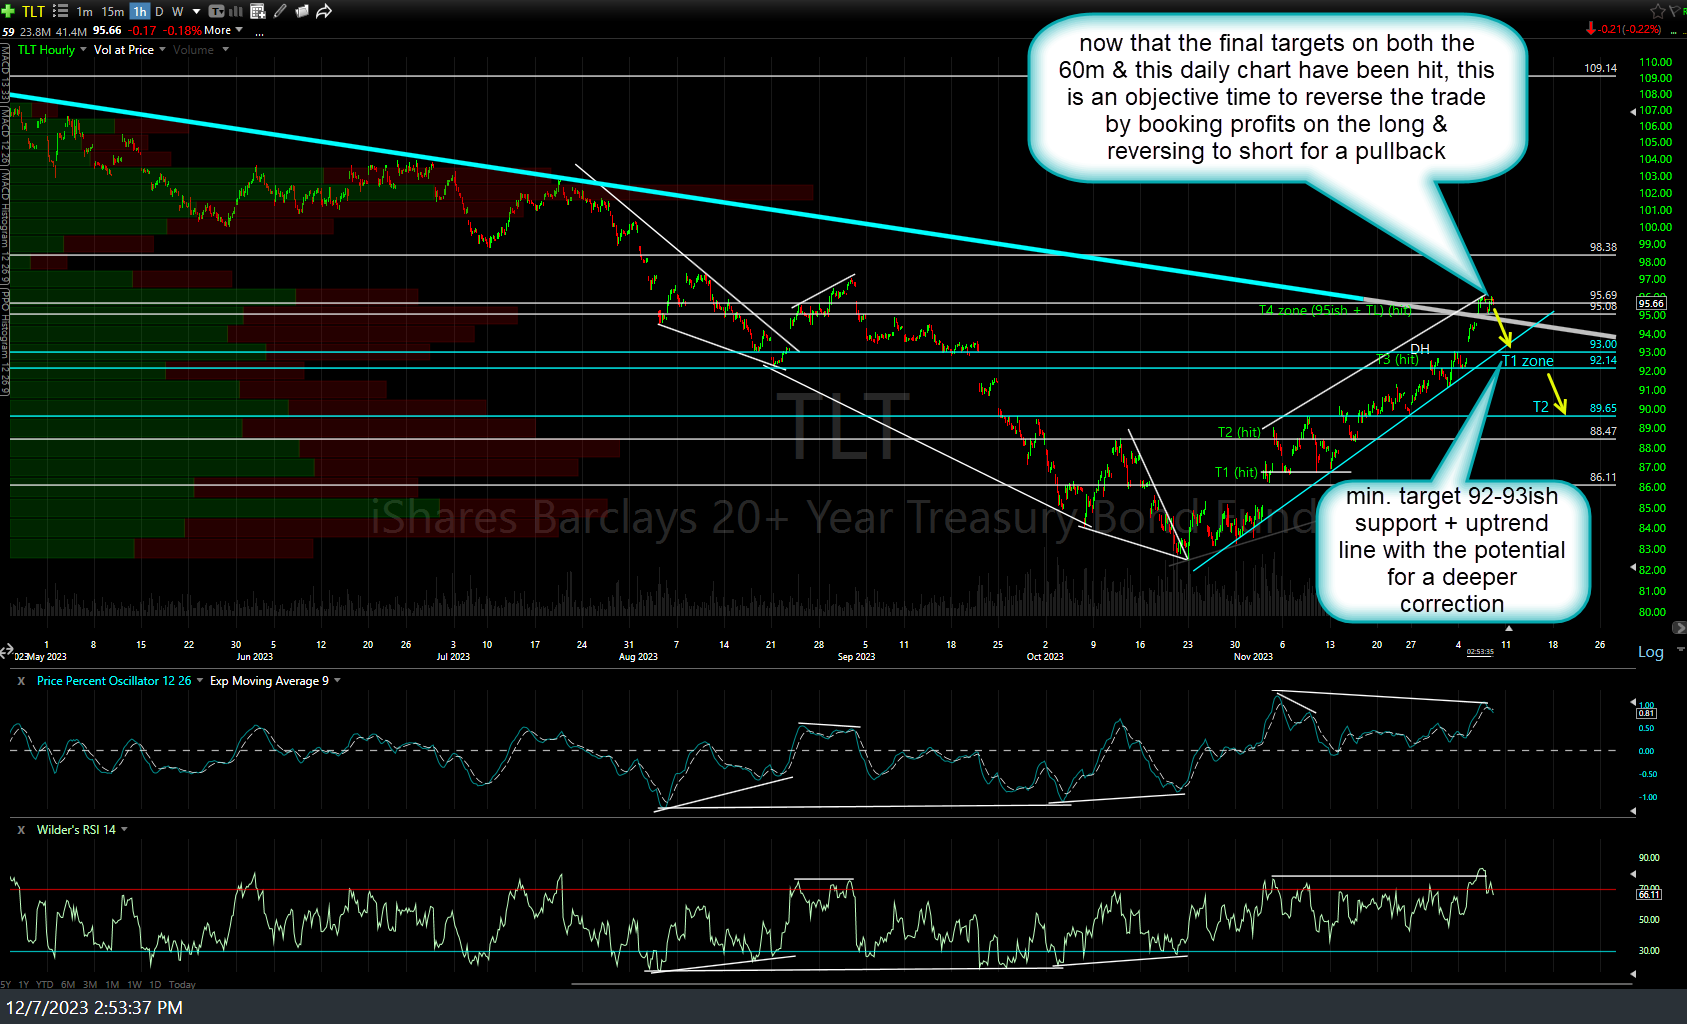
TLT 60m Dec 7th
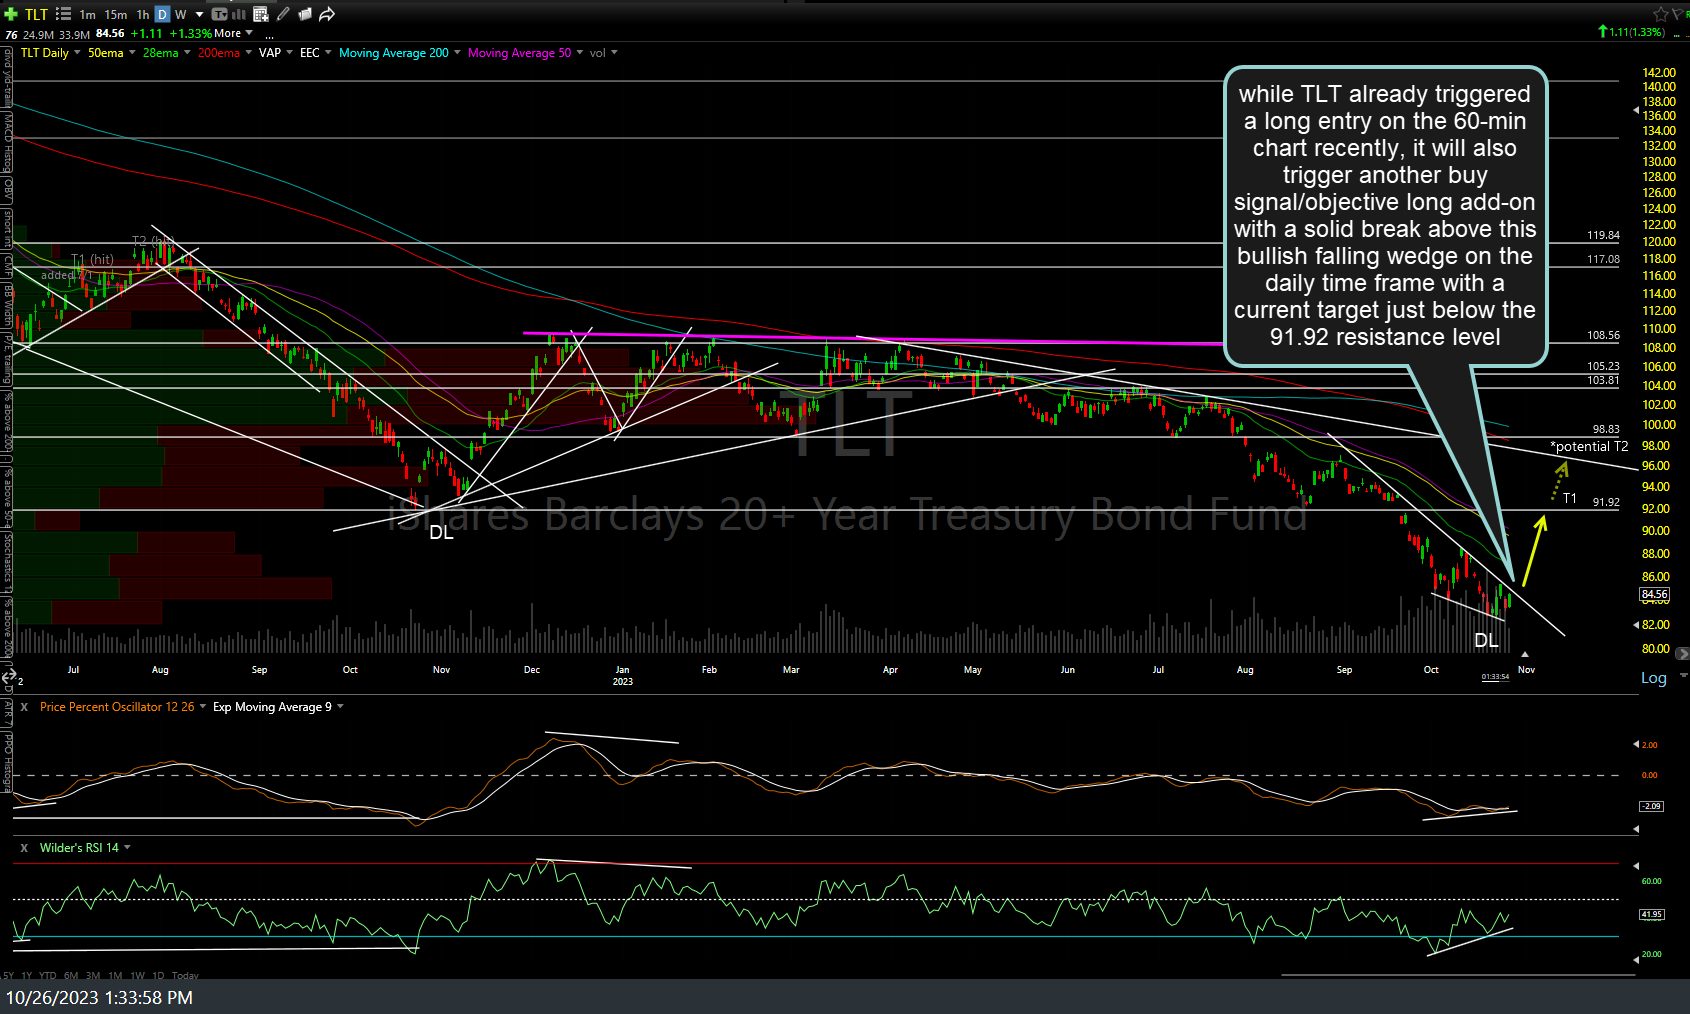
TLT daily Oct 26th
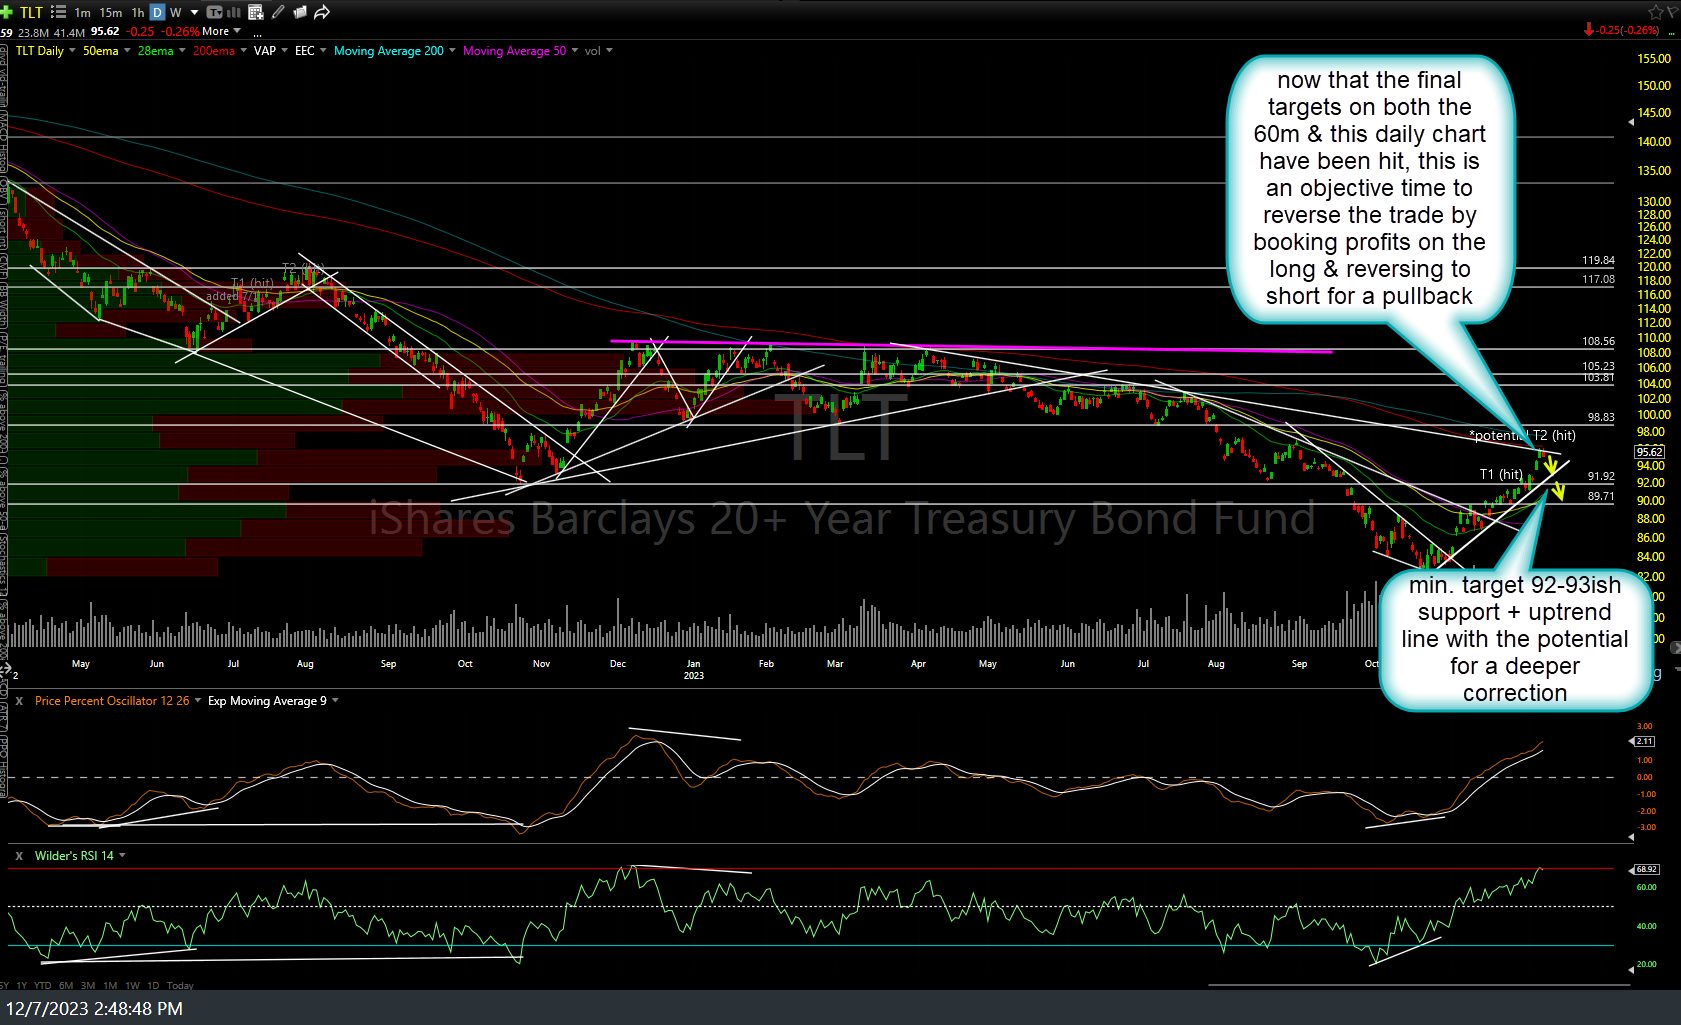
TLT daily Dec 7th
For those that prefer using inverse ETFs, TTT is the -2x (200% short) inverse 20-30 Yr Treasury bond ETF, which you can clearly see has fallen to dual support levels (uptrend line & 75.40ish price support).

TTT daily Dec 7th
SJB (-1x short high-yield bond ETF) also offers an objective long entry (to go short junk bonds) here with both JNK & HYG at resistance on the daily time frames and/or on a breakout above this 60-minute falling wedge pattern.
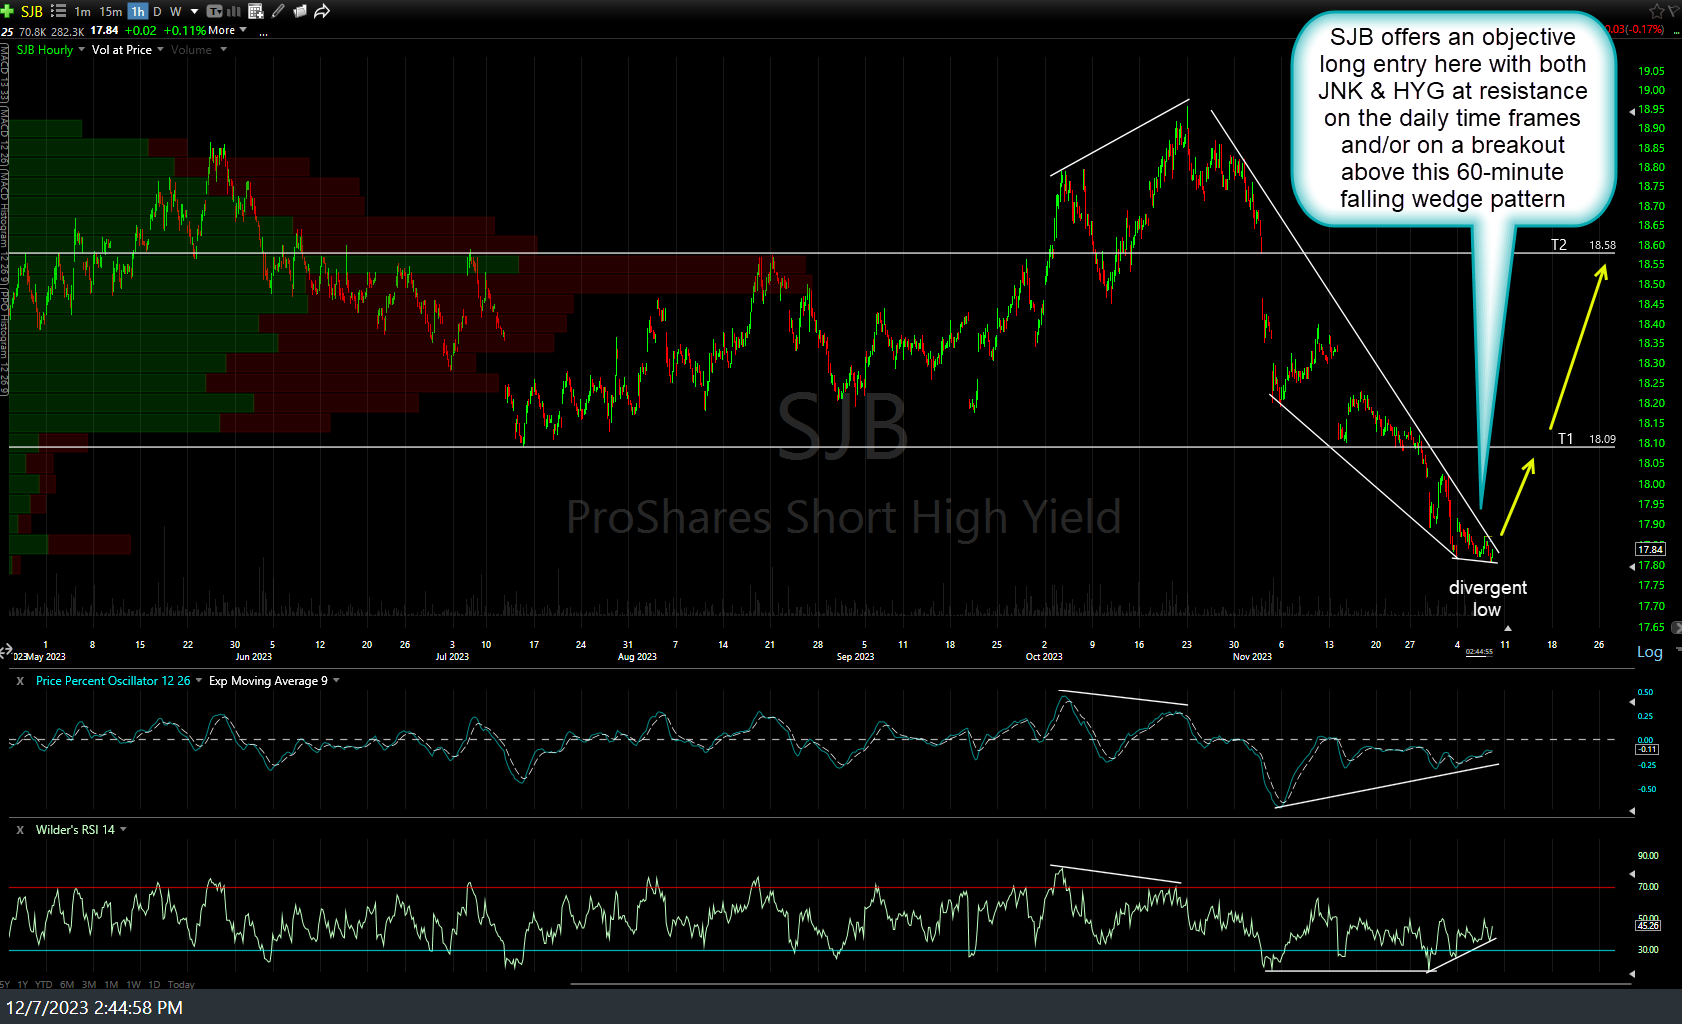
SJB 60m Dec 7th
HYG (high-yield aka junk bond ETF.. basically identical to JNK but from another ETF issuer) offers an objective short entry here at resistance and/or on a solid break below the uptrend line/75 level. Daily chart below.
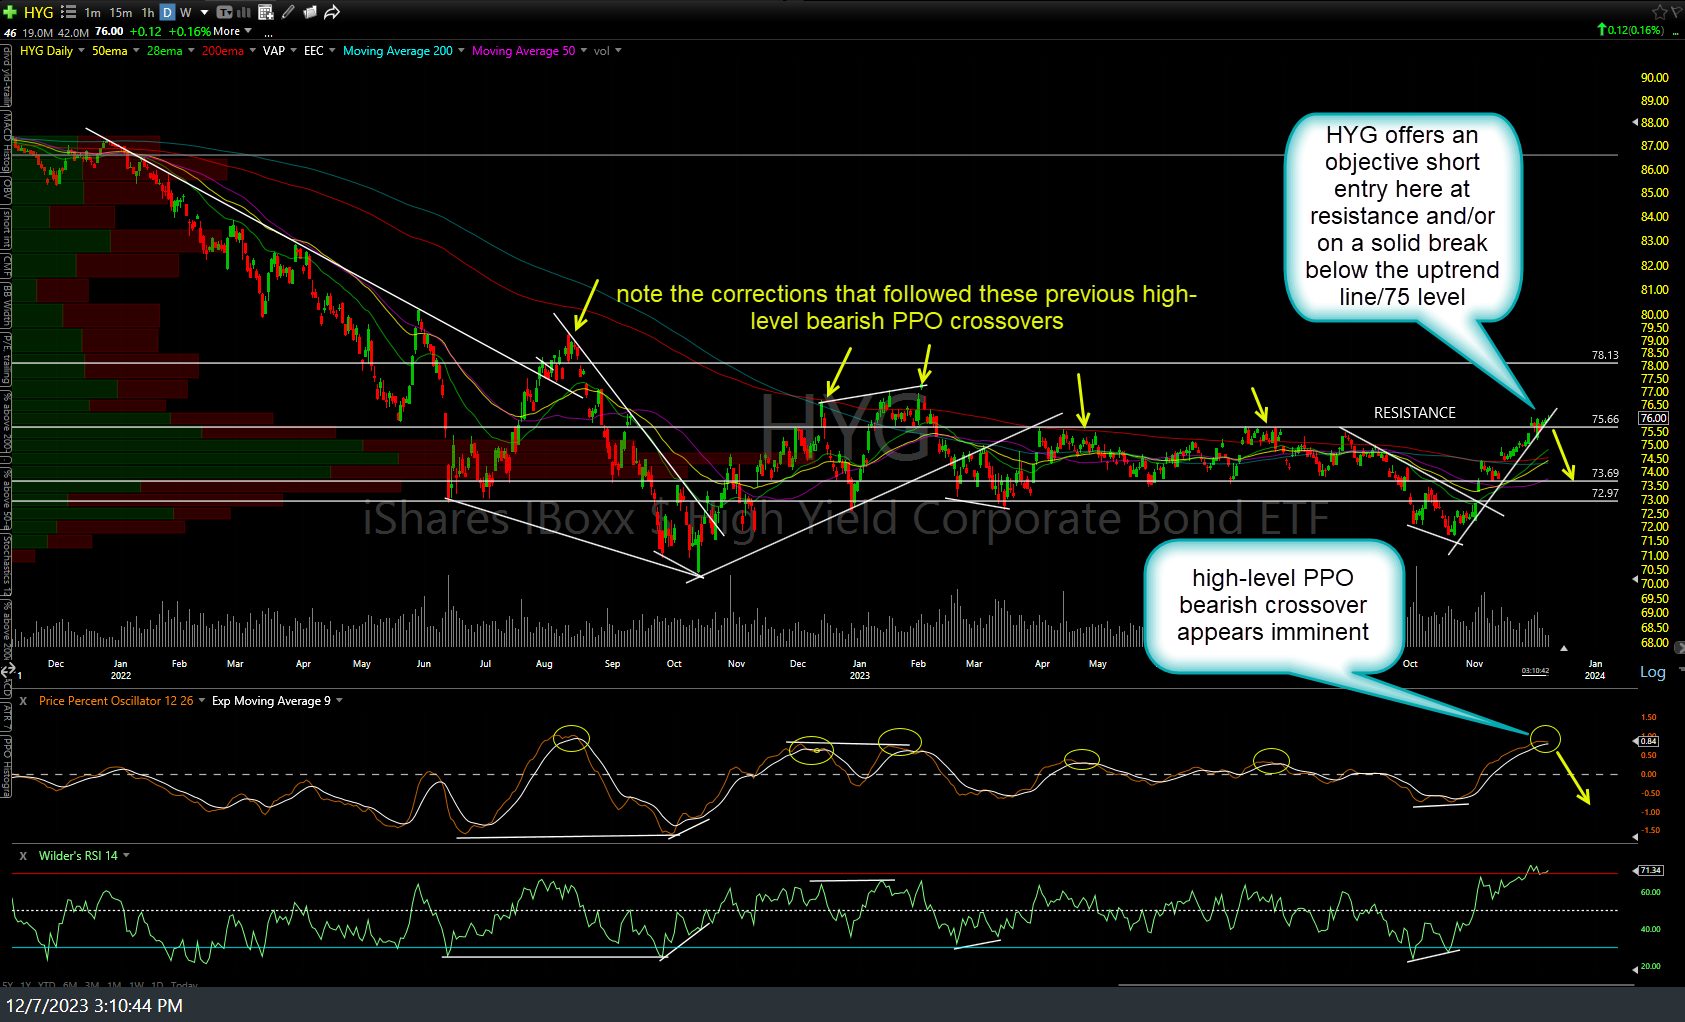
HYG daily Dec 7th