Most traders & investors are aware that the technology sector has by far & wide led the US stock market to the recent highs and that within the tech sector, the semiconductors have lead the way. The semiconductor sector also tends to act as the canary in the coal mine for the health of the tech sector for obvious reasons. For example, the semiconductor sector topped back on June 1, 2015 with both the technology sector (XLK) and the Nasdaq Composite continuing to rally for another 1.6 months until peaking in mid-July. That top was followed by the most largest drop in the stock market since the final stage of the 2007-2009 bear market with the Nasdaq Composite ($COMPQ) falling over 19% over the next 7 months, including a near vertical plunge of 18% in the first 5½ weeks that followed that mid-July top.
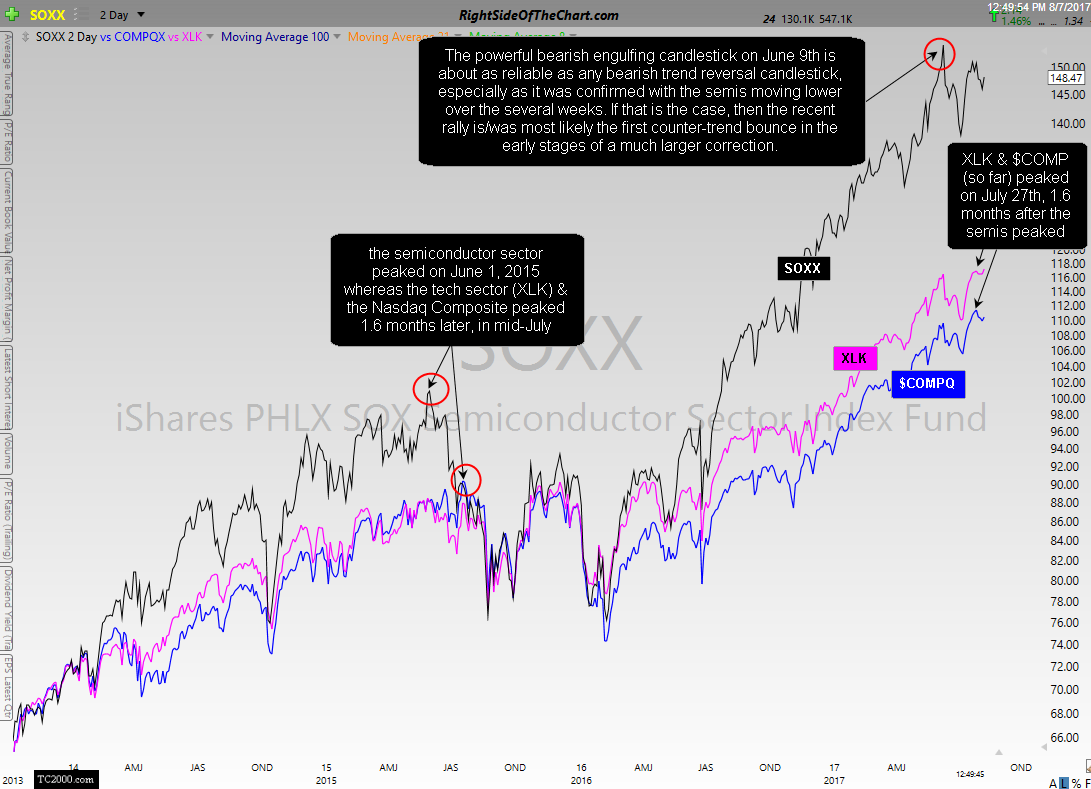
SOXX XLK $COMPQ comparison Aug 7th
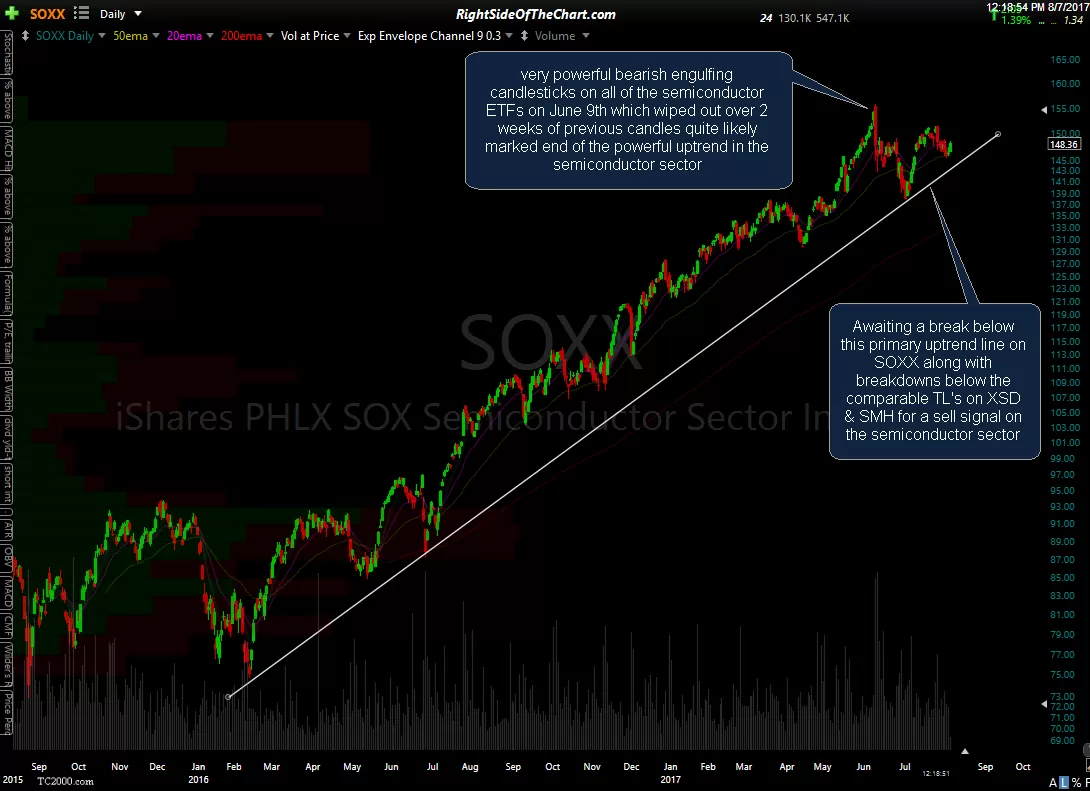
As of today, the semiconductor sector peaked back on June 9th with a very high-probability sell signal, one of the largest bearish engulfing candlesticks that I’ve seen on any sector in quite some time. That bearish engulfing candle, which wiped out over 2 weeks of the previous gains in a single day, was confirmed (validated as a likely major top) with the semis moving lower over the next month or so. Bearish engulfing candles, although not very common during an uptrend, do occur occasionally. However, confirmation of a likely top only comes if prices continue to move lower as a quick glance of the chart of SOXX will show several bearish engulfing candles in recent years that proved to be one-off events, followed by a resumption of the uptrend shortly afterwards.
While both the Nasdaq Comp & the tech sector (XLK) are only trading just off their all-time highs, as of now both peaked back on July 27th, 1.6 months after the semis peaked, just as was the case back in 2015. History, especially in the financial markets, rarely plays out exactly the same so maybe the tech stocks punch through those recent highs soon, maybe not. However, the charts continue to indicate that at least a decent pullback is coming soon.
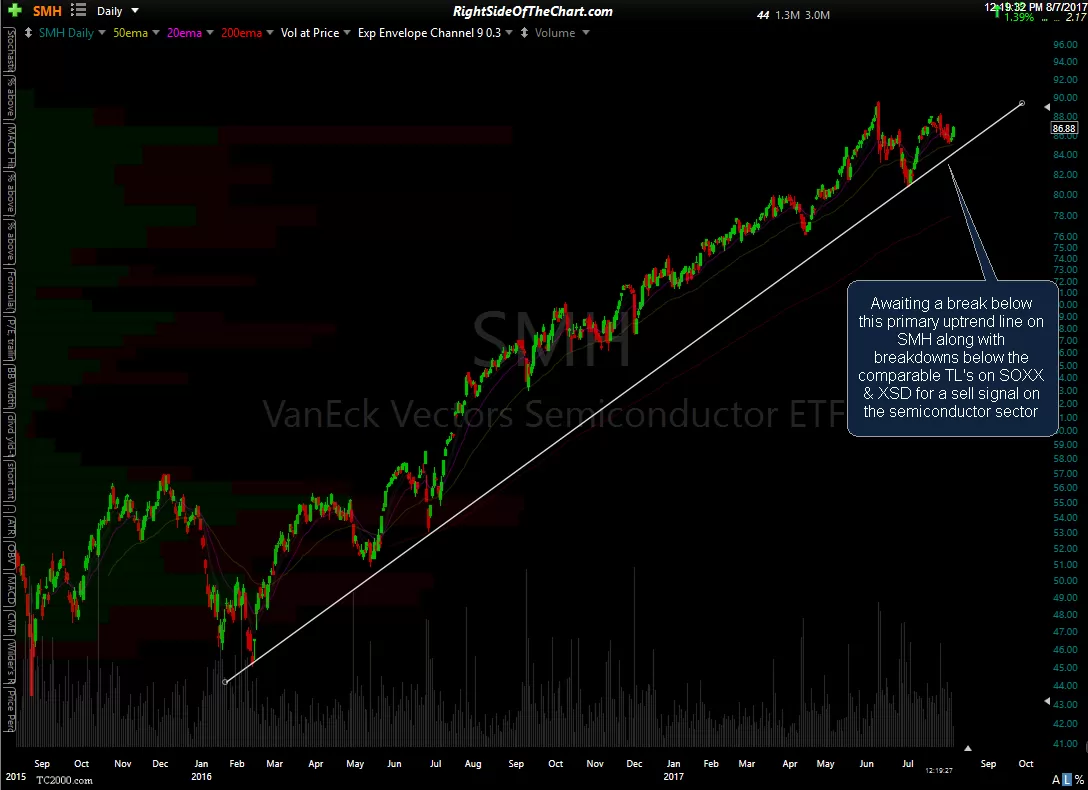
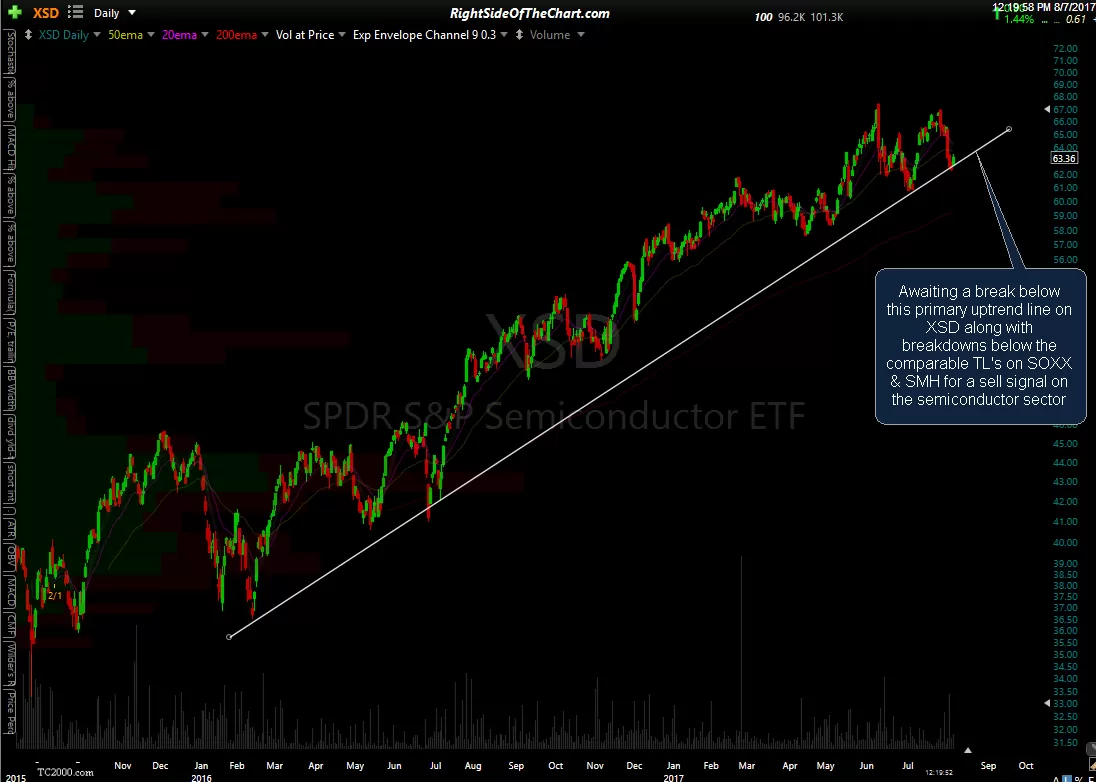
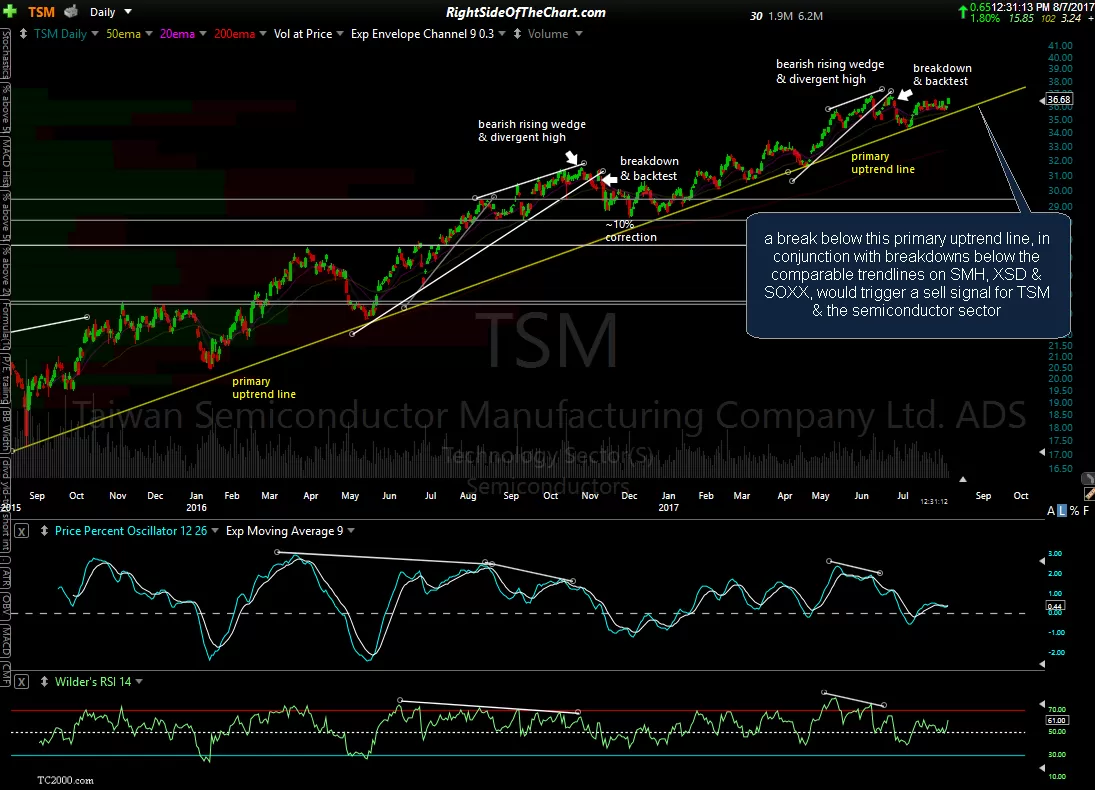
Now for the “simple” part. The first 3 charts below are as stripped down as it comes. No trend or price indicators & oscillators, just one simple uptrend line on each of the 3 big semiconductor sector ETFs; SOXX, SMH & XSD. It appears that the next objective & high-probability sell signal on the semiconductor stocks will come on an impulsive breakdown & daily close below the trendlines on all three of these charts. Additional confirmation would come on a break below the comparable uptrend line on TSM (Taiwan Semiconductor), which is the largest semiconductor company (by market cap), even larger than Intel (INTC).
-

- SOXX daily August 7th
-

- SMH daily August 7th
-

- XSD daily August 7th
-

- TSM daily August 7th
-

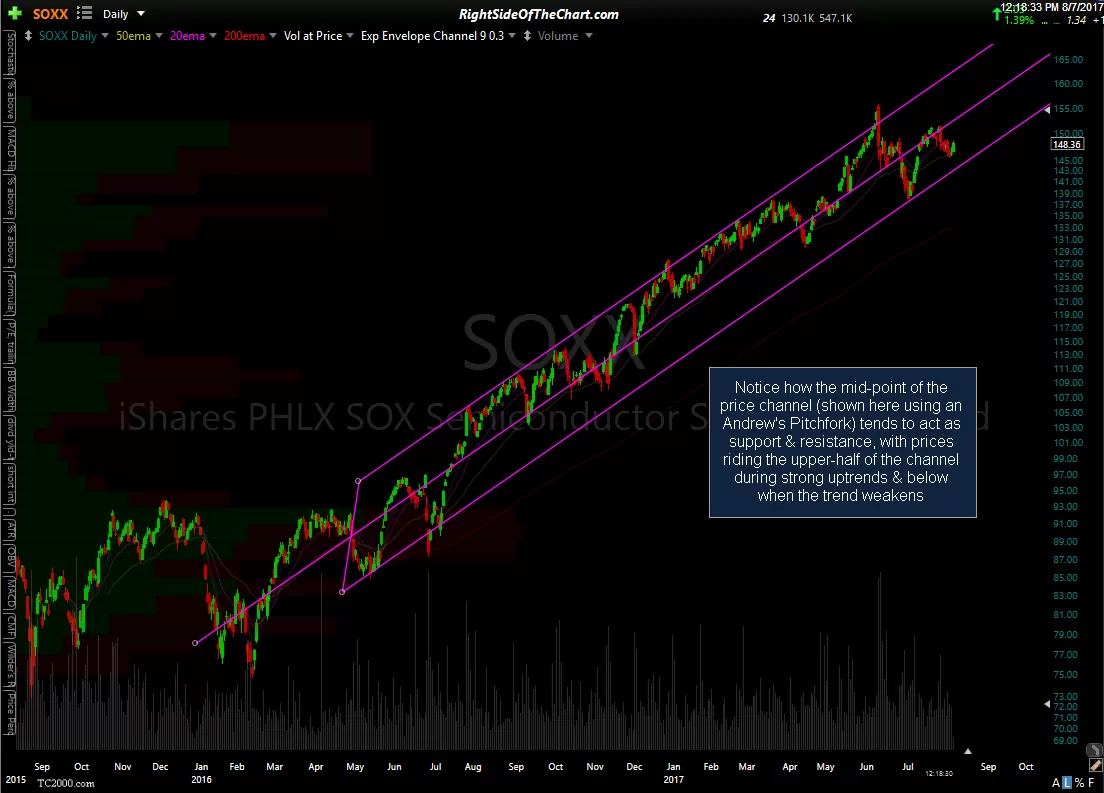
- SOXX daily price channel Aug 7th