
This week will, by far, be the most important week of this earnings season with a total of 119 companies in the S&P 500 index reporting. This week will also see all five of the market leading FAAMG stocks (FB, AAPL, AMZN, MSFT & GOOGL) reporting along with a slew of other market leading stocks. As such, one should expect an increase in volatility & opening gaps. There is a link for an earnings calendar located on the home page sidebar under ‘Tools of the Trade” along with an economic calendar with the potential market moving reports denoted with a red dot.
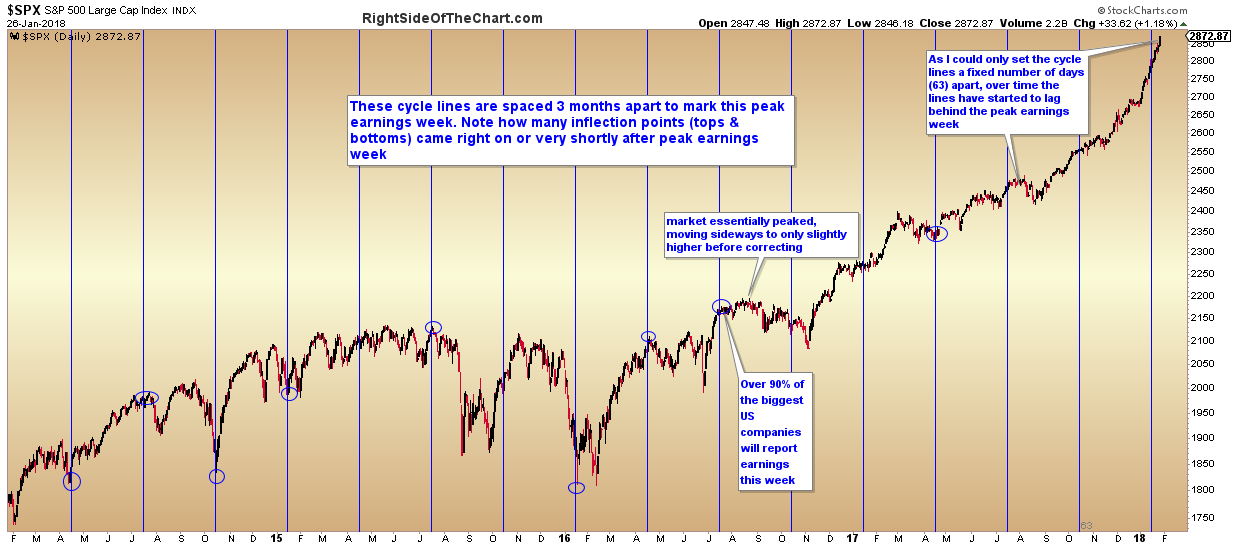
SPX daily peak earnings week Jan 29th
The chart above shows cycle lines overlaid with the peak week of each earnings season. Note how many inflection points in the market and/or sharp rallies/corrections followed either immediately or very shortly afterwards. I’ve shared this chart in the past & as I can only set the cycle lines a certain number of days apart (63 days), in recent quarter the lines are starting to fall just shy of peak earnings week so you just need to mentally shift the most recent lines slightly forward. By doing so, you can see that the trend has continued with the market correcting shortly after the line in July and with the October peak earnings week leading to a continuation of the previous rally which has continued since.
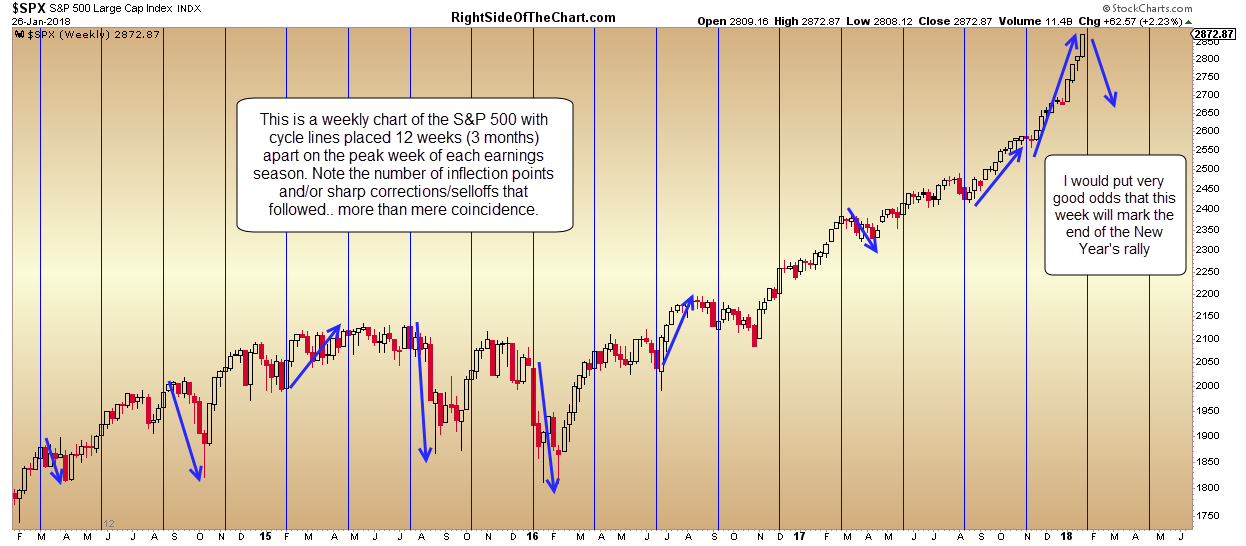
SPX weekly peak earnings week Jan 29th
The chart above is a weekly chart (weekly candlesticks) with the peak earning week cycle lines set 12 weeks (3 months) apart, showing a clear trend of mostly inflection points along with a couple of continuations of the previous trend. Based on numerous factors, such as the extreme overbought conditions in the broad market, extreme sentiment, negative divergences, the proximity of the major indexes to their uptrend lines, etc…, I would put very good odds that that week (or next) will mark the end of the current uptrend. Please note, that is not a call for the end of the primary uptrend (i.e.- bull market), simply the end of the current uptrend before a meaningful pullback of 5% or more.
Swing traders should be aware of the time & date that any of their current potential positions (trade setups) are scheduled to report & decide whether or not to hold or close those positions as the risk of an earnings-induced gap for or against any position is always a possibility. Another factor to consider is that with increased market volatility comes an increased risk of having any tightly placed stops clipped, only to see your position go on to hit your price target. Trend traders & investors shouldn’t be overly concerned with earnings other than positions that are very close to a profit target or stop, as they might opt to close the position before earnings as to not risk a large giveback of profits or a loss that exceeds your stop allowance from an opening gap that bypasses your stop.
As a quick recap to the sectors that I’ve been covering in recent weeks, here is my near-term outlook for each:
Cannabis Stocks
BEARISH. After an very strong rally which has carried the majority of pot stocks to extreme valuation levels, it appears that the momentum is slowing & the odds for a substantial correction are rapidly building at this time.
Agricultural Commodities
BULLISH. The technicals on the ag commodities continue to firm up with the near-term, intermediate-term & quite possible the long-term outlook bullish. NIB, WEAT, CORN, SSG, DBA & JJG are some of my favorites (note: I’m neutral to bearish on cattle- COW ).
Crude Oil
BEARISH. Extensive coverage posted recently.
Natural Gas
Near-term neutral to bearish. Additional updates to follow soon.
US Equities
Bearish. Extensive coverage posted recently & above.
Gold, Silver, Platinum & GDX
Near-term bearish, Longer-term bullish.
Utilities (XLU)
Near-term bullish.