As a follow-up to last Thursday’s post titled Index & Sector Key Support Levels To Watch, I wanted to post a follow up to provide a quick overview of the stock market & leading sectors at a quick glance. The first chart of each index or sector ETF below is from last week’s post followed by the updated 60-minute chart. Essentially, we’ve had several of those key support levels (magenta/purple lines) taken out since then with most indexes and key sectors currently trading on or just above one or more of the additional support levels on those charts with the next sell signals to come on solid breakdowns below those levels (today’s and/or Friday’s lows, for most).
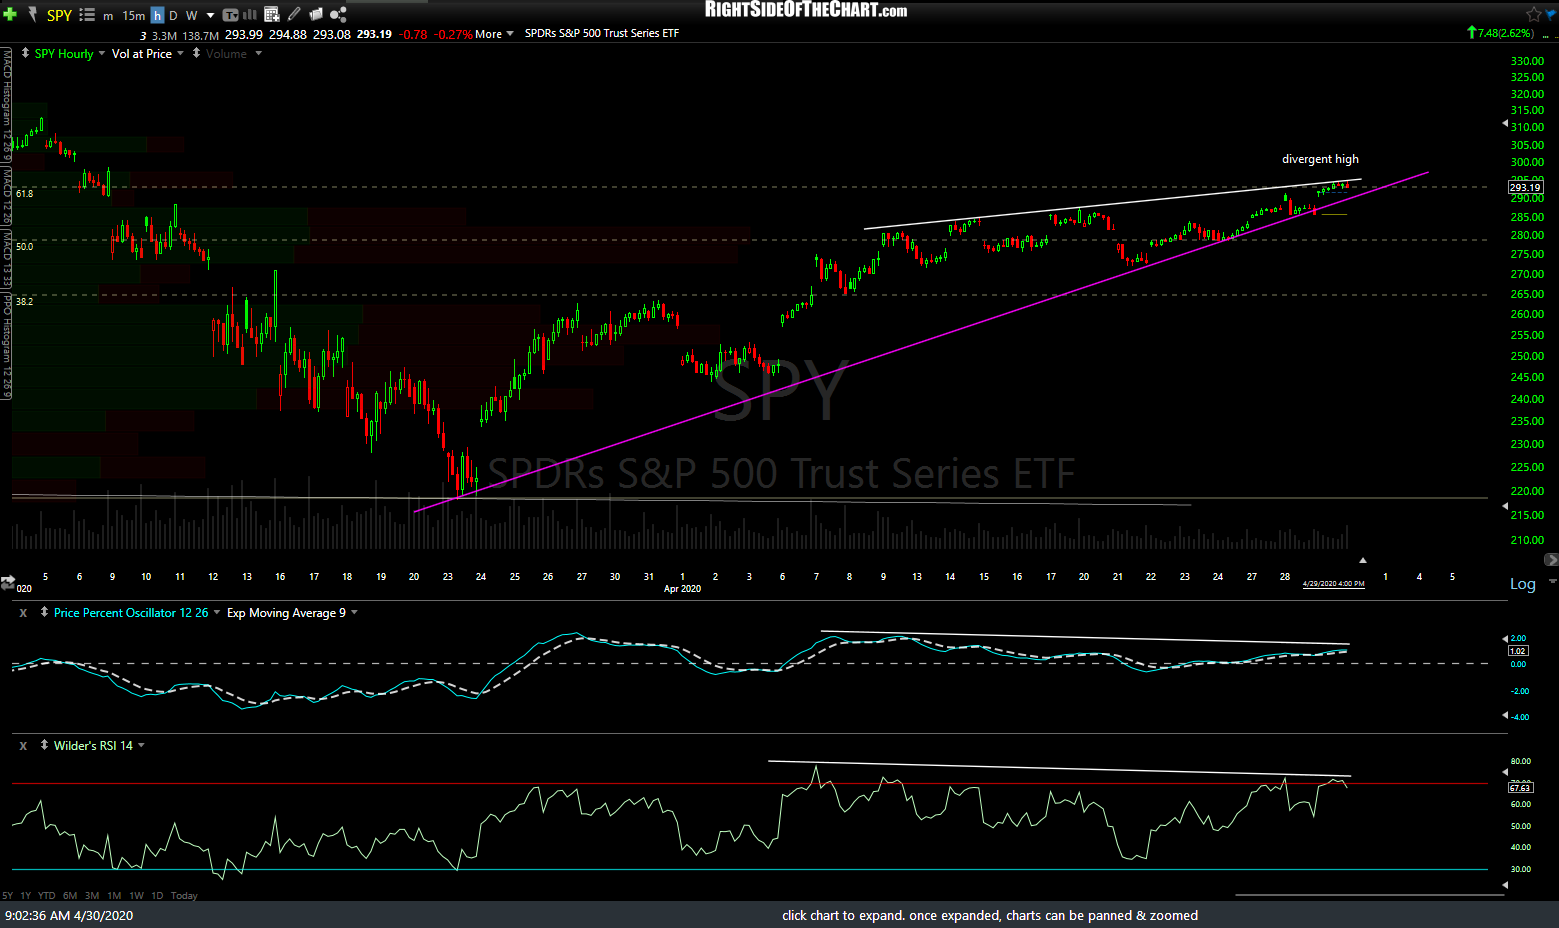
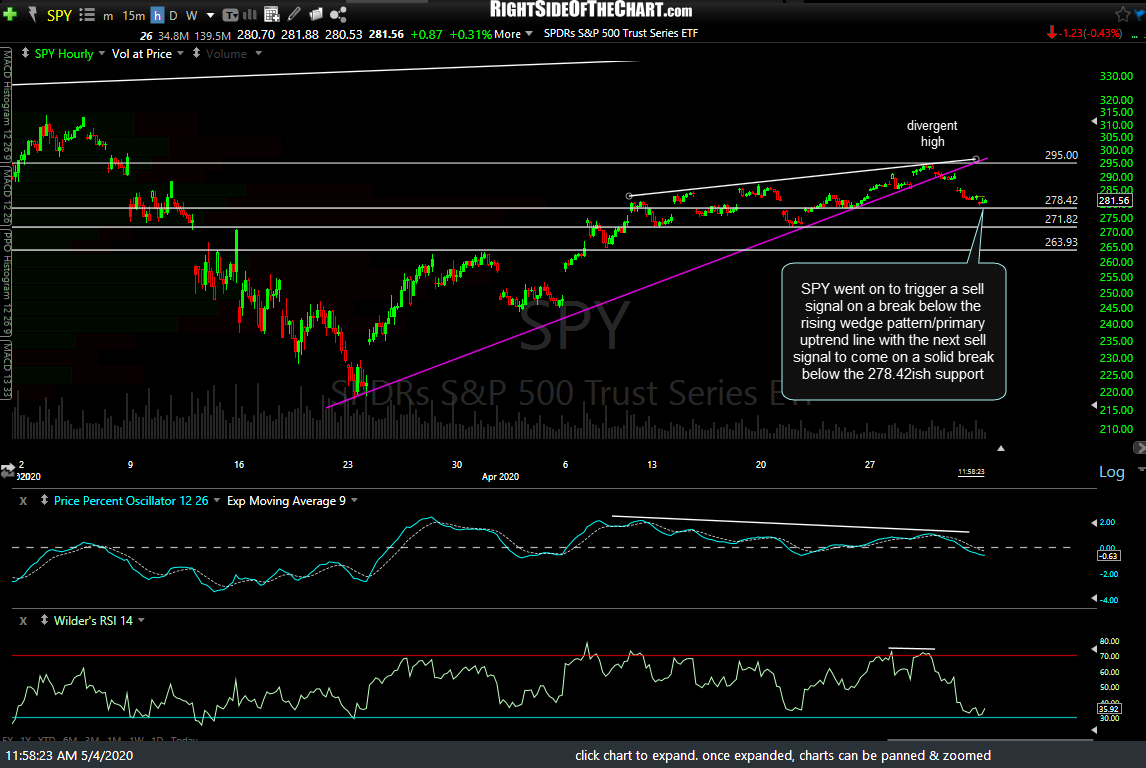
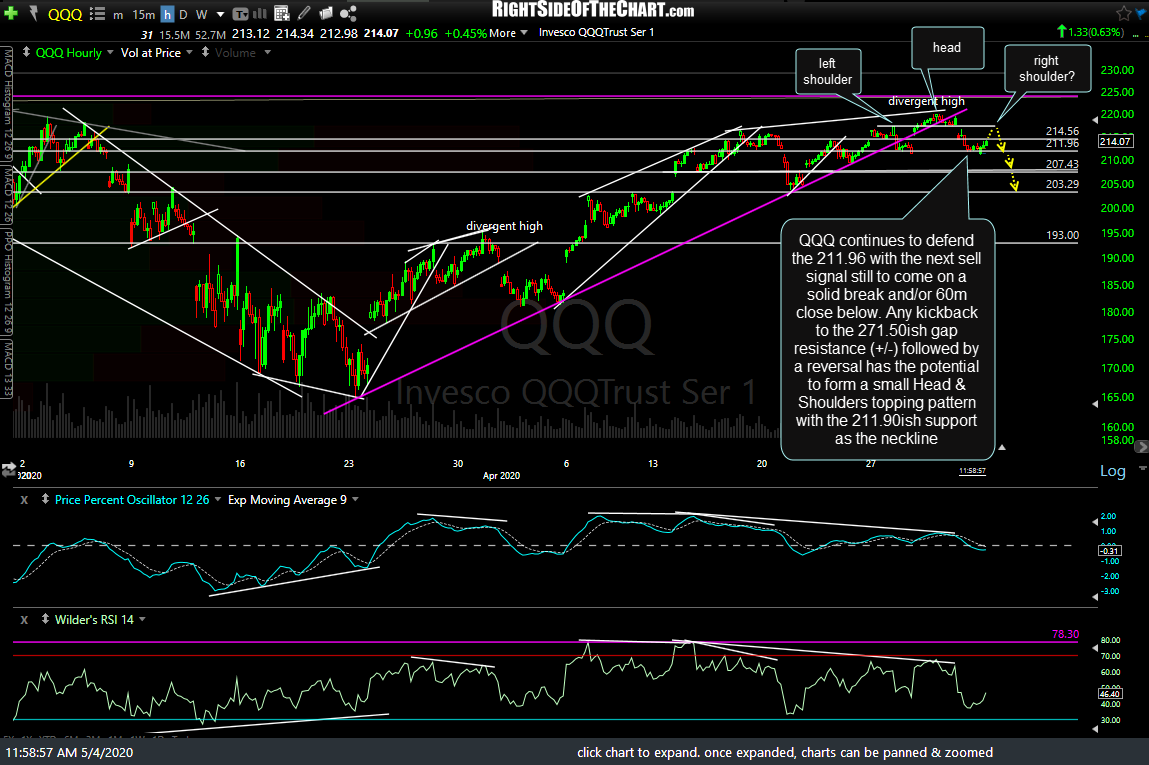
Starting out with the index ETFs, SPY went on to trigger a sell signal on a break below the rising wedge pattern/primary uptrend line with the next sell signal to come on a solid break below the 278.42ish support. The tech-heavy QQQ continues to defend the 211.96 with the next sell signal still to come on a solid break and/or 60-minute close below. Any kickback to the 271.50ish gap resistance (+/-) followed by a reversal has the potential to form a small Head & Shoulders topping pattern with the 211.90ish support as the neckline.
-click the first chart to expand, then click on the arrow to advance to the next expanded chart-
-

- SPY 60m April 30th
-

- SPY 60m 2 May 4th
-

- QQQ 60m April 30th

-

- QQQ 60m 2 May 4th
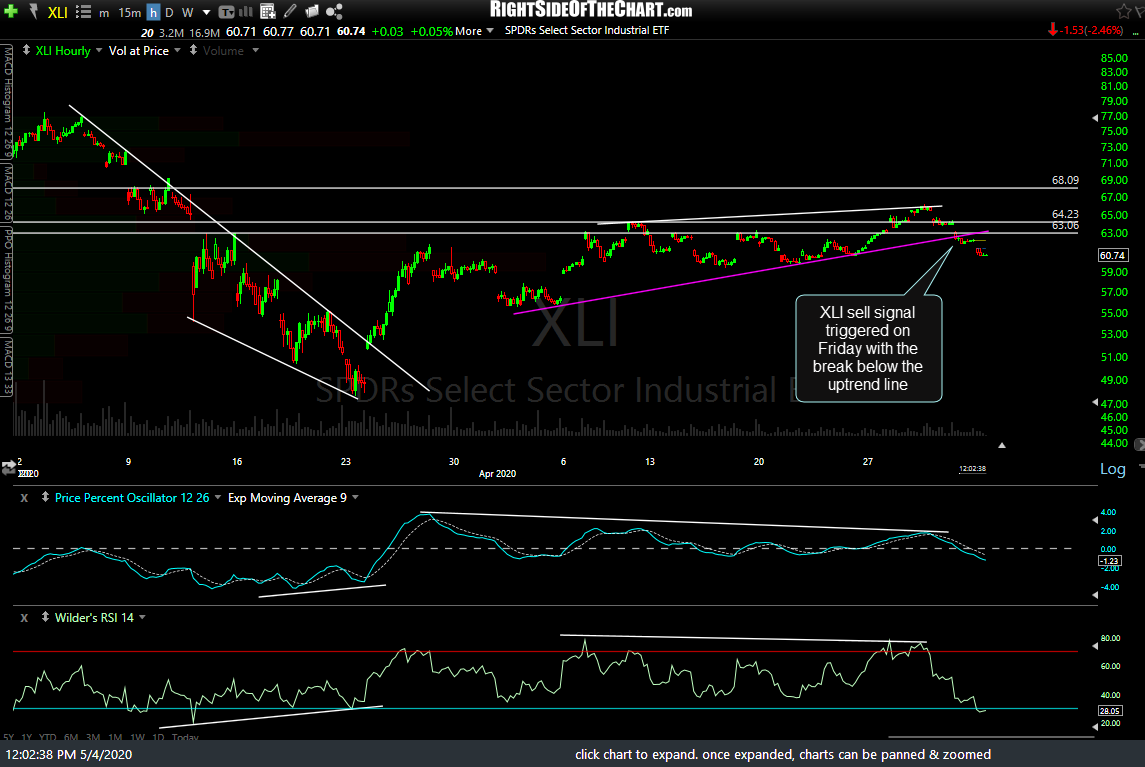
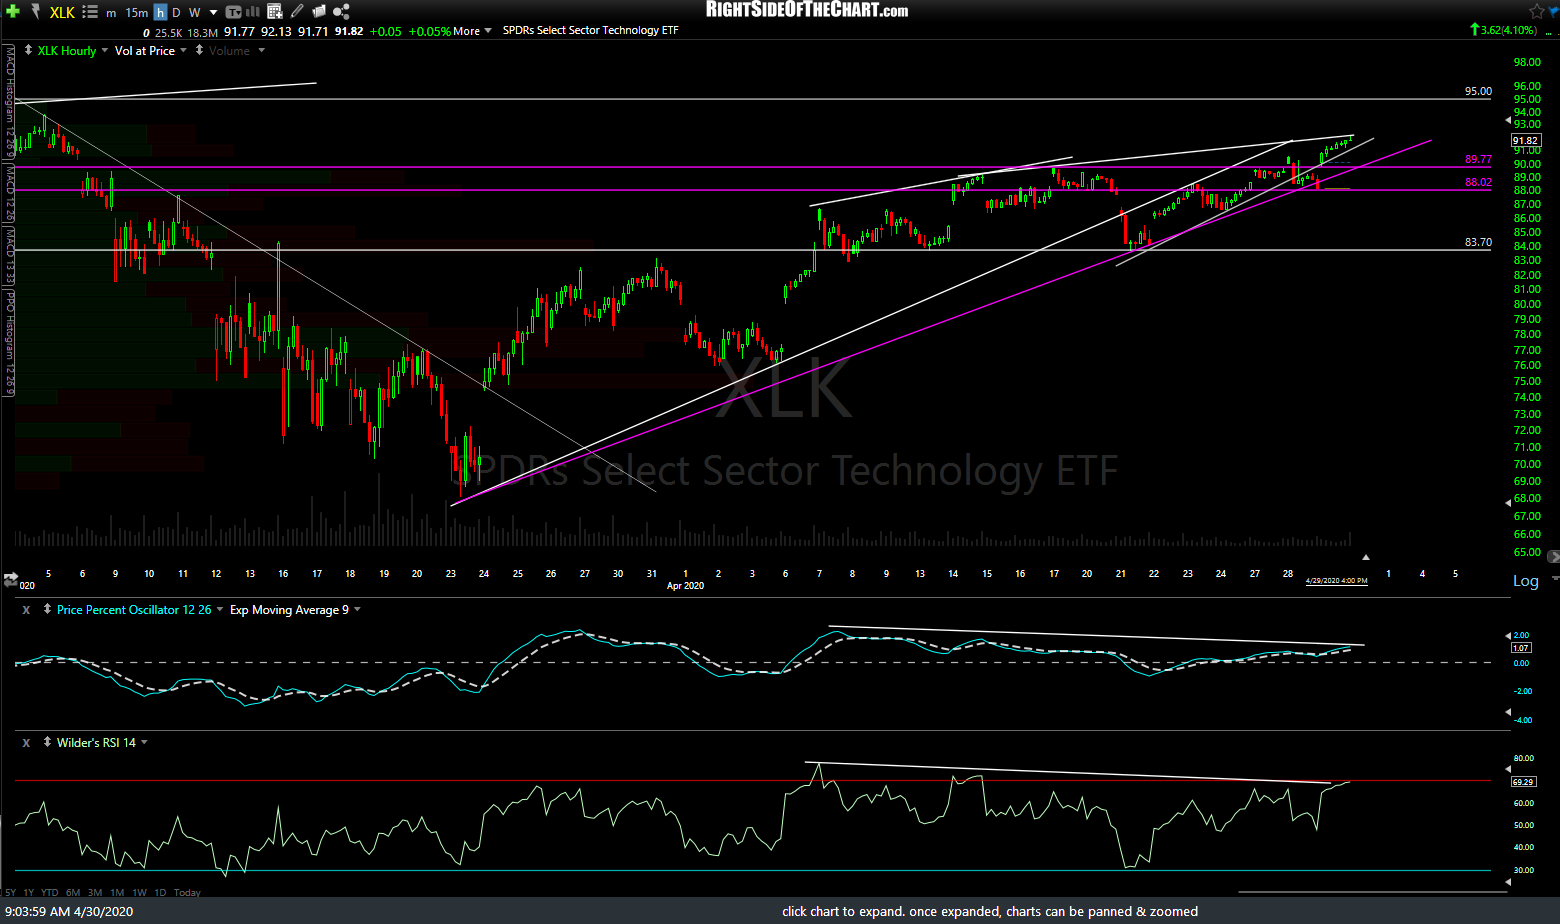
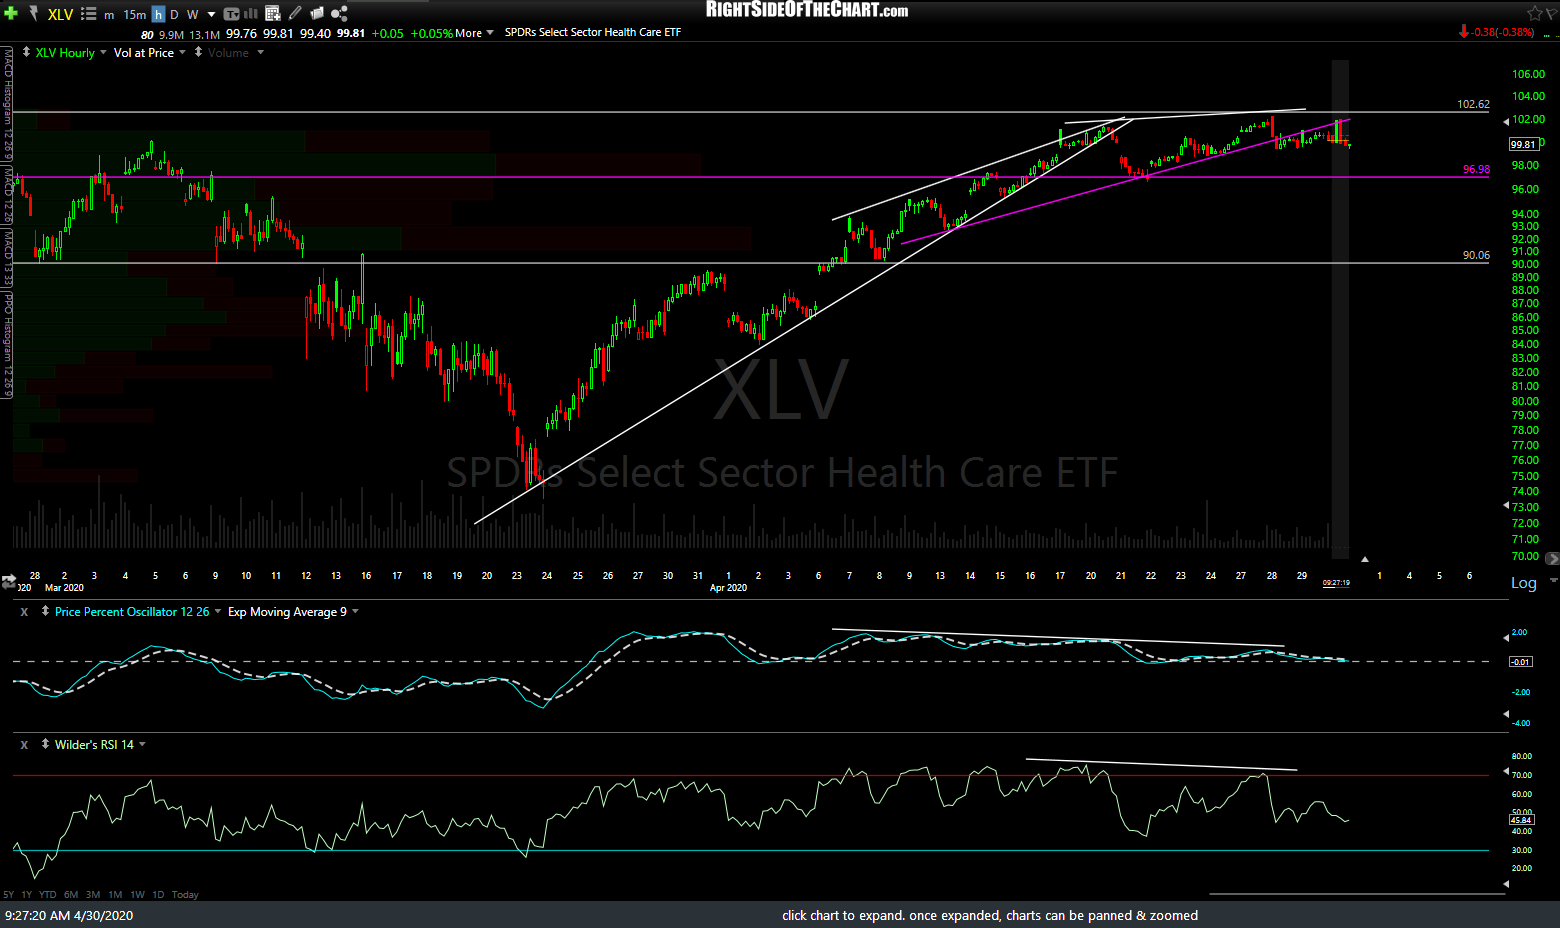
The remaining charts are the top-weighted indexes in the S&P 500. As any index is simply a sum of its parts, if the majority of these sectors break down, the higher the odds that the recent sell signals on the major indices will stick & play out for a correction and/or next major leg down. Previous & updated 60-minute charts below.
-

- XLK 60m April 30th
-

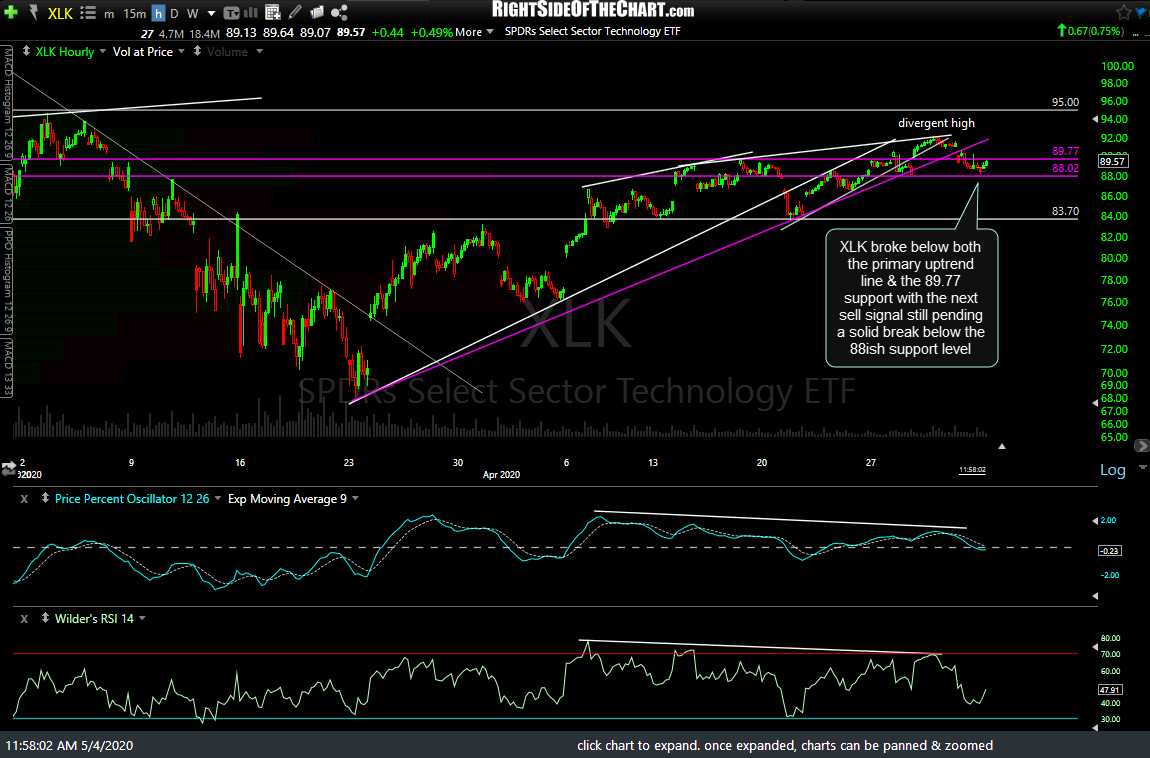
- XLK 60m May 4th
-
- XLV 60m April 30th
-

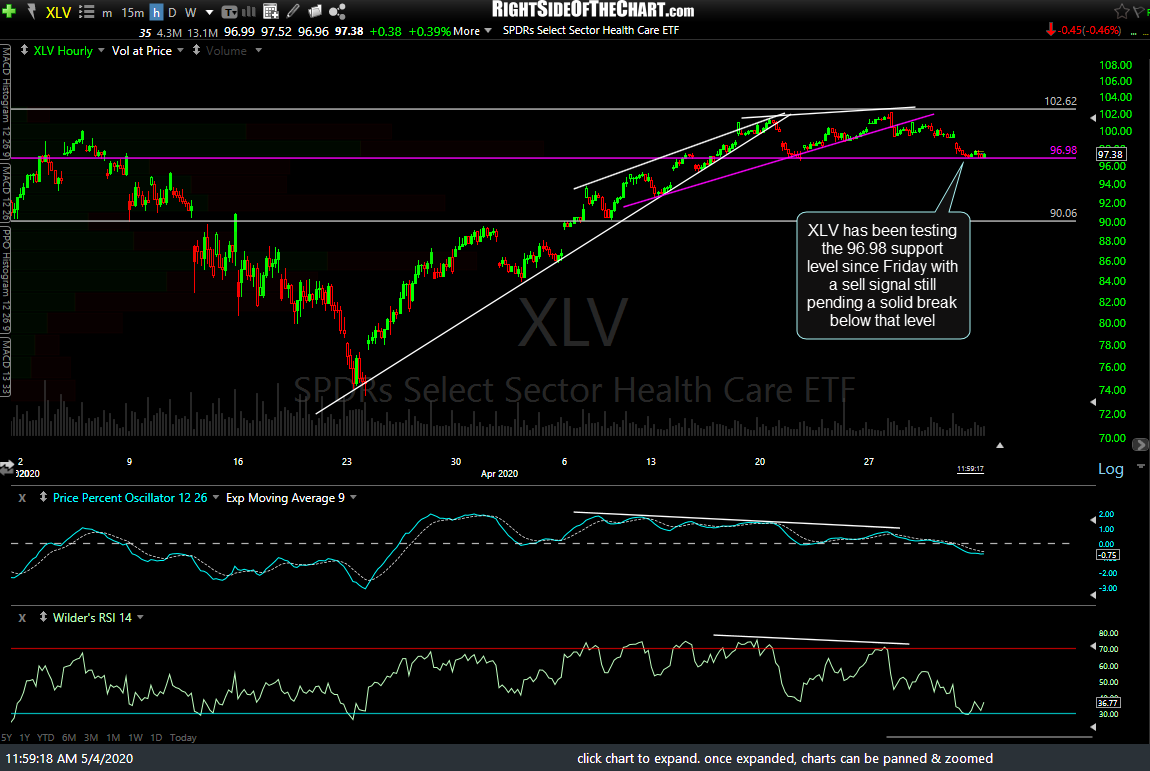
- XLV 60m May 4th
-

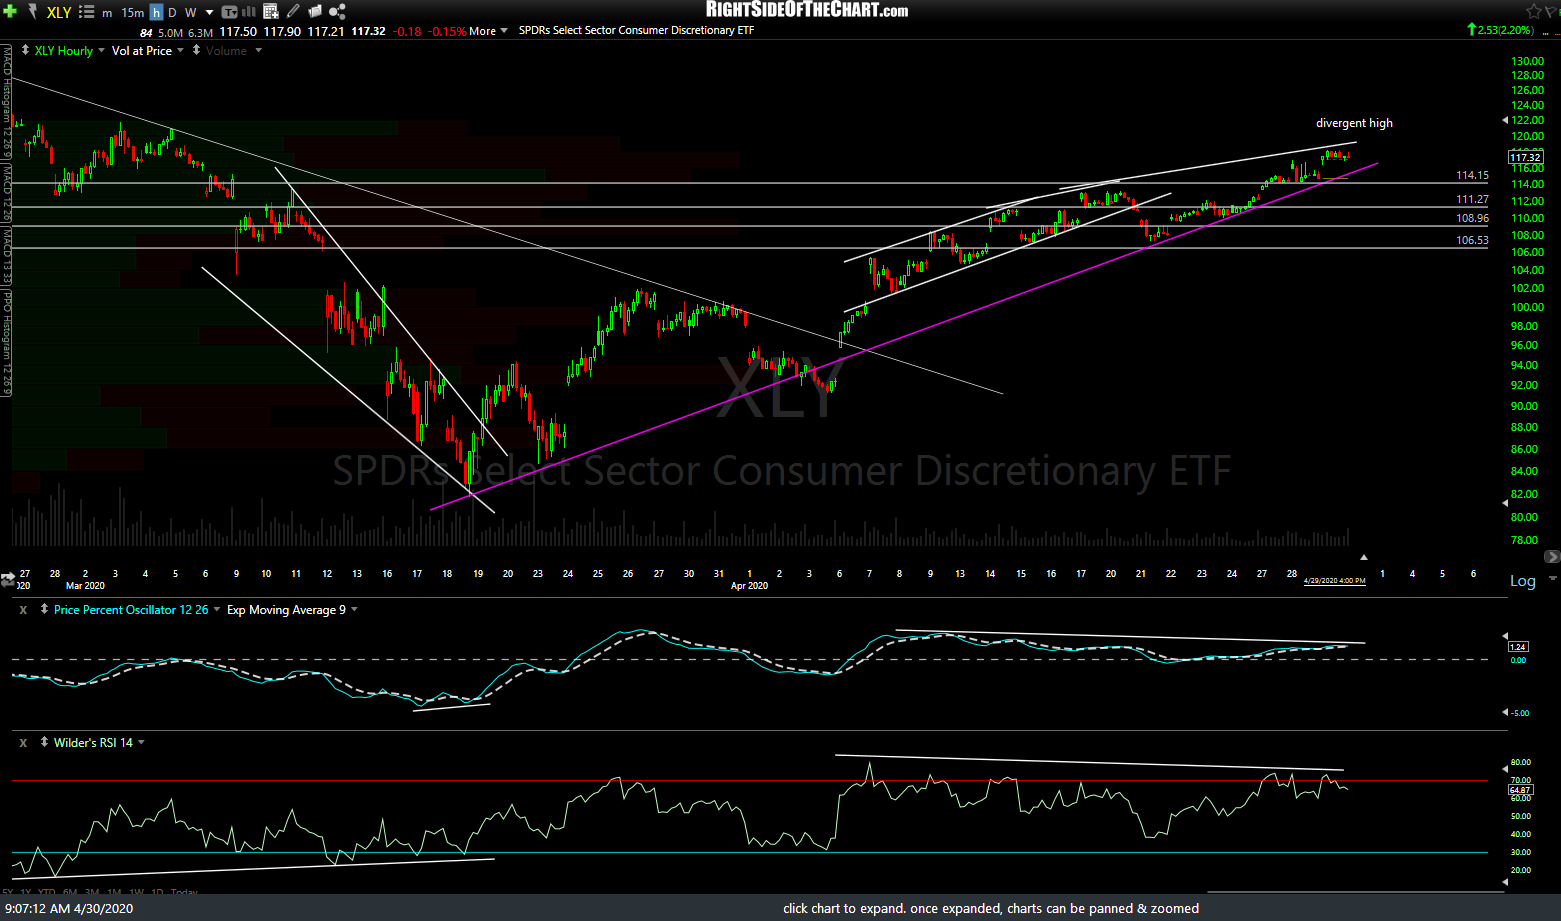
- XLY 60m April 30th
-

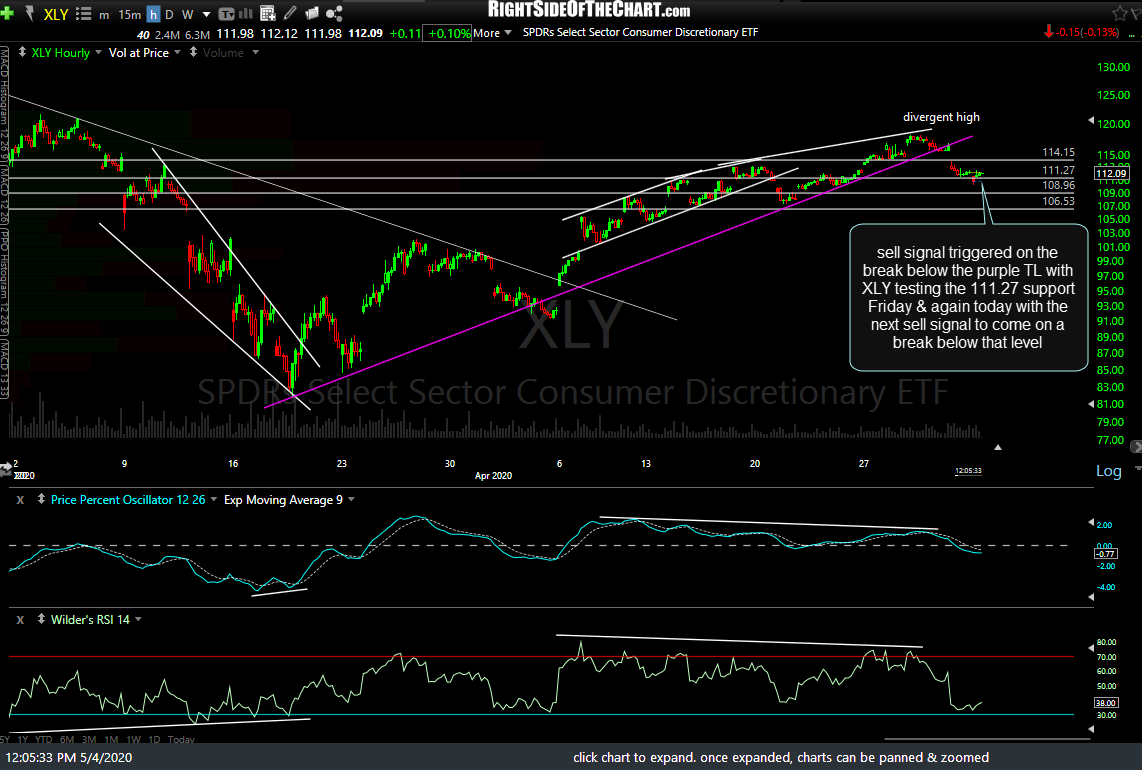
- XLY 60m May 4th
-
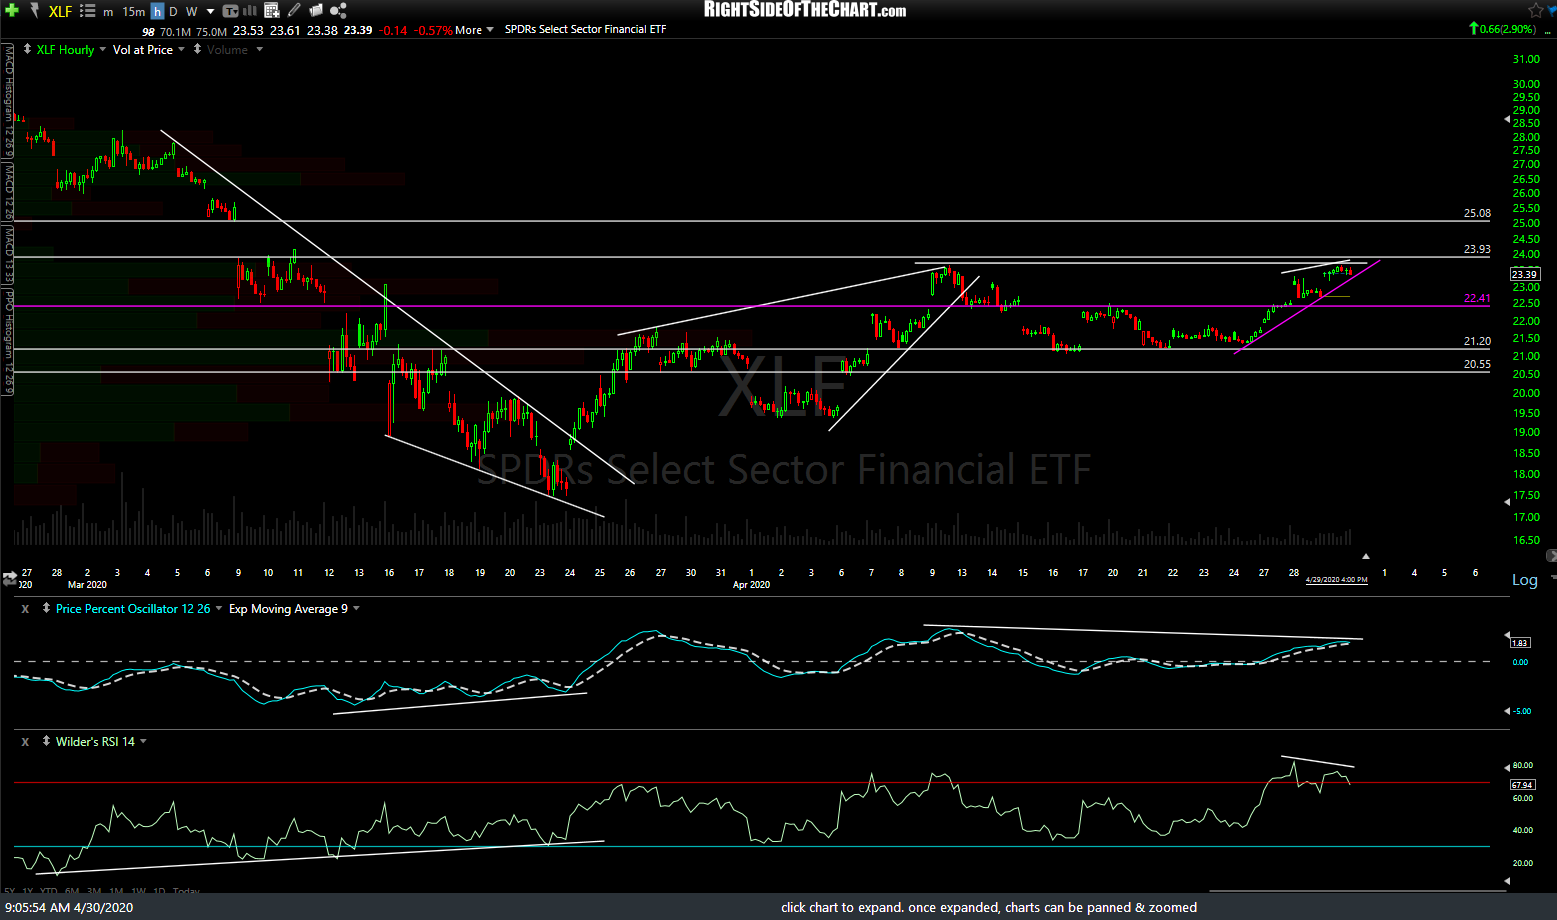
- XLF 60m April 30th
-
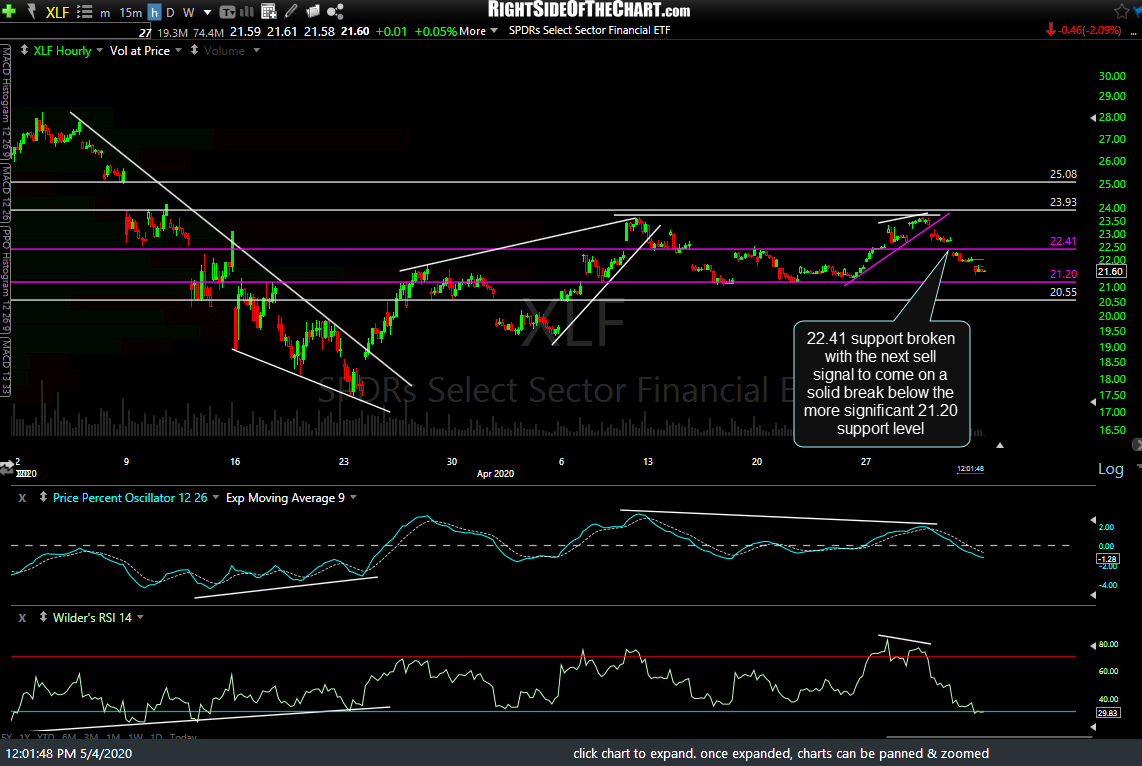
- XLF 60m March 4th
-
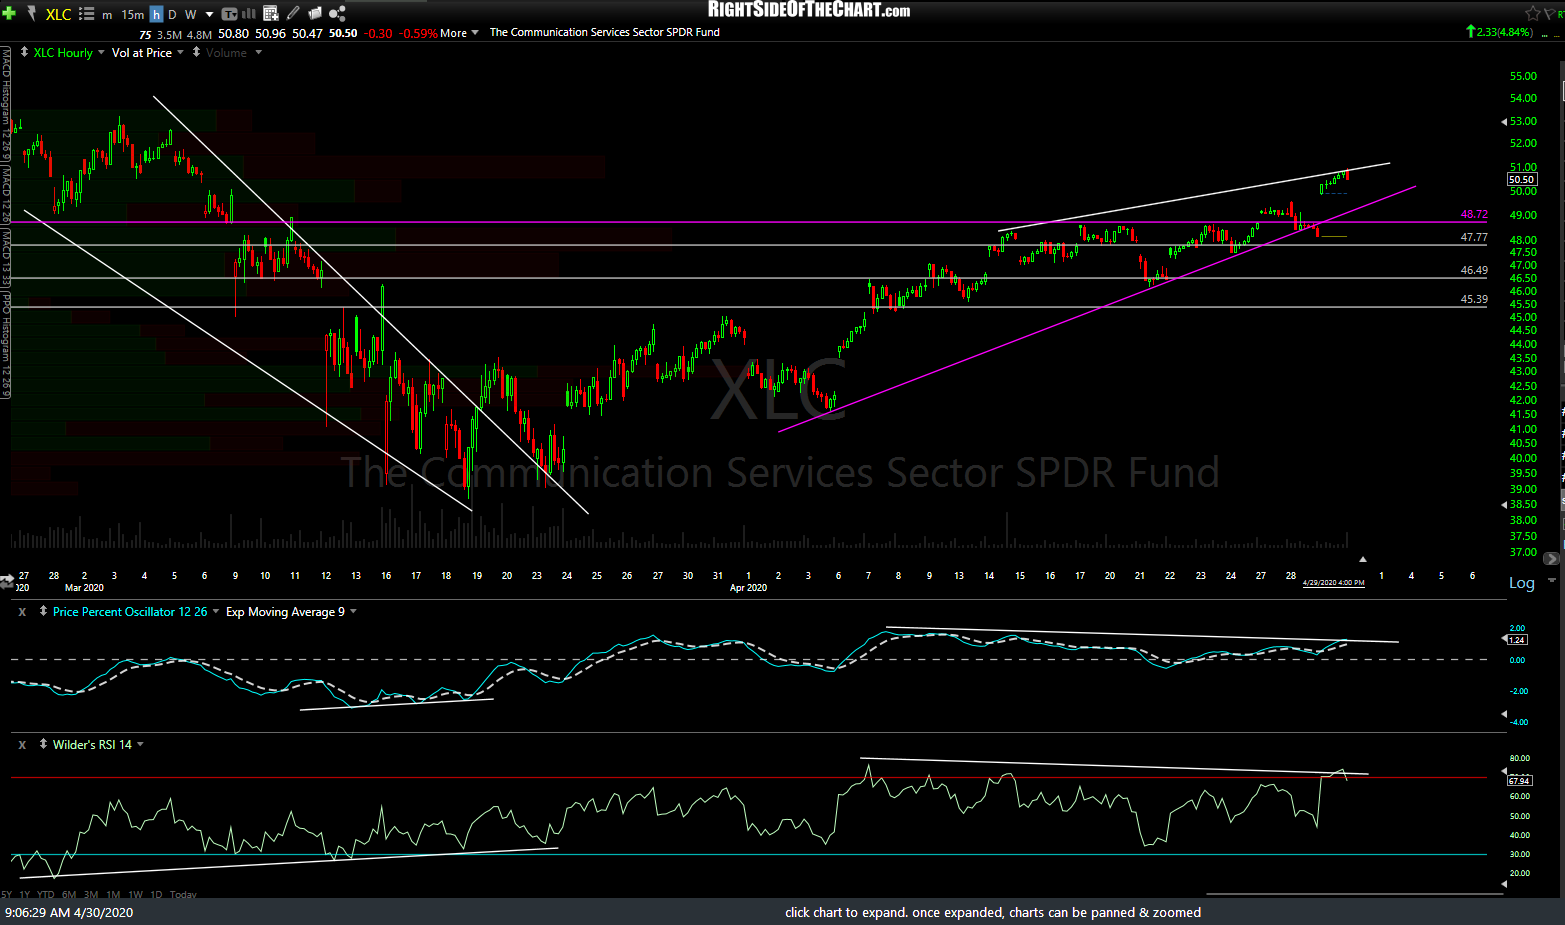
- XLC 60m April 30th
-

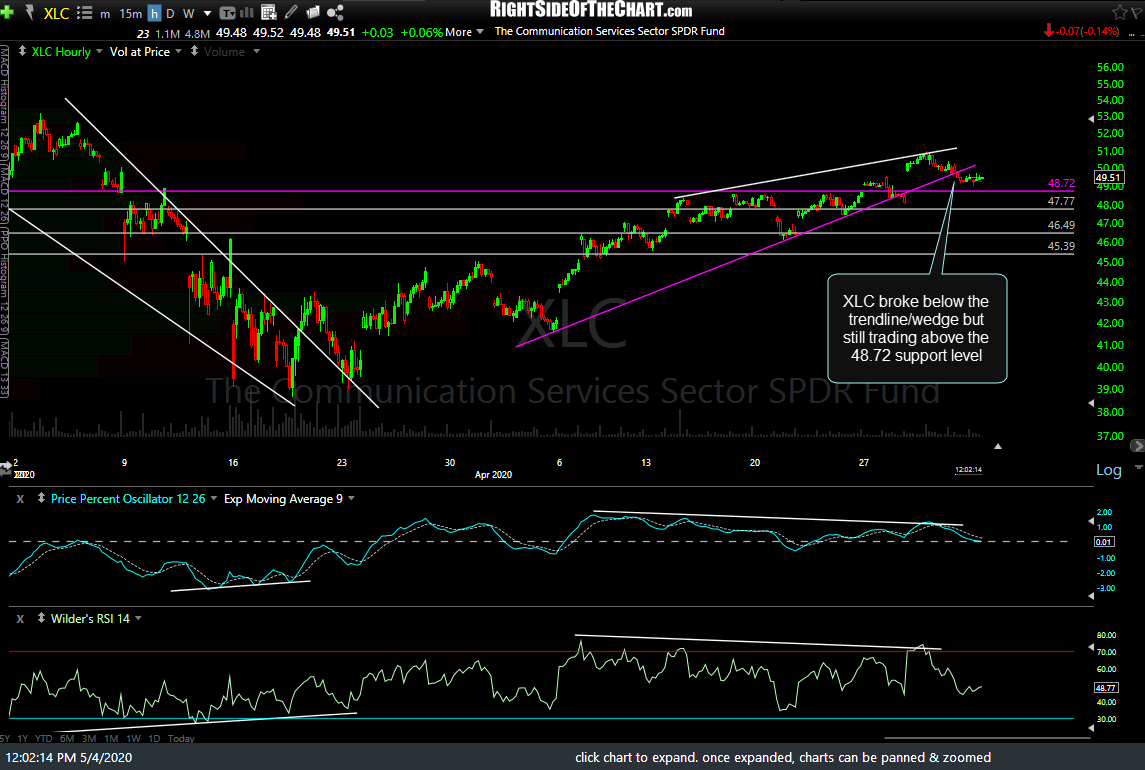
- XLC 60m May 4th
-

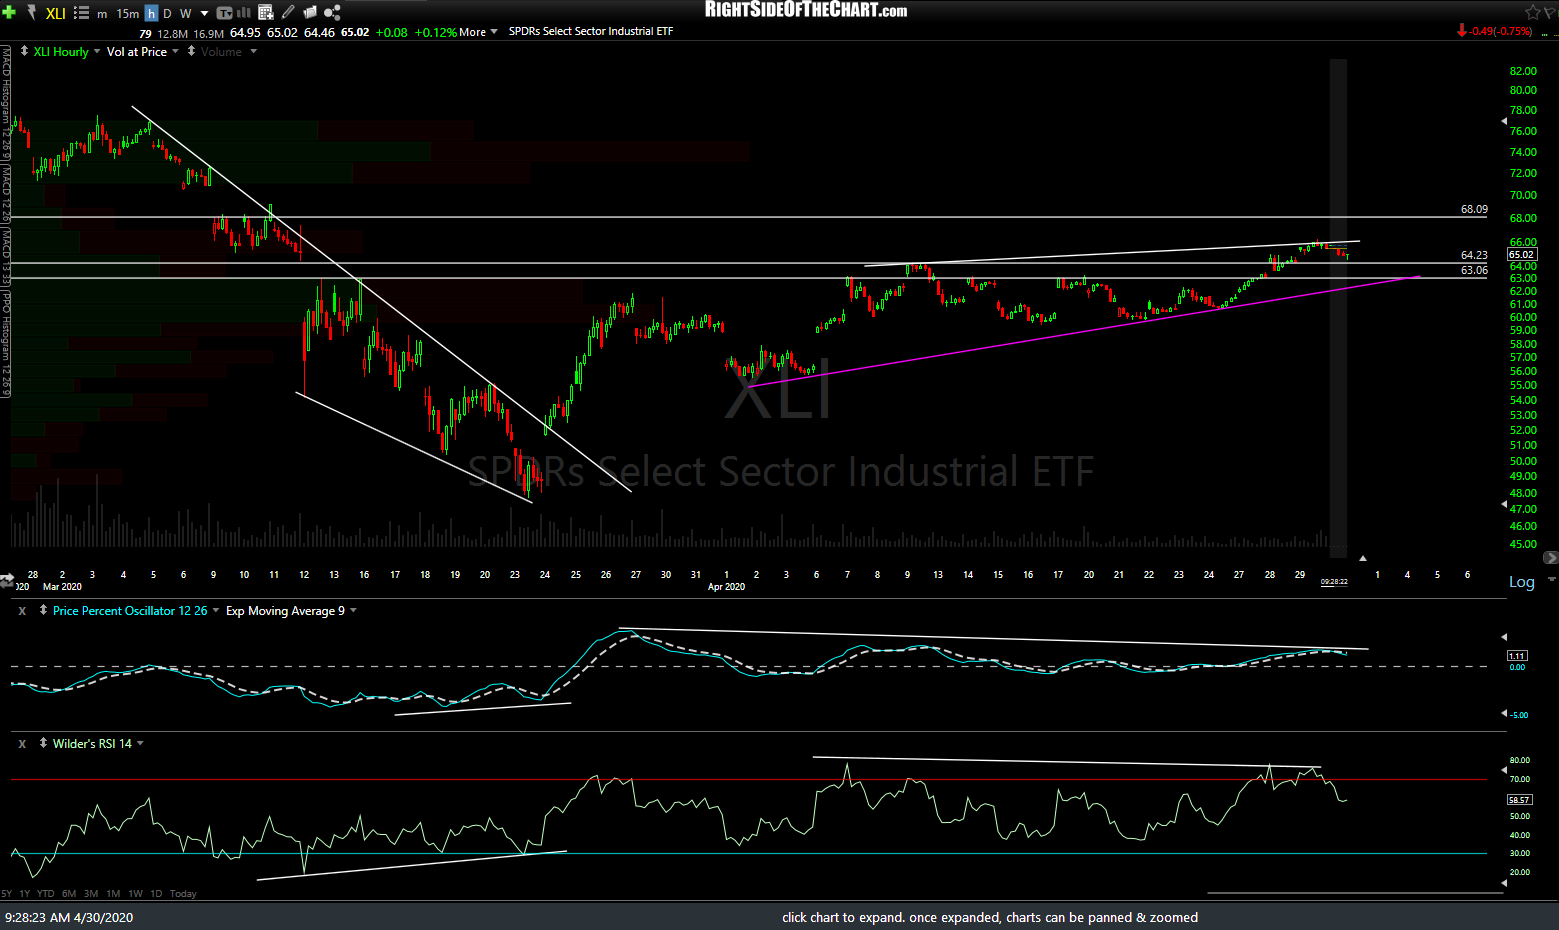
- XLI 60m April 30th
-
- XLI 60m May 4th