
Global equity markets are rallying in a ‘risk-on’ trade while safe haven assets such as treasury bonds & gold are being sold as a result of the French elections & lessened probability of a Frexit. Here’s a snapshot of the risk-on & risk-off assets: Gold, U.S. Treasury Bonds & a few the major US stock indices.
Starting with the safe haven assets, GLD (Gold ETF) is being sold today along with treasuries as of flight out of safe-haven assets. The sell-off in GLD could also be attributed to the fact that it just recently reached the most overbought readings since in over a year following an extended rally. The 3 horizontal lines just below are the former resistance zone that should now act as support.
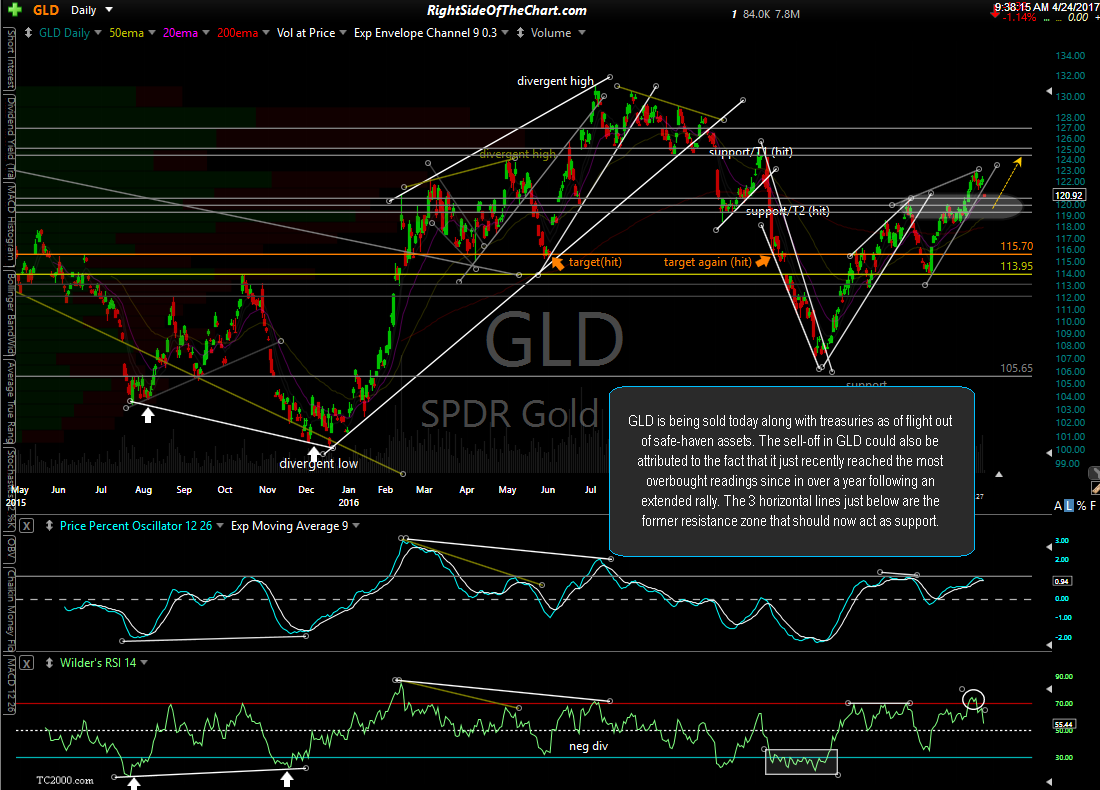
GLD daily April 24th
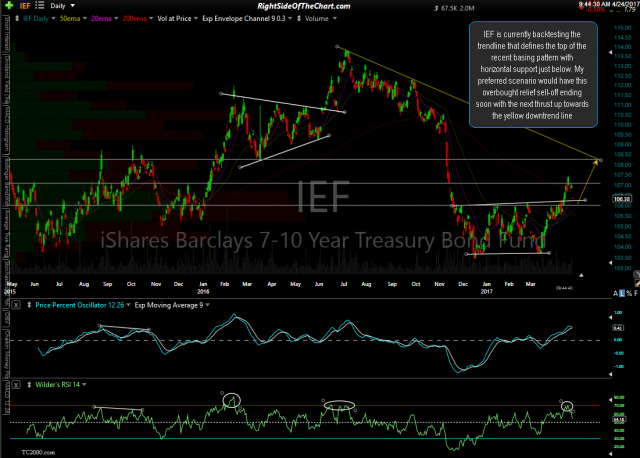
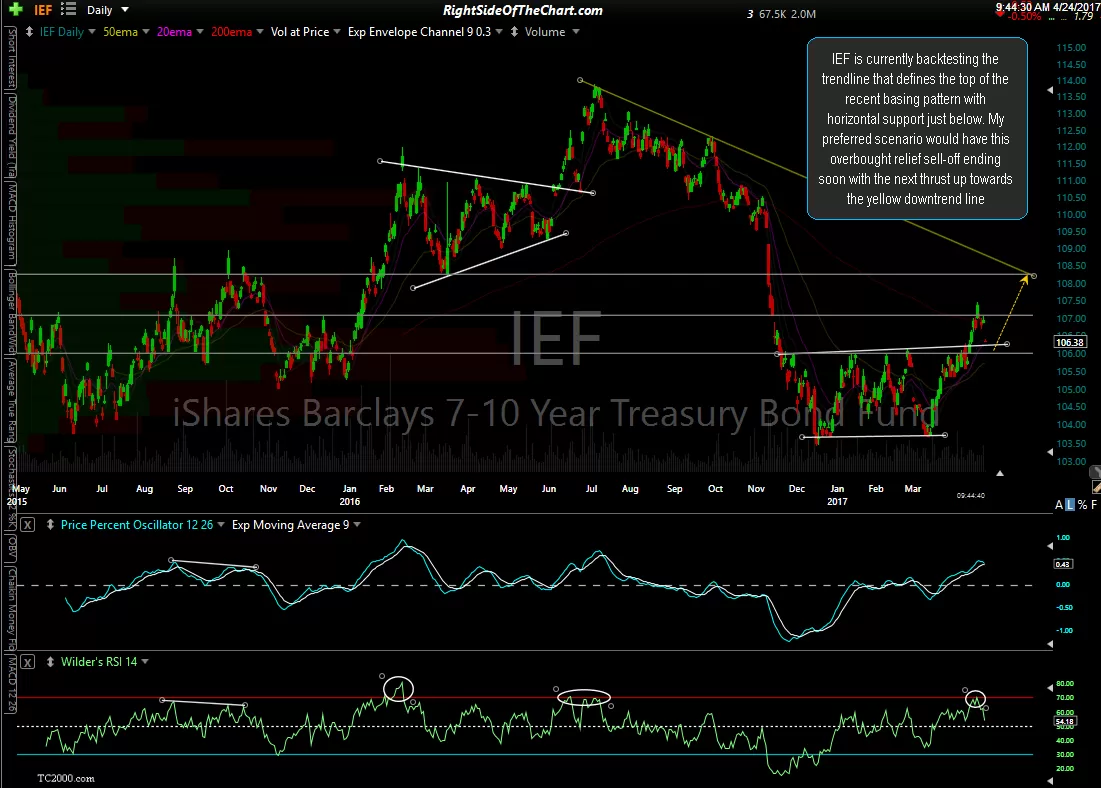
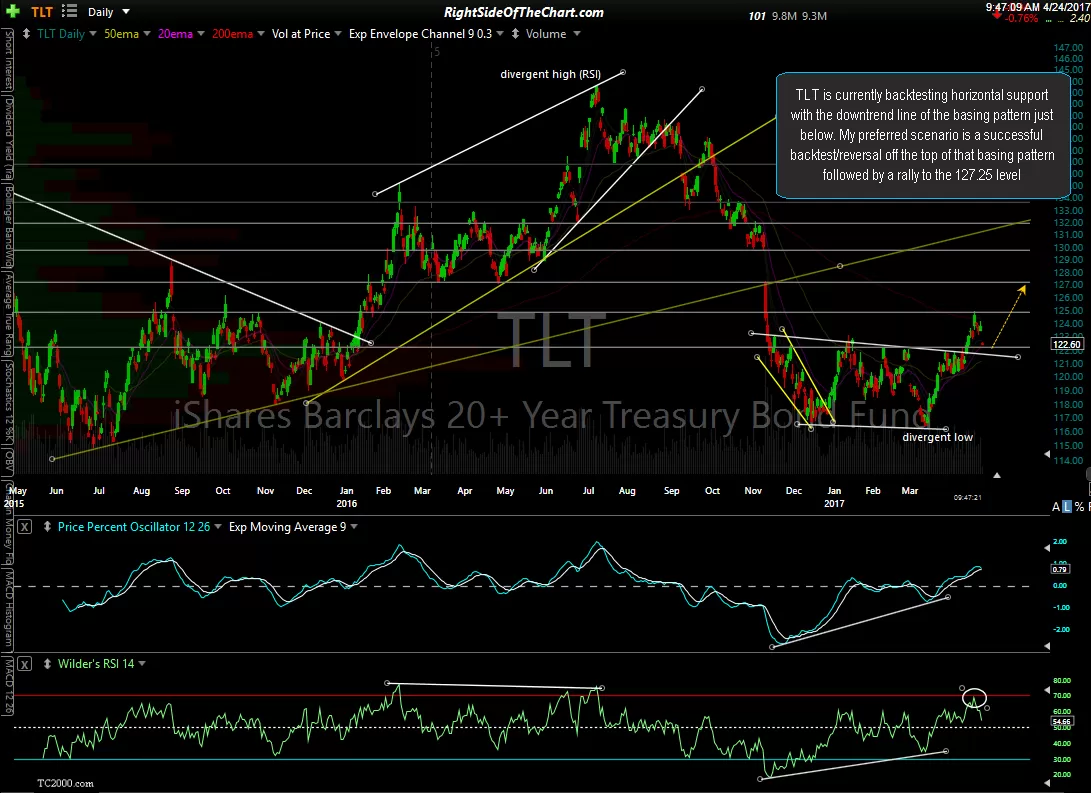
IEF (7-10 year Treasury Bond ETF) is currently backtesting the trendline that defines the top of the recent basing pattern with horizontal support just below. My preferred scenario would have this overbought relief sell-off ending soon with the next thrust up towards the yellow downtrend line while TLT (20+ year Treasury Bond ETF) is currently backtesting horizontal support with the downtrend line of the basing pattern just below. My preferred scenario is a successful backtest/reversal off the top of that basing pattern followed by a rally to the 127.25 level. These ETFs represent bond prices, which move inversely to bond yields. Bond prices up = yields falling which typically is a result of lower economic growth expectations and/or a flight to safety in expectation of weakness and/or volatility in the stock market.
-
- IEF daily April 24th
-
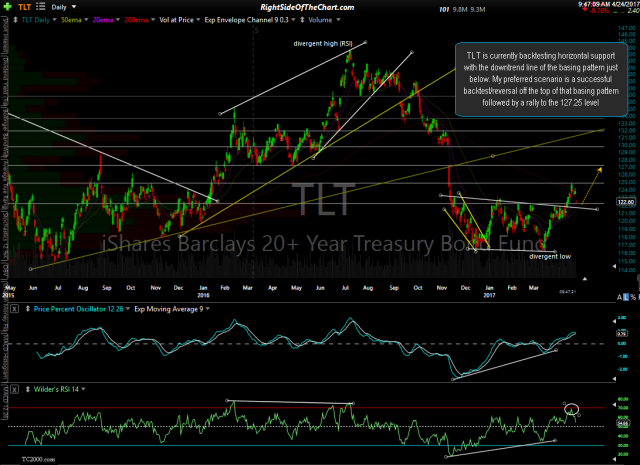
- TLT daily April 24th
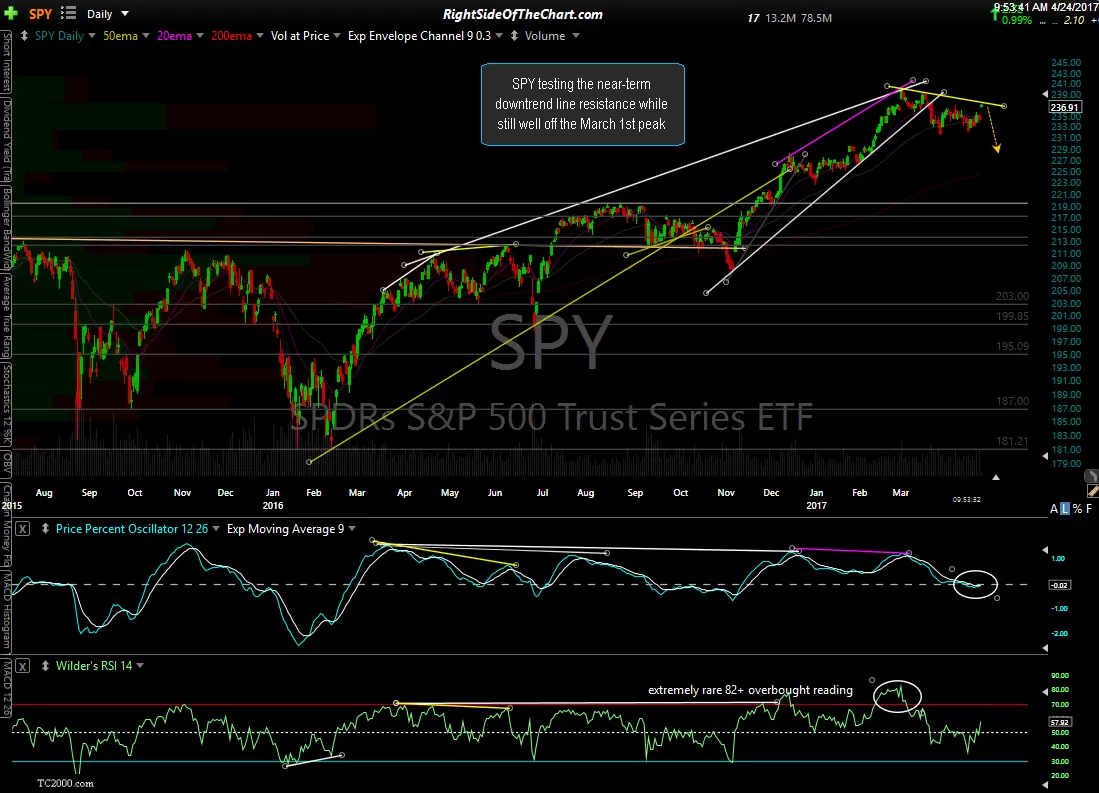
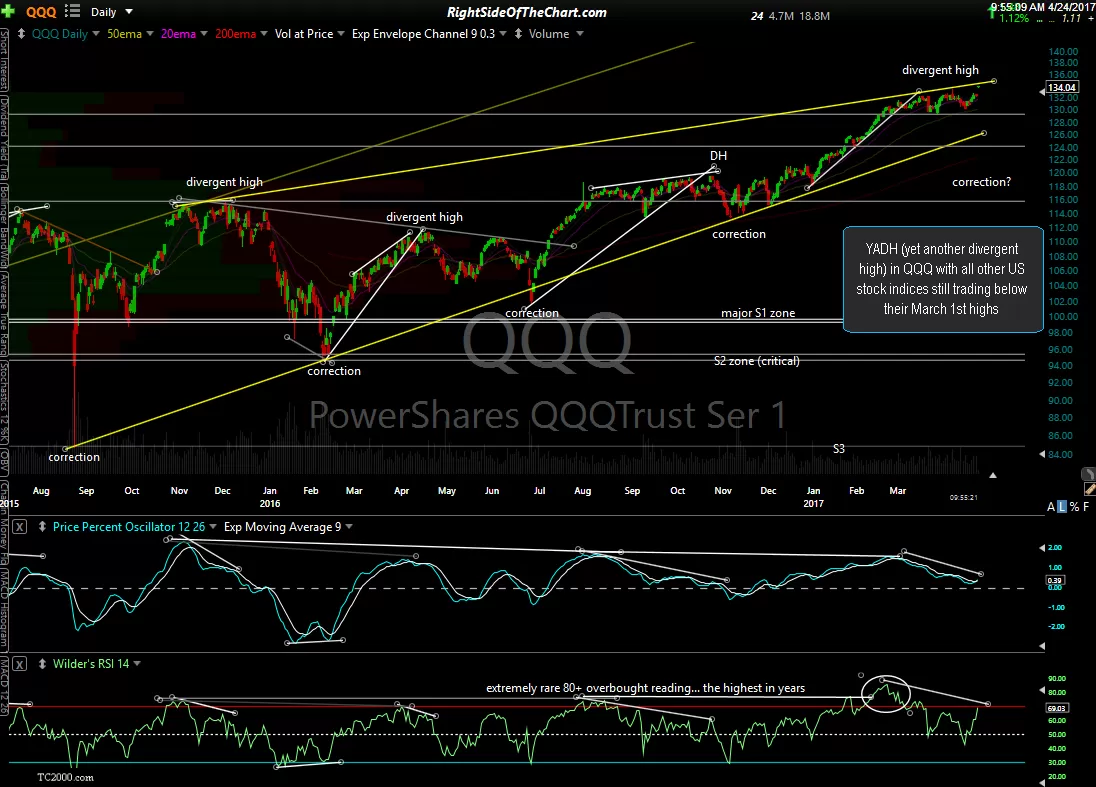
Moving on to the equity markets, SPY (S&P 500 tracking ETF) is testing the near-term downtrend line resistance while still well off the March 1st peak while we have YADH (yet another divergent high) in QQQ with all other US stock indices still trading below their March 1st highs.
-

- SPY daily April 24th
-
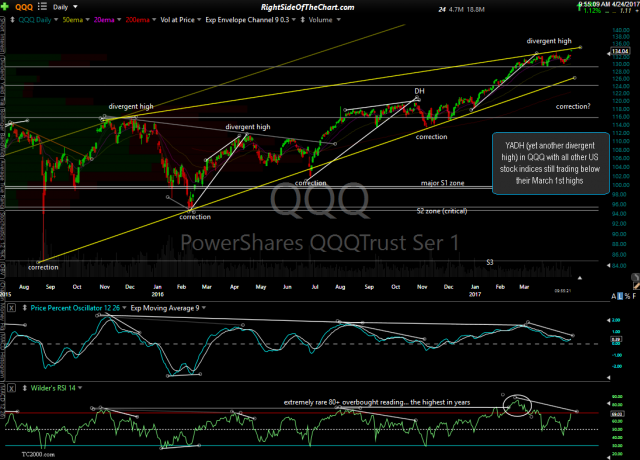
- QQQ daily April 24th
Although still trading below its March 1st highs, IWM (Russell 2000 Small Cap Index ETF) is the only index that I’m seeing some potential bullish developments with today’s French elections relief ‘risk-on’ rally as a daily close above the 139 resistance level / top of multi-month trading range (sans late Feb failed breakout) & bullish zero line cross of the PPO signal line could open the door to new highs.

IWM daily April 24th
While today’s early gains are impressive, along well withing the range of the daily swing in the market in recent months, both to the upside & downside, other than the breakout in the less significant small caps, I don’t see many technically significant developments in the charts although should the equity markets continue to substantially build on these gains while both treasury bonds & gold continue lower & clearly move below the lower end of the aforementioned support zones, then all we have so far is just more ‘noise’ within the recent multi-month down-to-sideways trading range in the stock market.