
Starting out with the daily charts of QQQ & SPY, it seems apparent that forced selling due to the various factors discussed in recent videos such as margin calls, forced ETF & mutual fund liquidations due to panic investor selling, risk-mitigation protocols (selling & hedging) from pension funds, hedge funds, etc.. has overwhelmed any buying at the key support levels on the way down that “should” have contained the slide or at least produced a tradable bounce. Hard to say when that forced selling will end although I can say with absolute certainty that it will & once it does, the potential for an explosive snapback rally, quite possibly with double-digit gains within just a few days, is likely.
I’ll follow up with charts of SPY & QQQ highlighting the next support levels & resistance levels above that can serve as price targets for the snapback rally once it comes but for now, here’s the /NQ 60-minute with /NQ trading around the 8200ish support defined by the Dec 3rd major reaction low. Once the forced selling abates & the market puts in some bullish reversal candles, which could quite likely come today, I’m looking for a bounce back to the 8890-8946 resistance zone, about 9-10% above current levels although the arrow breaks show the potential lower targets that once could use as well.
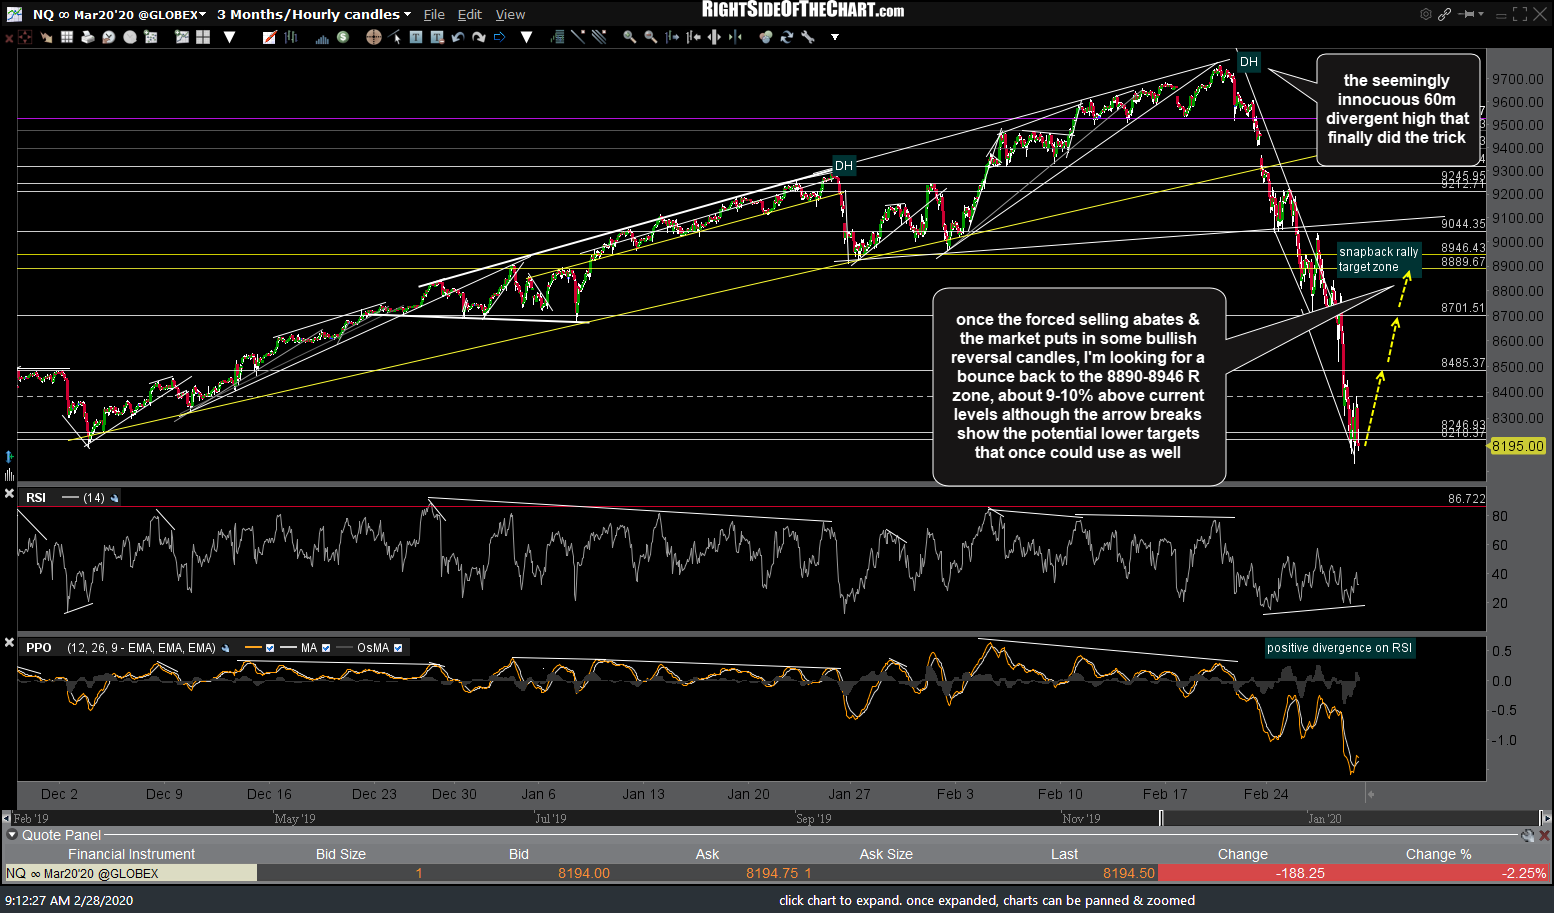
NQ 60m Feb 28th
/CL crude oil appears poised for a potentially explosive short-covering rally as it approached the key Dec 24, 2018 reaction low with bullish divergences building this daily time frame.
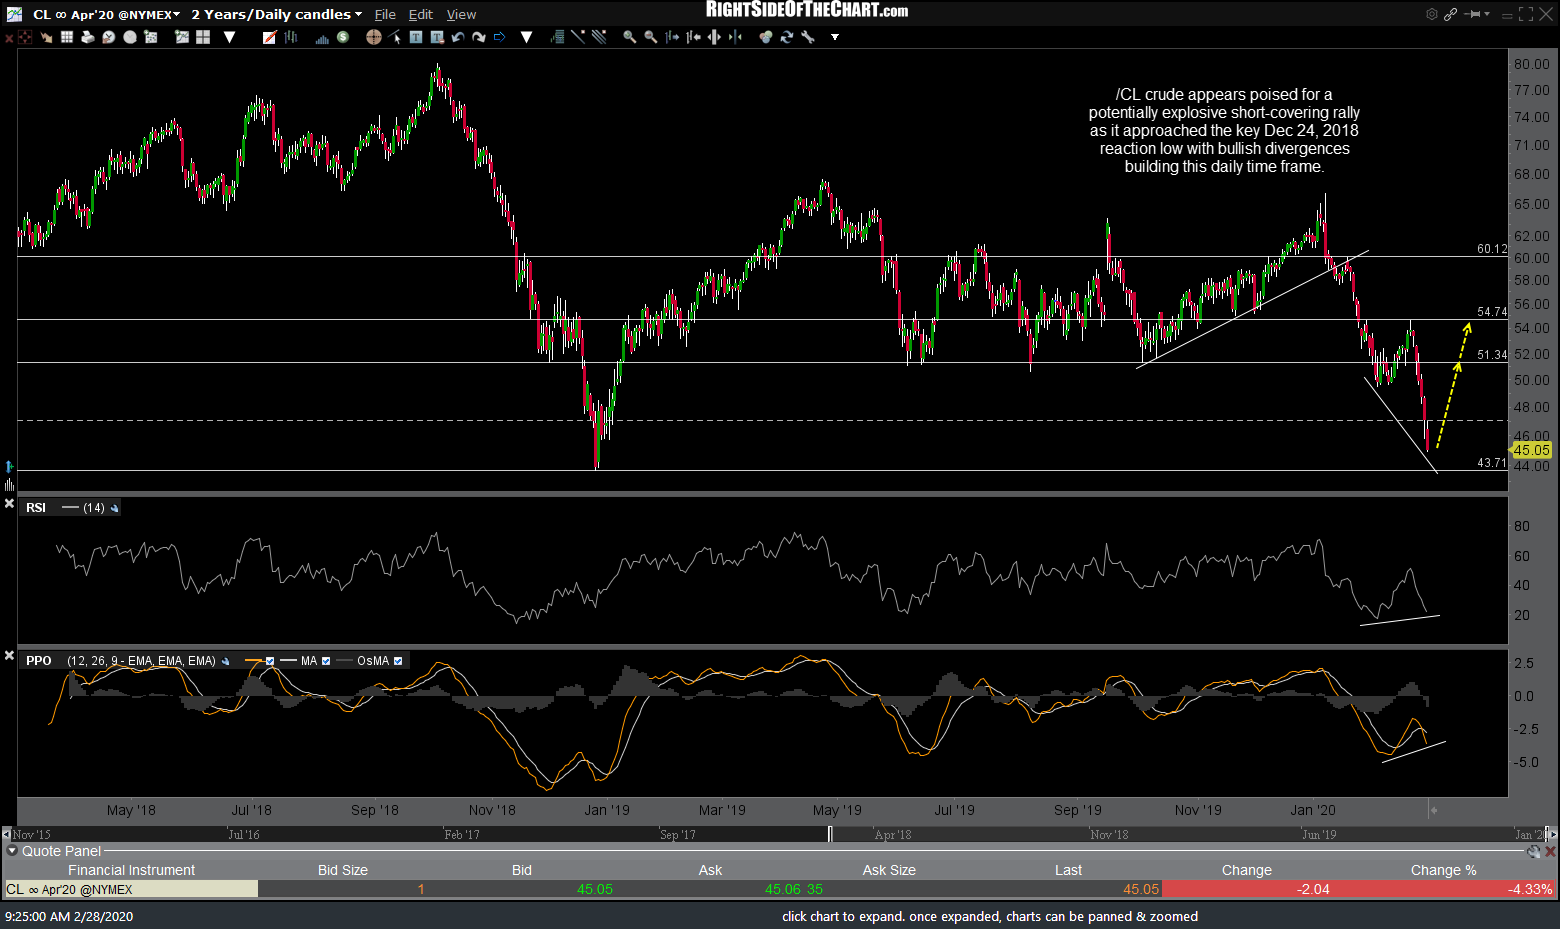
CL daily Feb 28th
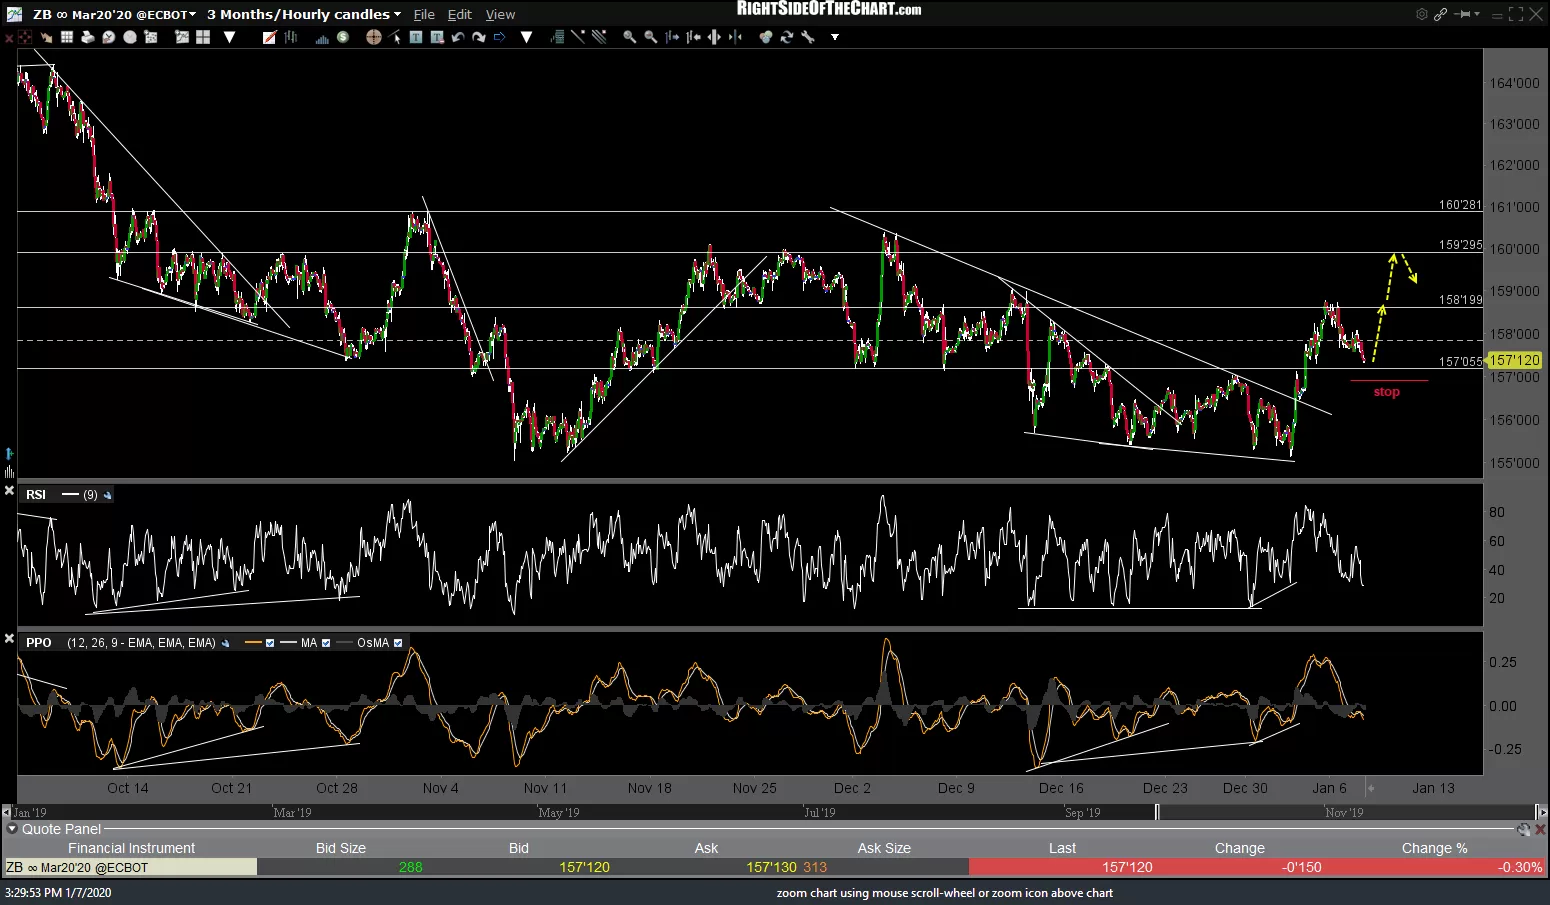
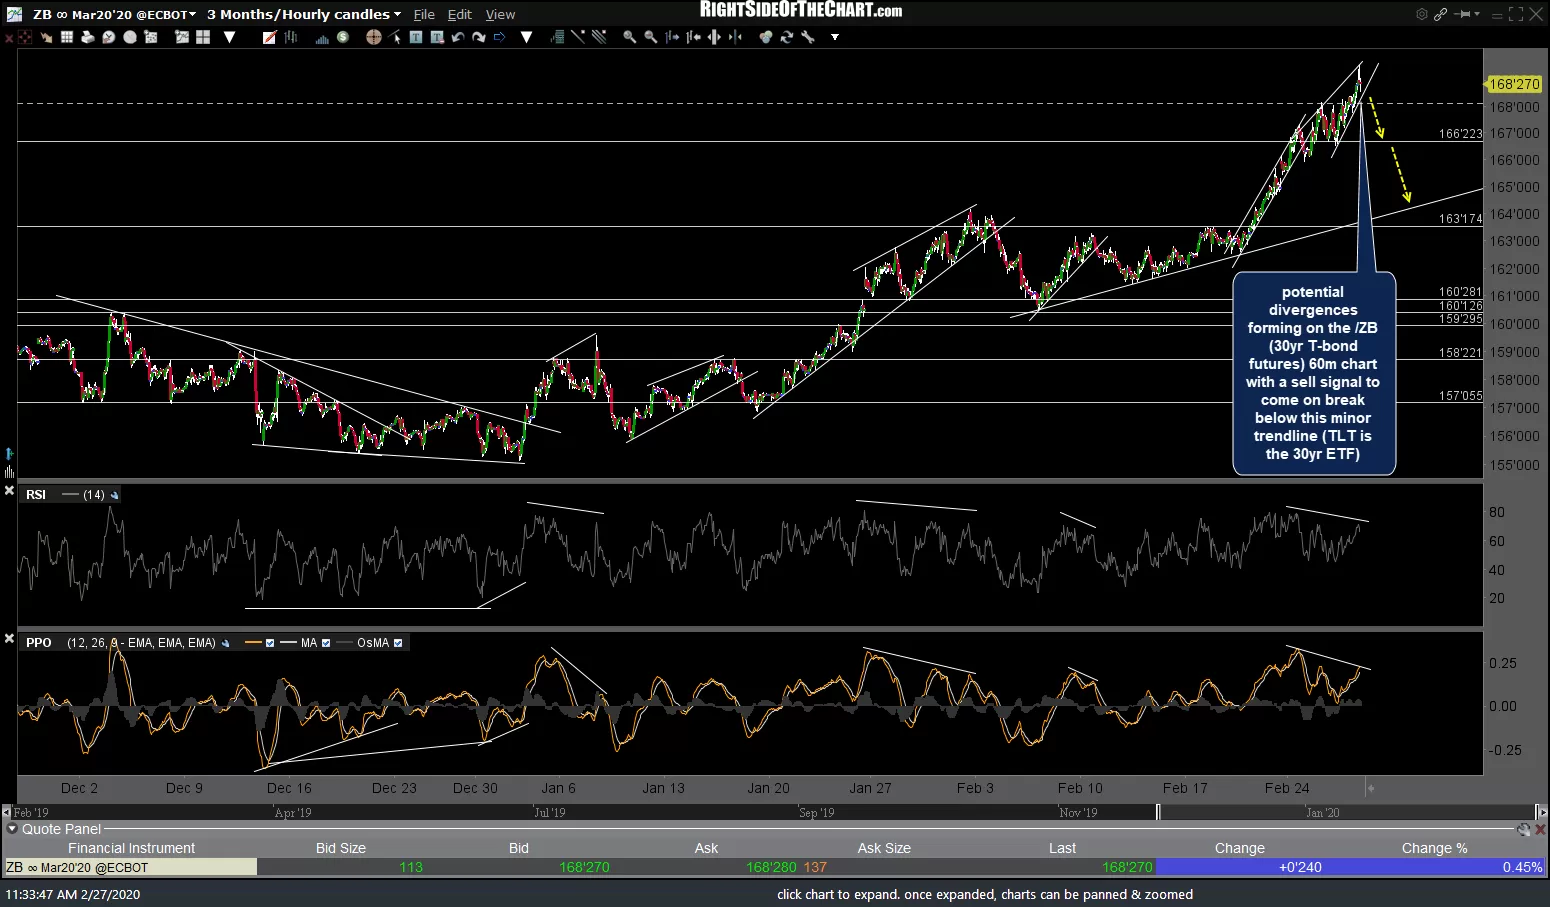
Since the breakout & buy signal above the bullish falling wedge back on Jan 7th (first chart below), /ZB has been zig-zagging higher as the smart money must have seen dark clouds on the horizon for the stock market as it chugged along to new highs while ignoring the building bearish technicals. Once the tide in the stock market turns back to bullish, even if just the first decent counter-trend rally with more downside to come later, /ZB (30-yr Treasury Bond futures) will likely pullback to at least the 165’216 level. ETF traders could short TLT or go long TBT (2x 30-yr T-bond ETF) to game a pullback on Treasuries. Still awaiting a break below the minor trendline along with some signs of a half-decent reversal in the equity market for a sell trigger on Treasuries.
-
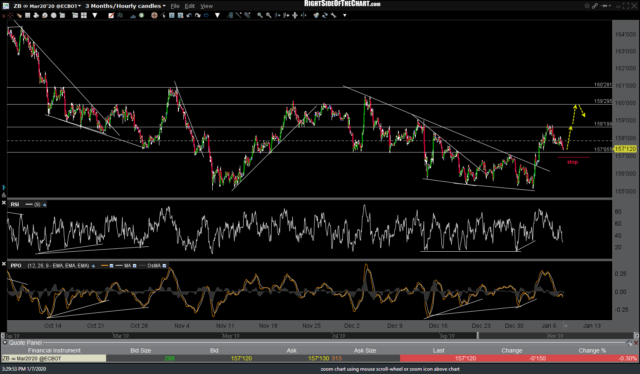
- ZB 60m Jan 7th.png
-

- ZB 60m Feb 27th
-
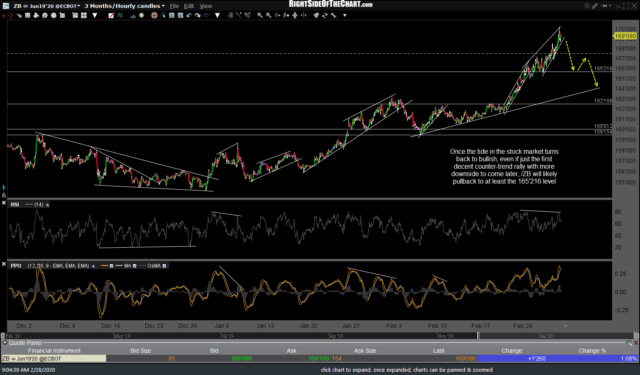
- ZB 60m Feb 28th

On a related note, I often say that Treasury Bonds are the King of flight-to-safety instruments with gold a close second. However, gold apparently has been dragged down in the forced selling which would make sense as it had been rallying along with equities leading up to the stock market top (plus, I had pointed out the fact a pullback was likely in gold last week due to the recent parabolic spike and pending, and since realized, trendline break). While I don’t care to short gold here, as it could finally start to catch a decent bid soon if the stock market goes much lower, I suspect it will continue down toward the next supports of the uptrend line & intersecting 1600 support level once the stock market mounts the first decent counter-trend rally.

GC 60m Feb 28th
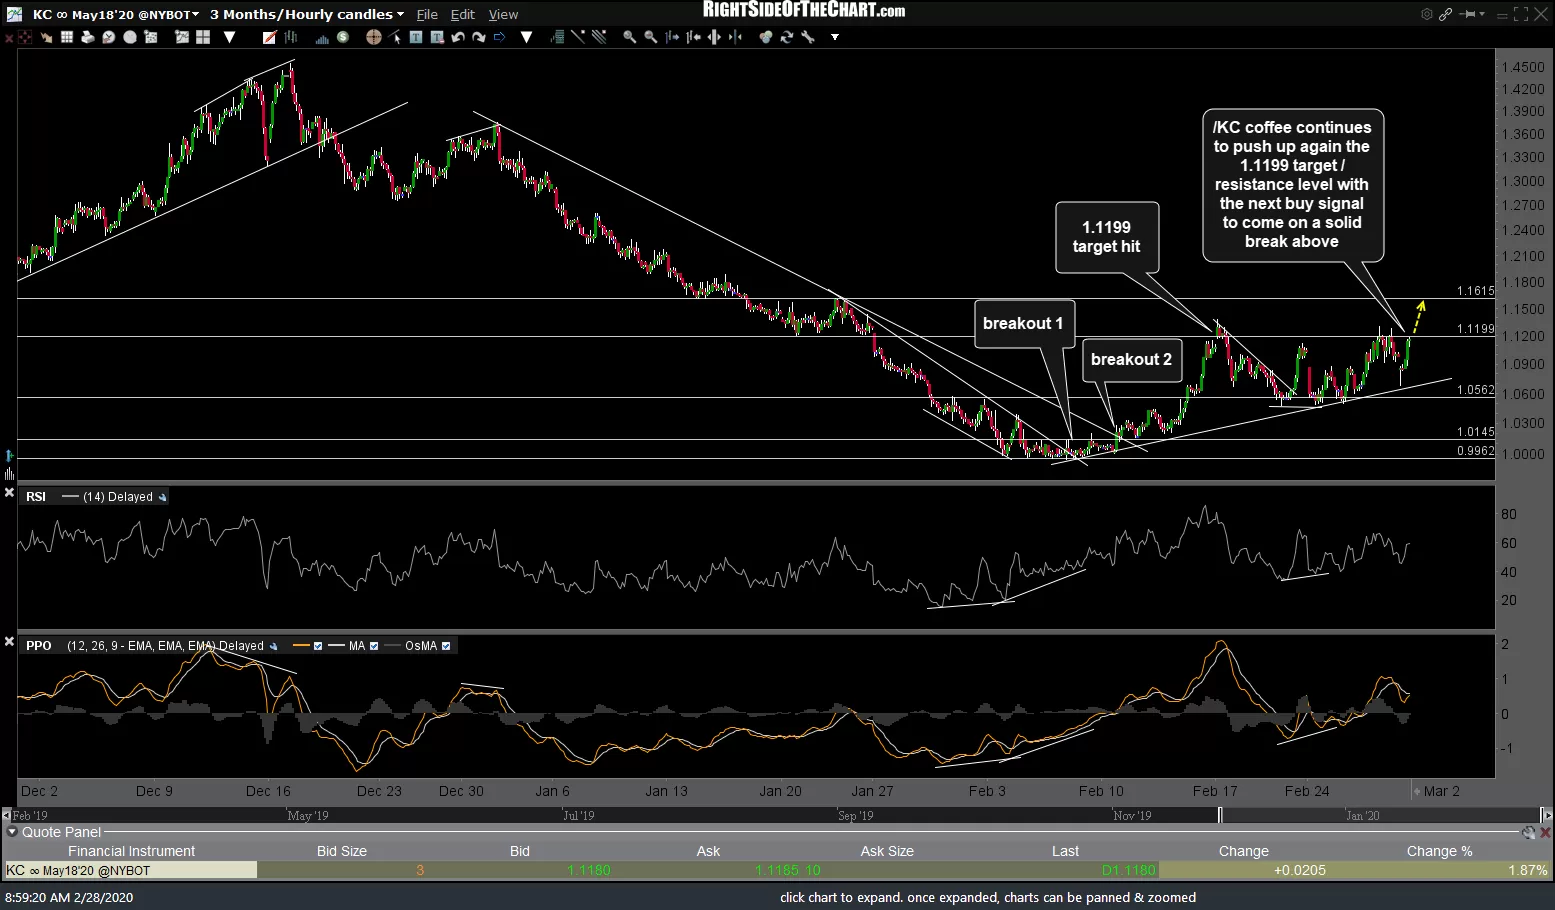
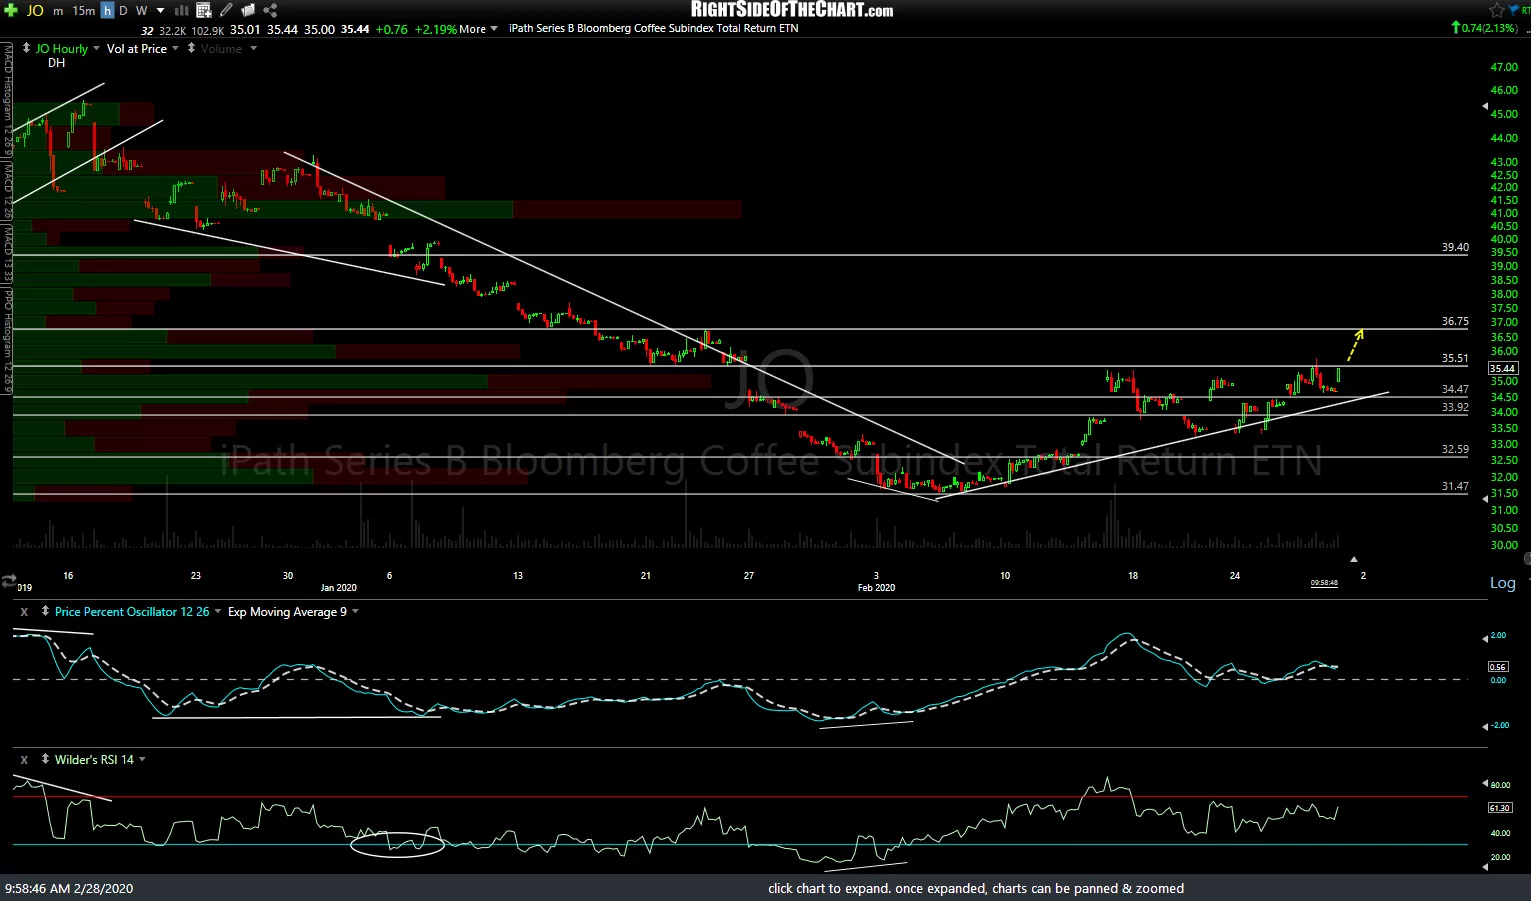
/KC coffee continues to push up again the 1.1199 target/resistance level with the next buy signal to come on a solid break above. JO is the coffee ETF with comparable levels on the 60-minute chart below.
-
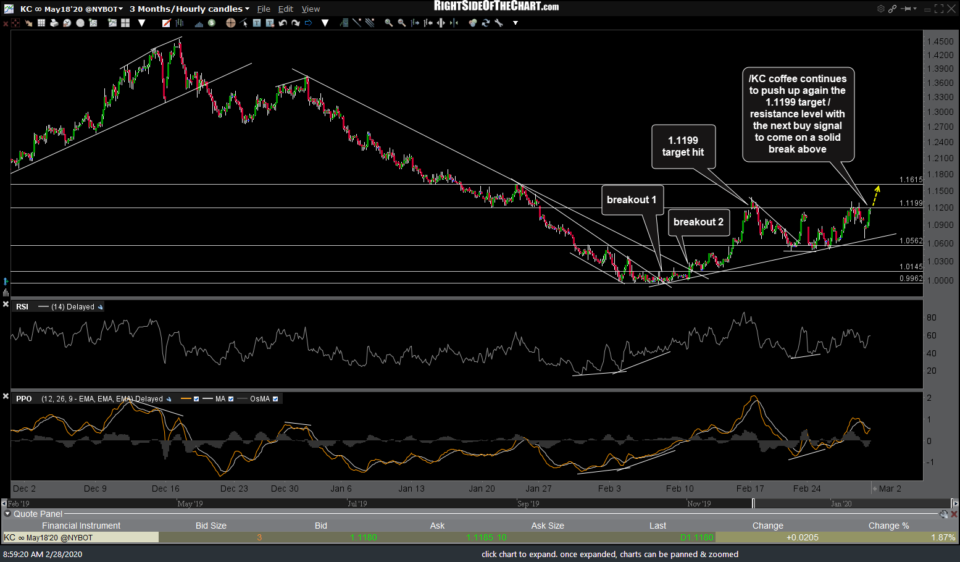
- KC 60m Feb 28th
-
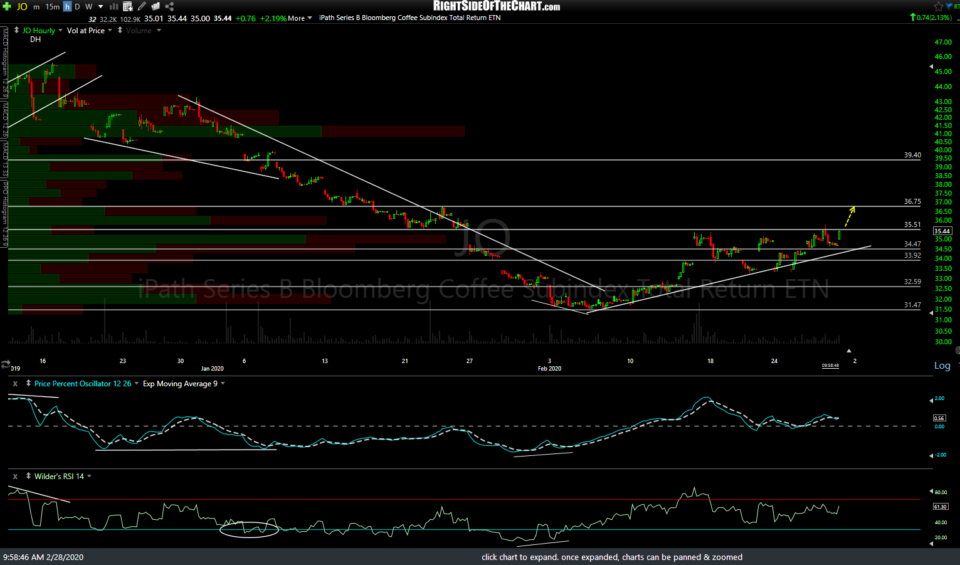
- JO 60m Feb 28th
Maybe another thrust up within this rising wedge (along with the next/first snapback rallying in the stock market), maybe not. Either way, /PA palladium continues to set up for a monster shorting opp. PALL is the palladium ETF. 60-minute chart of /PA below.
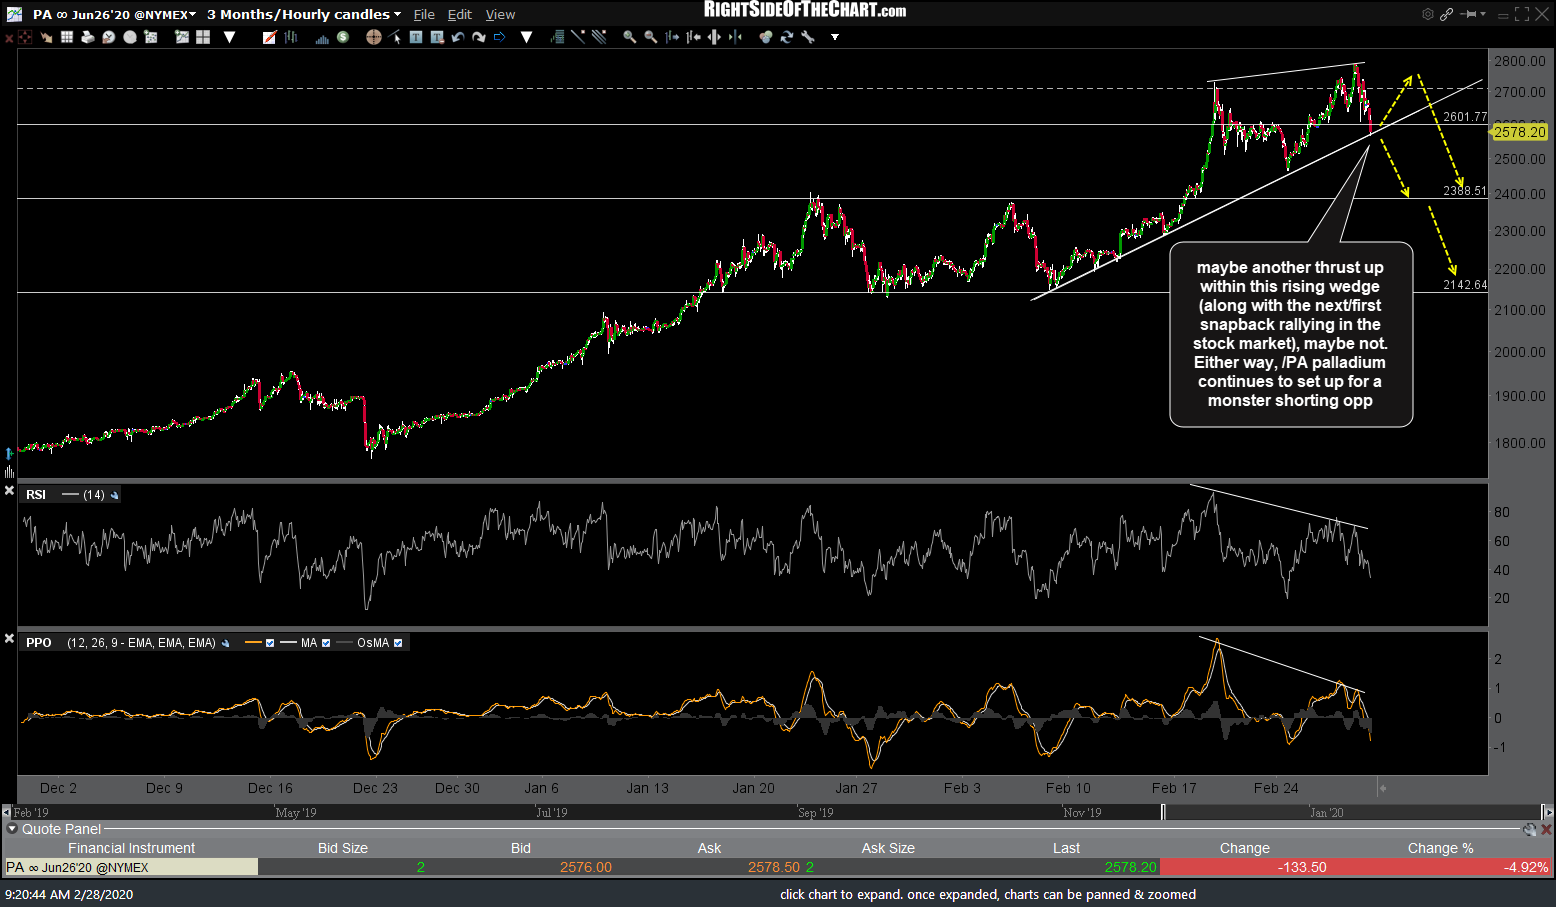
PA 60m Feb 28th