
/NQ Nasdaq 100 futures (and QQQ) sell signal still pending a solid break of the recent lows and the 4100 support on /ES (S&P 500 futures). 60-minute charts below.

NQ 60m April 26th

ES 60m April 26th
/ZB (30-yr Treasury bond futures) has pulled back to uptrend line & price support, offering another objective long entry or add-on with the next buy signal to come on a break above the 159’005 target (already hit)/resistance level. TLT is the comparable ETF.

ZB 60m April 26th
Likewise, /ZN (1o-yr T-bond futures) has pulled back to the 132’094 former 1st target, now support level as well as potential uptrend line support, thereby offering another objective long entry or add-on. IEF is the comparable ETF.
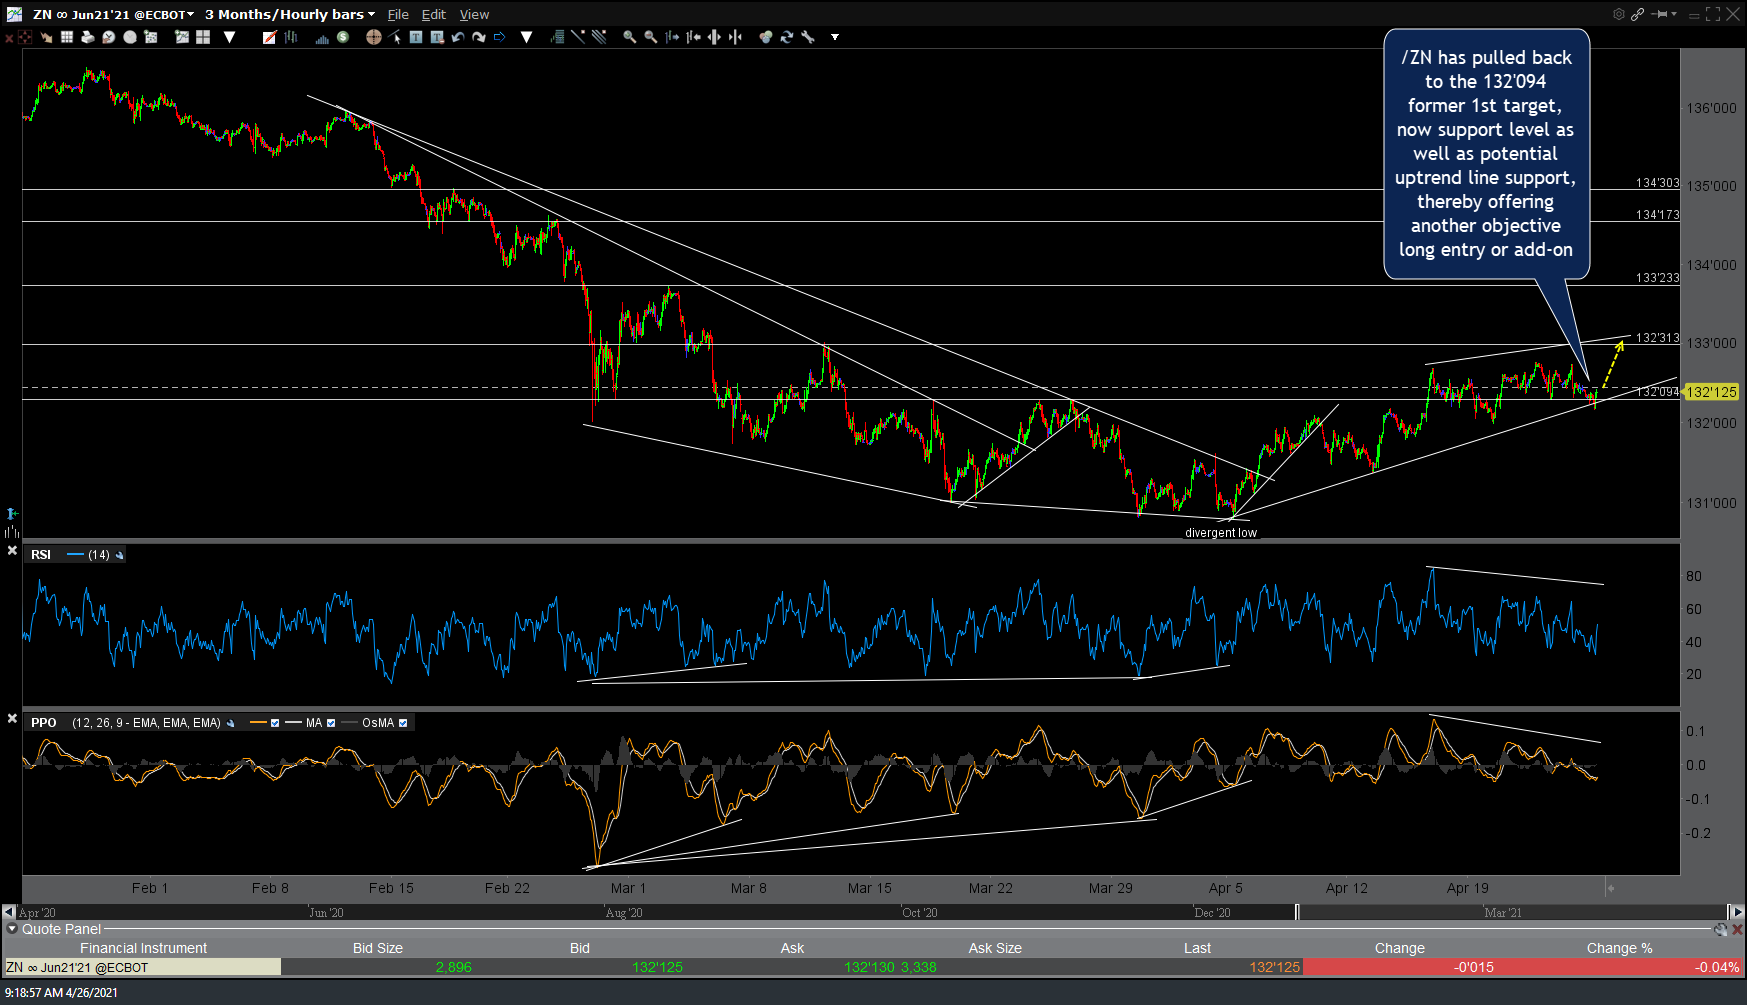
ZN 60m April 26th
/CL (crude oil futures) was rejected at the 62.70ish resistance as per the primary scenario posted in the first chart below last Tuesday with a move down to at least the 60ish level still likely. USO is the comparable ETN.

CL 60m 3 April 20th
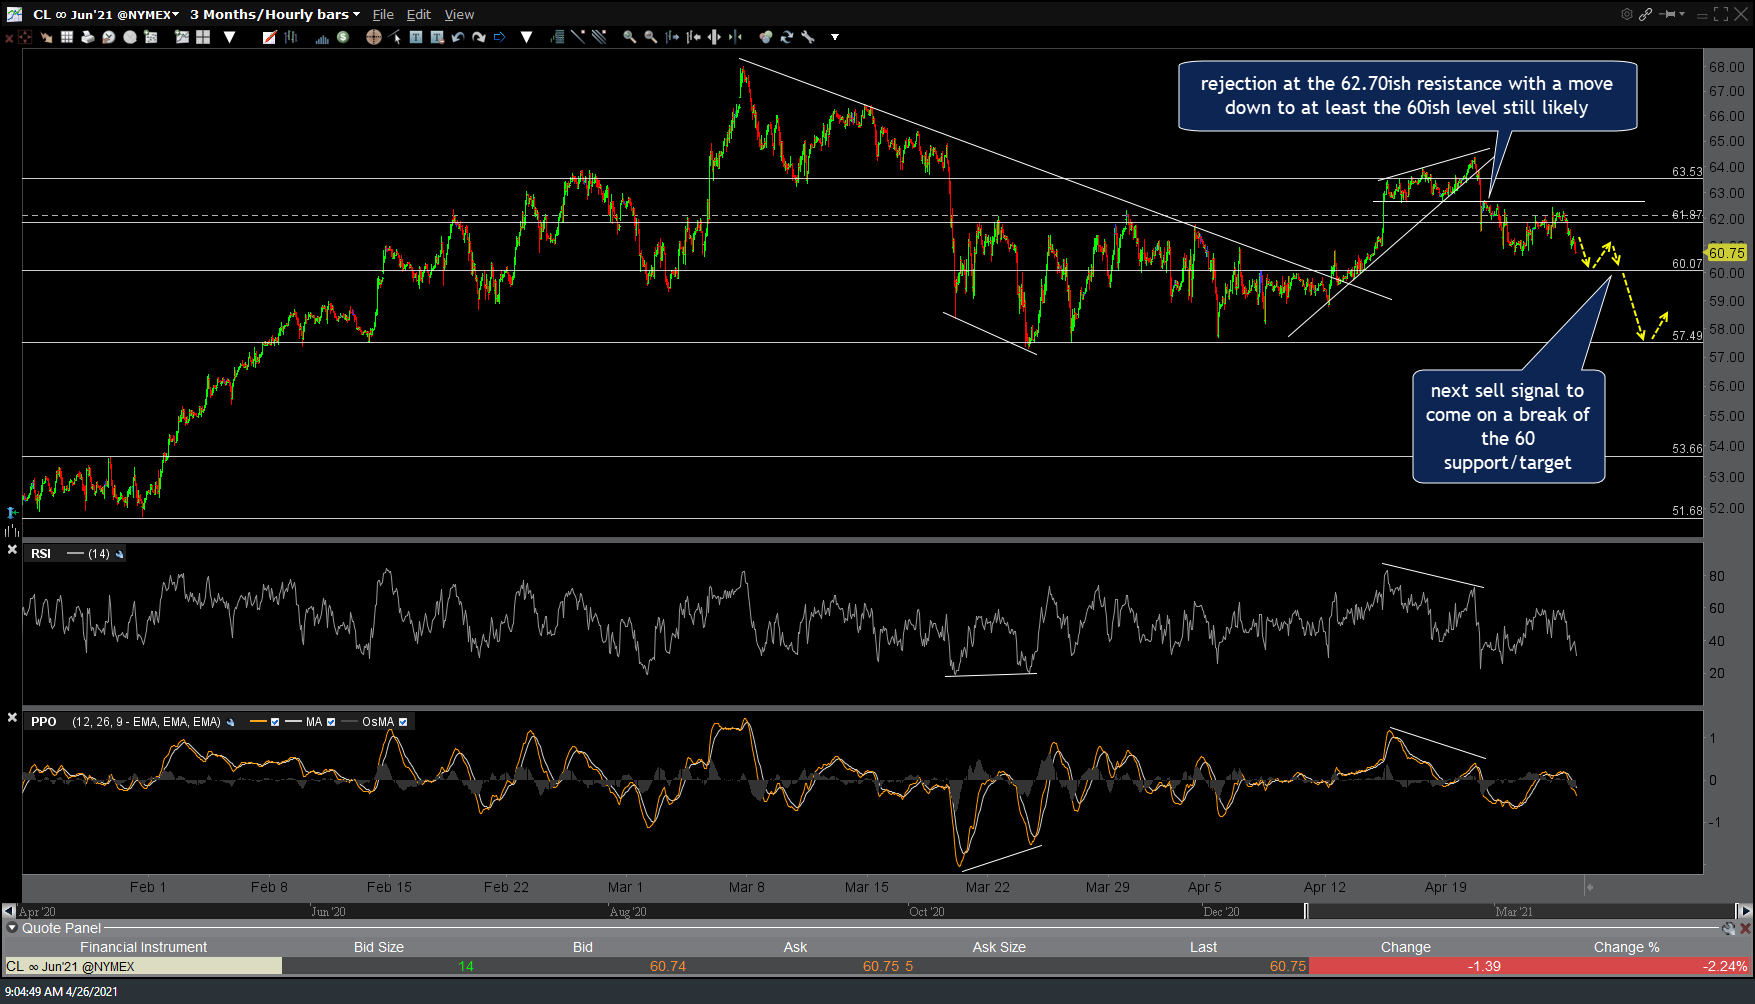
CL 60m April 26th
/NG (natural gas futures) is once again testing the uptrend line support, offering another objective long entry with a stop not too far below although the recent negative divergences could result in a breakdown unless taken out soon. UNG is the comparable ETN.
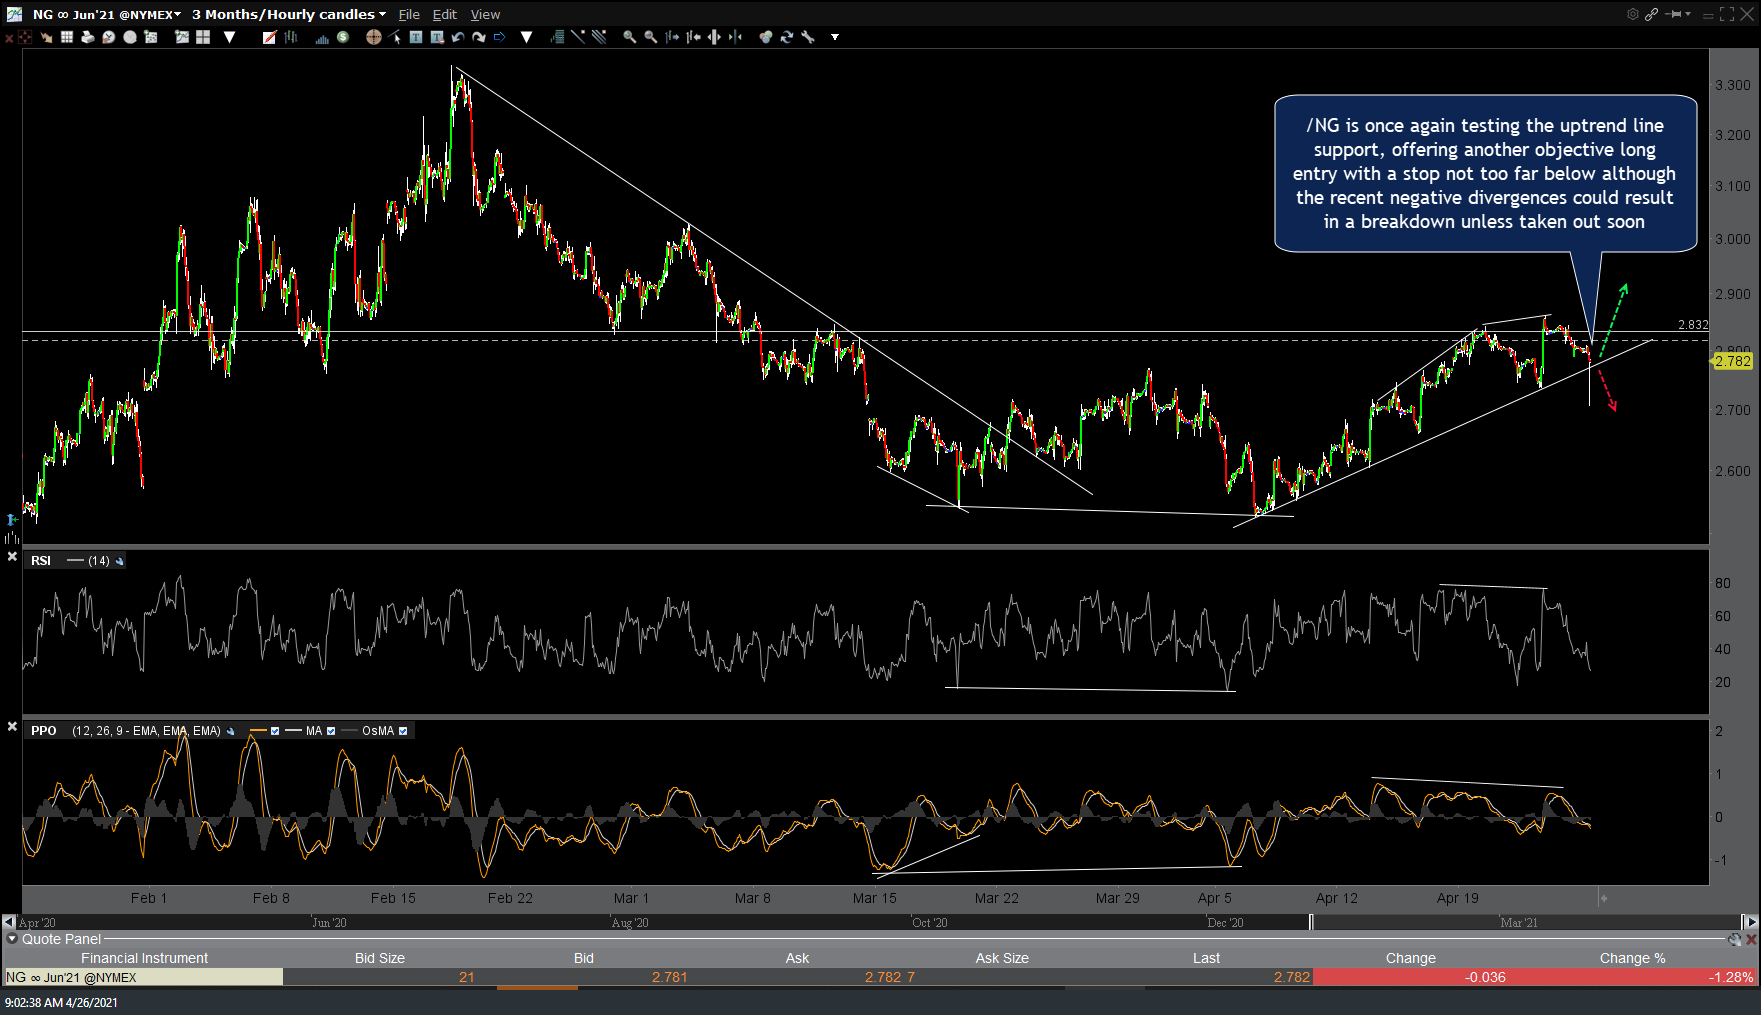
NG 60m April 26th