
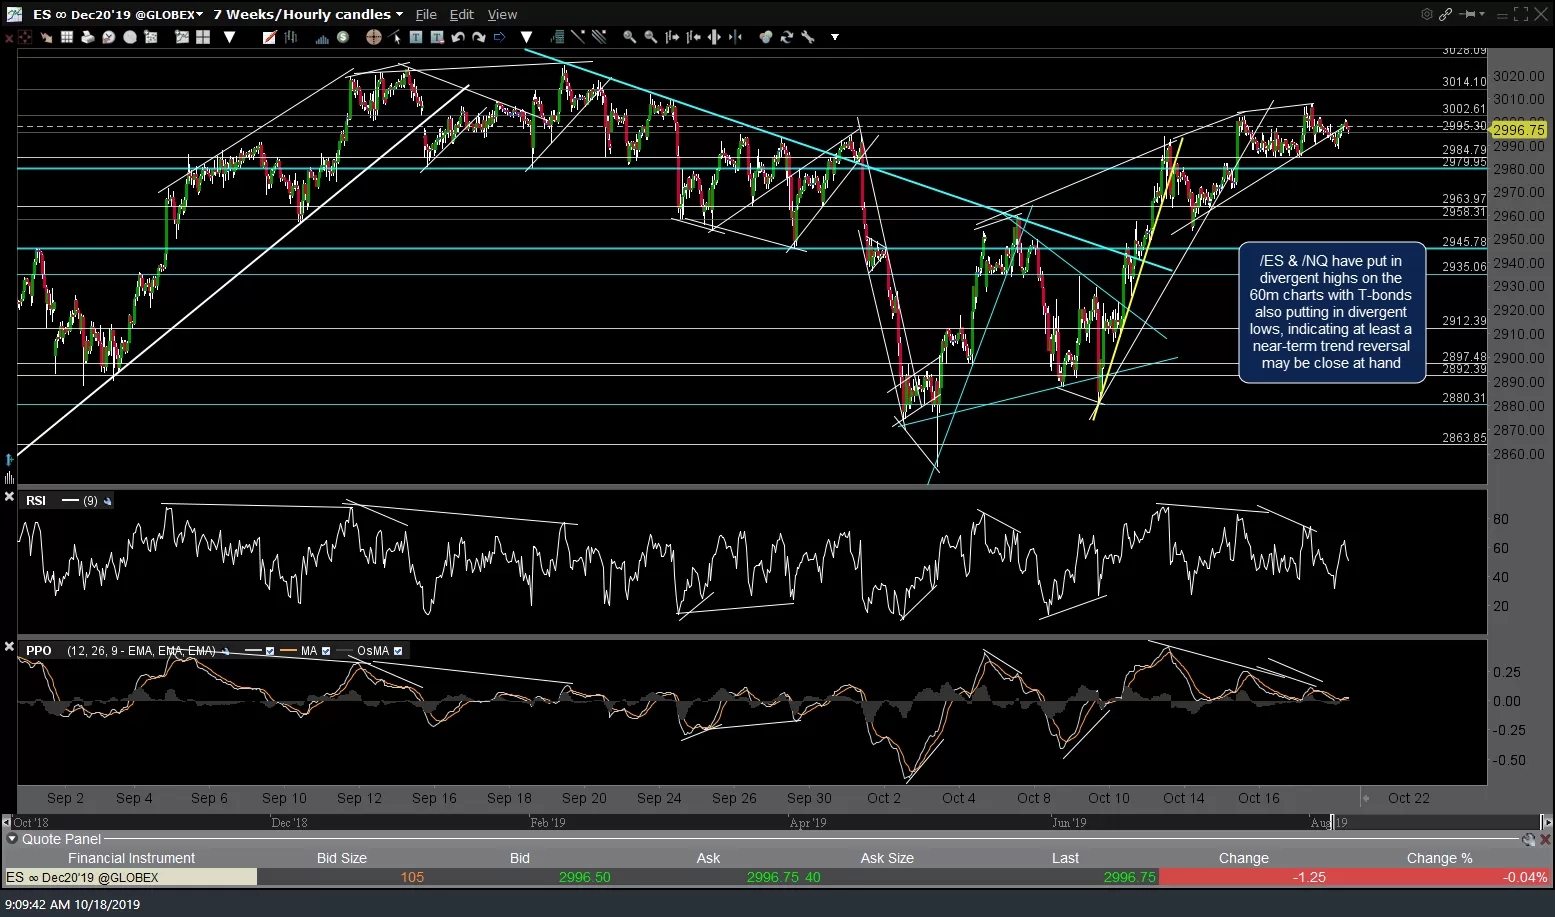
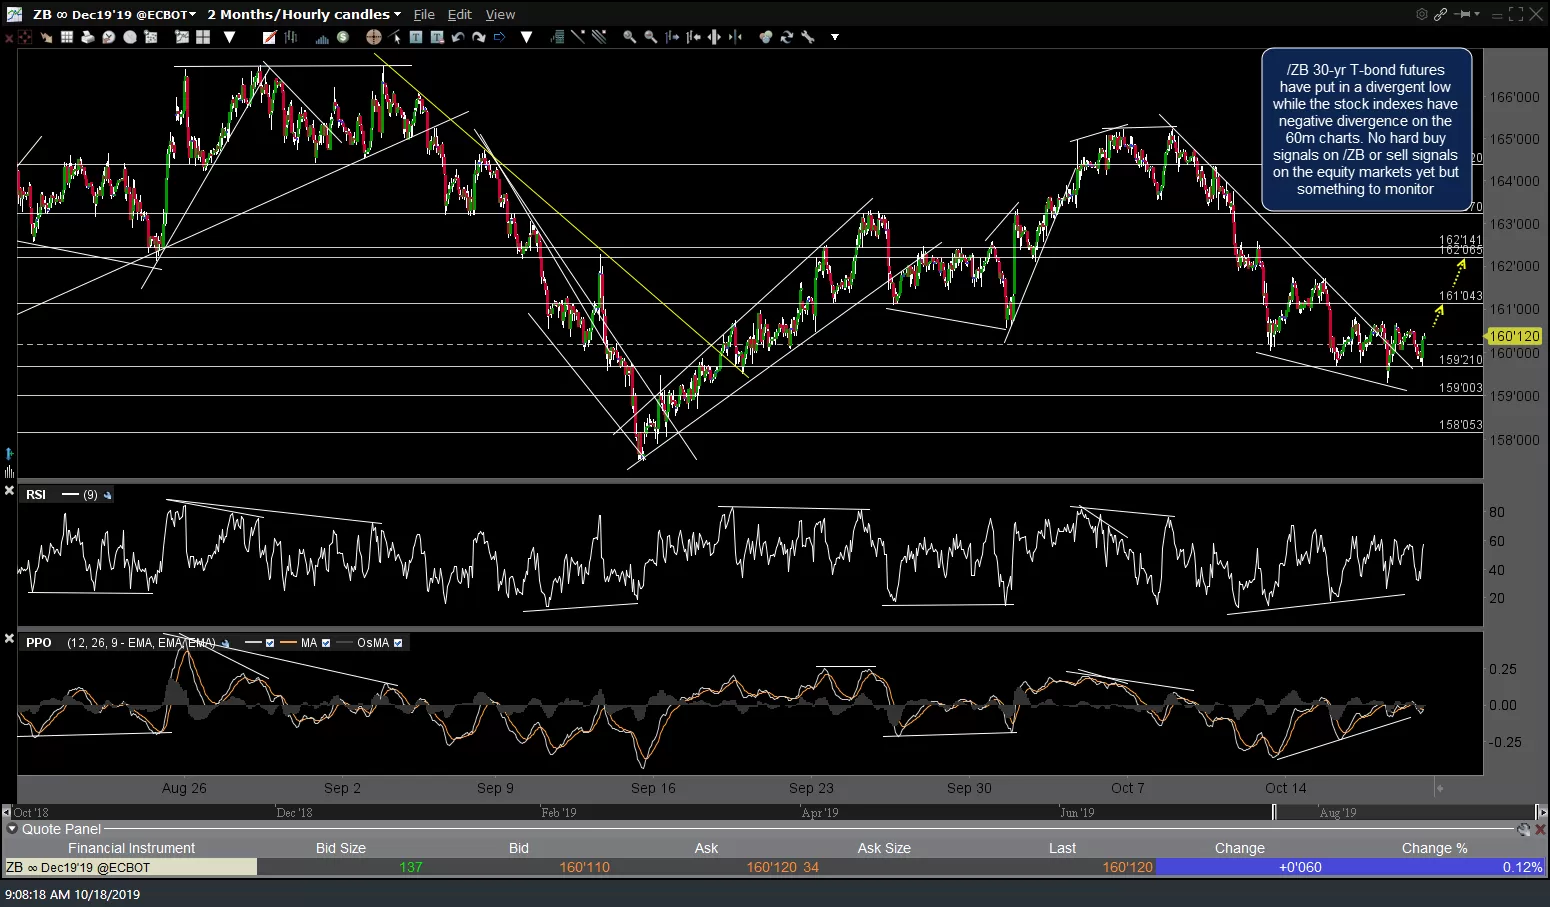
/ES & /NQ have put in divergent highs on the 60-minute charts with Treasury bonds also putting in divergent lows, indicating at least a near-term trend reversal may be close at hand. 60-minute charts of /ES, /NQ & /ZB below.
-

- ES 60m Oct 18th
-
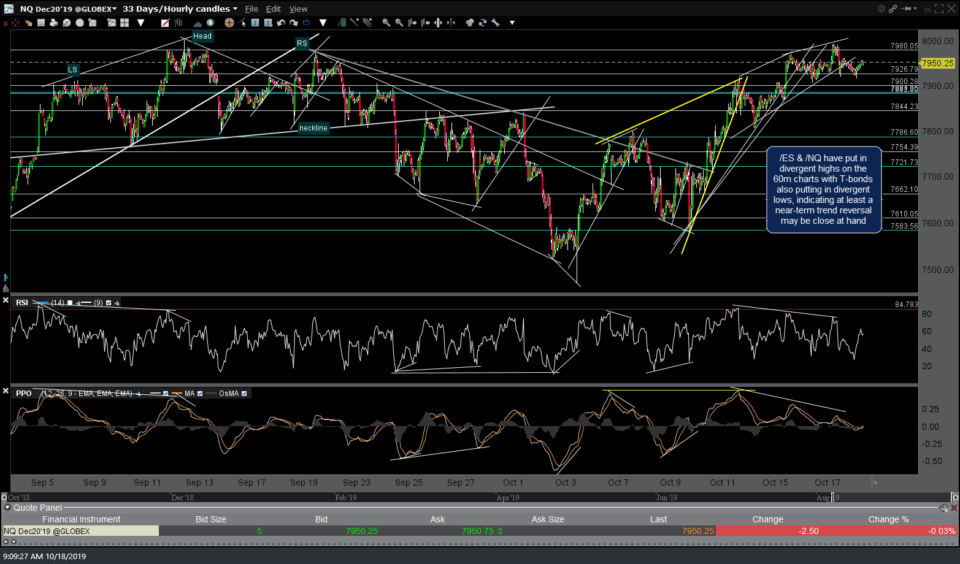
- NQ 60m Oct 18th

-

- ZB 60m Oct 18th
The small-caps have a better-defined uptrend line on the 60-minute charts with a sell signal on /RTY to come on a break below this 60m bearish rising wedge pattern as well as the comparable 60m uptrend line on IWM.
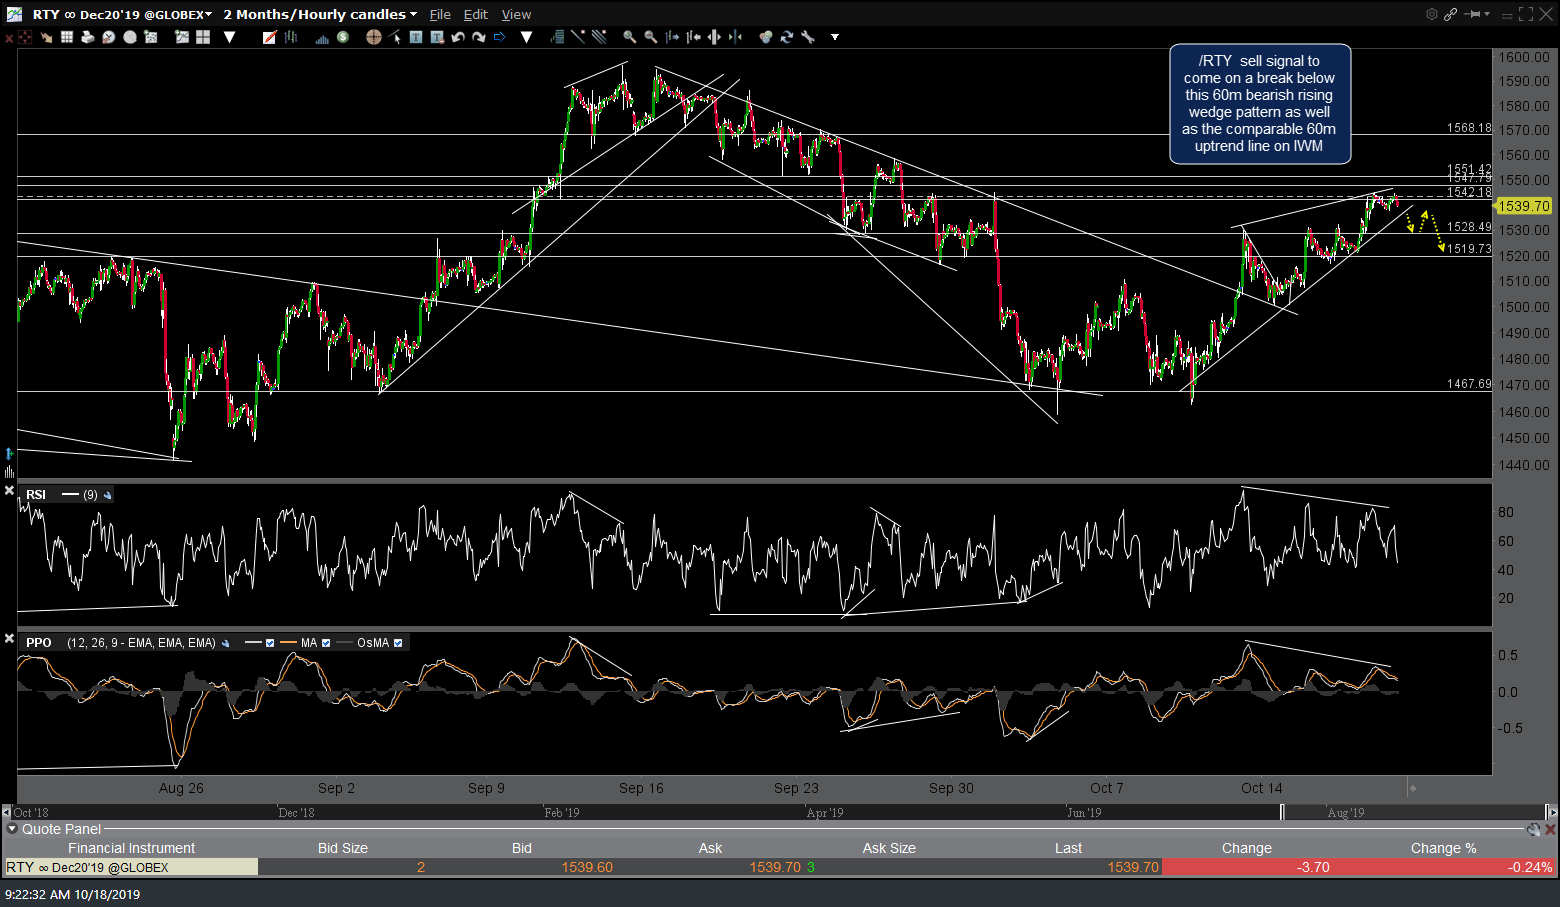
RTY 60m Oct 18th
/E7 Euro is approaching the next target/resistance level of 1.12ish but still appears to have more upside, minor zigs & zags aside. 60-minute chart below.

E7 60m Oct 18th
/KC coffee appears poised to rally on a solid break above the minor downtrend line & the 0.95ish resistance level.
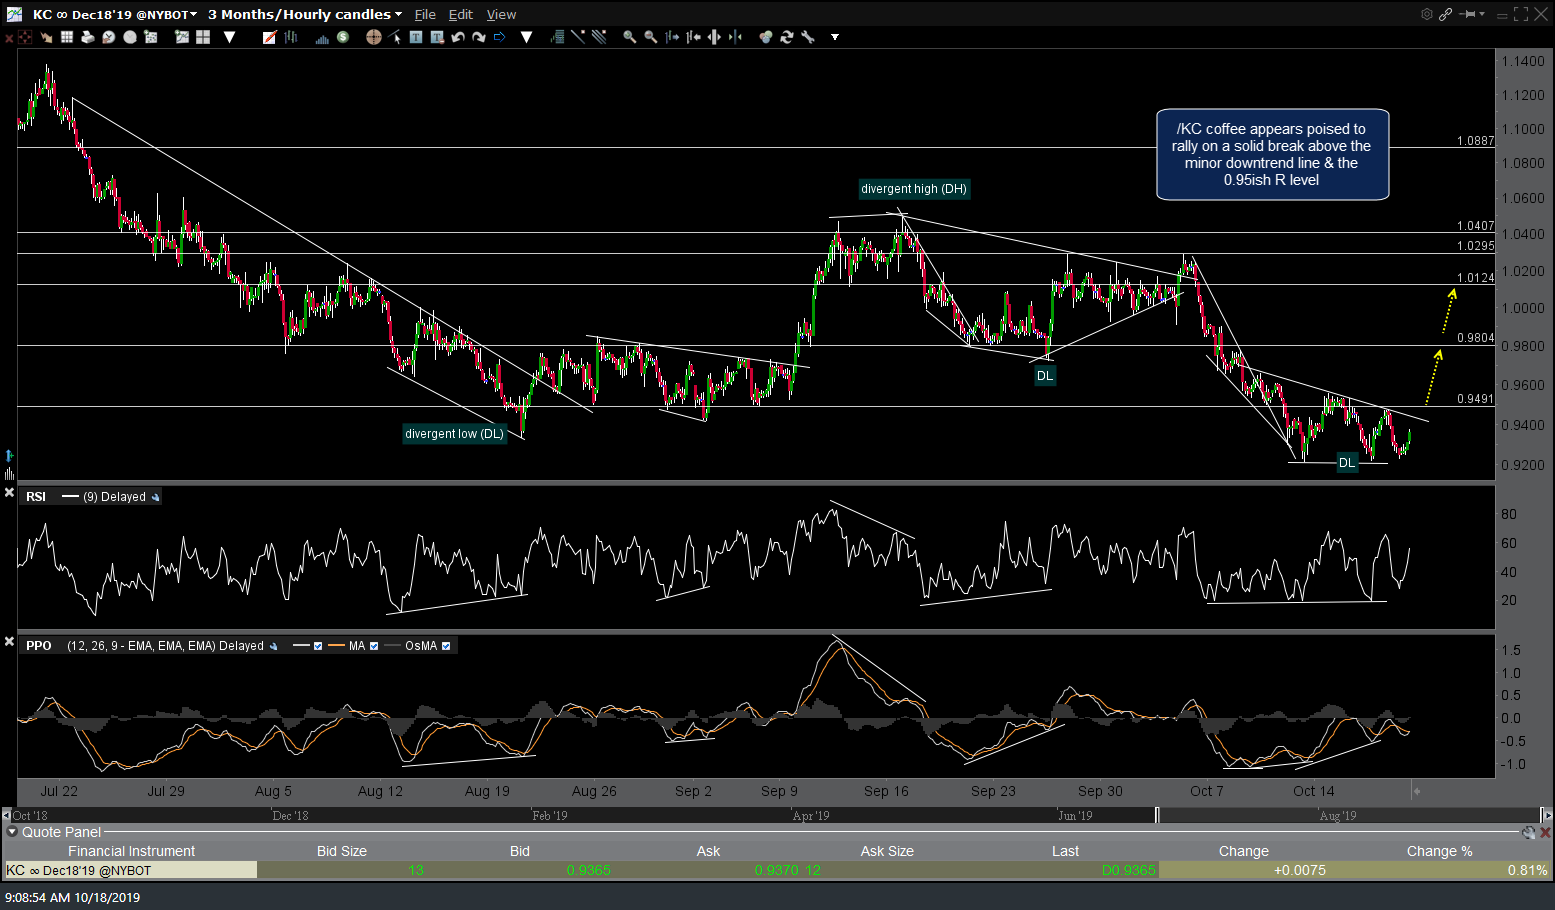
KC 60m Oct 18th
/GC gold continues to consolidate in a large mostly sideways range since early Aug. Although prices have been erratic with numerous whipsaw signals (typical during a consolidation period), the next near-term direction could be determined by a break above or below the yellow triangle pattern with a second buy signal on a break above the blue downtrend line.
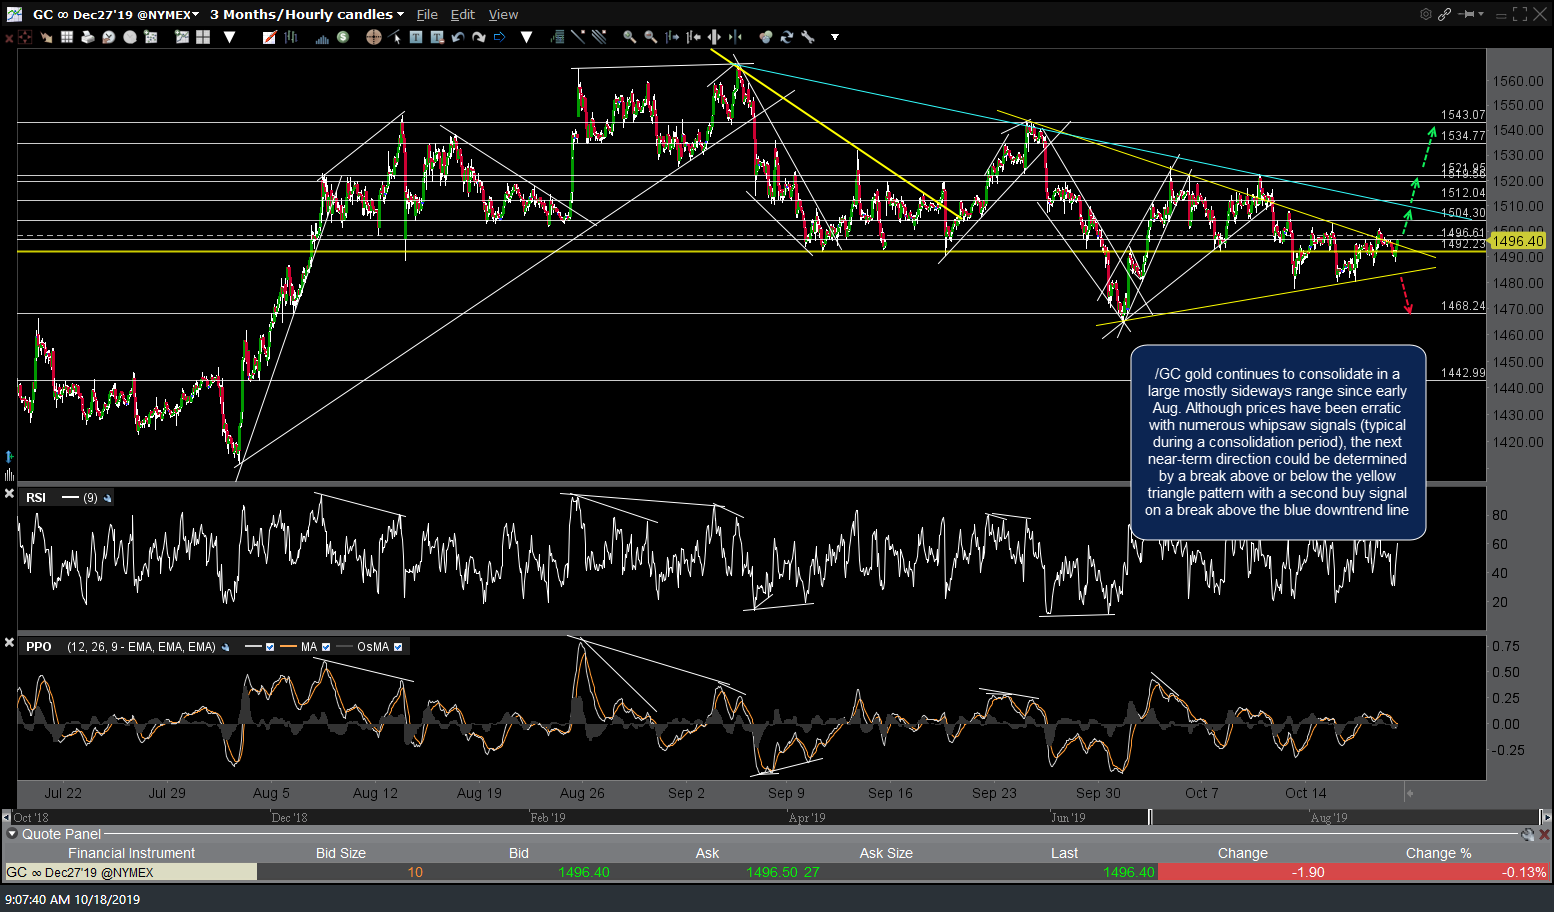
GC 60m Oct 18th