
Yesterday’s follow-up red candle helps to confirm Wednesday’s questionable breakdown in XLK (tech sector ETF), increasing the odds of more downside in the coming days to weeks although those odds were increase further if XLK was to print a solid red close today, ideally with impulsive selling which has been lacking since Wednesday’s breakdown.
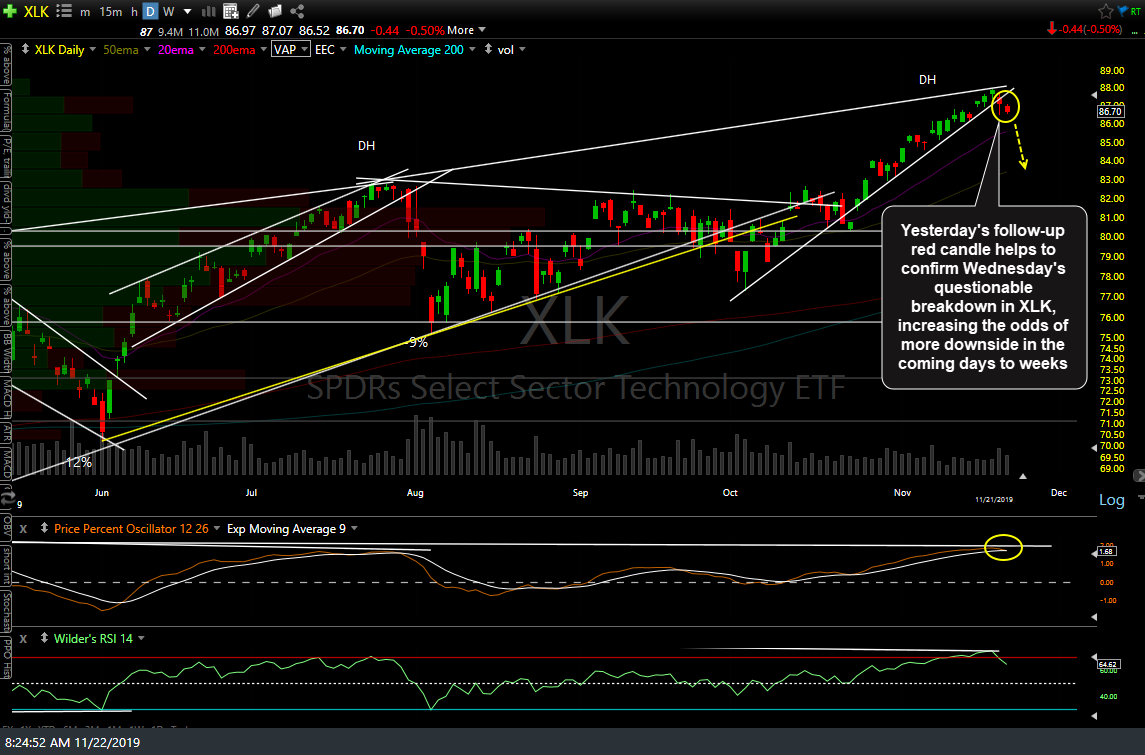
XLK daily Nov 21st close
A second red candle yesterday also helps to confirm Wednesday’s breakdown in XLF (financial sector ETF) although we still need to see both XLV (healthcare) & XLC (communications) also break below their respective uptrend lines in order to trigger sell signals on all of the top 4 sectors in the S&P 500.
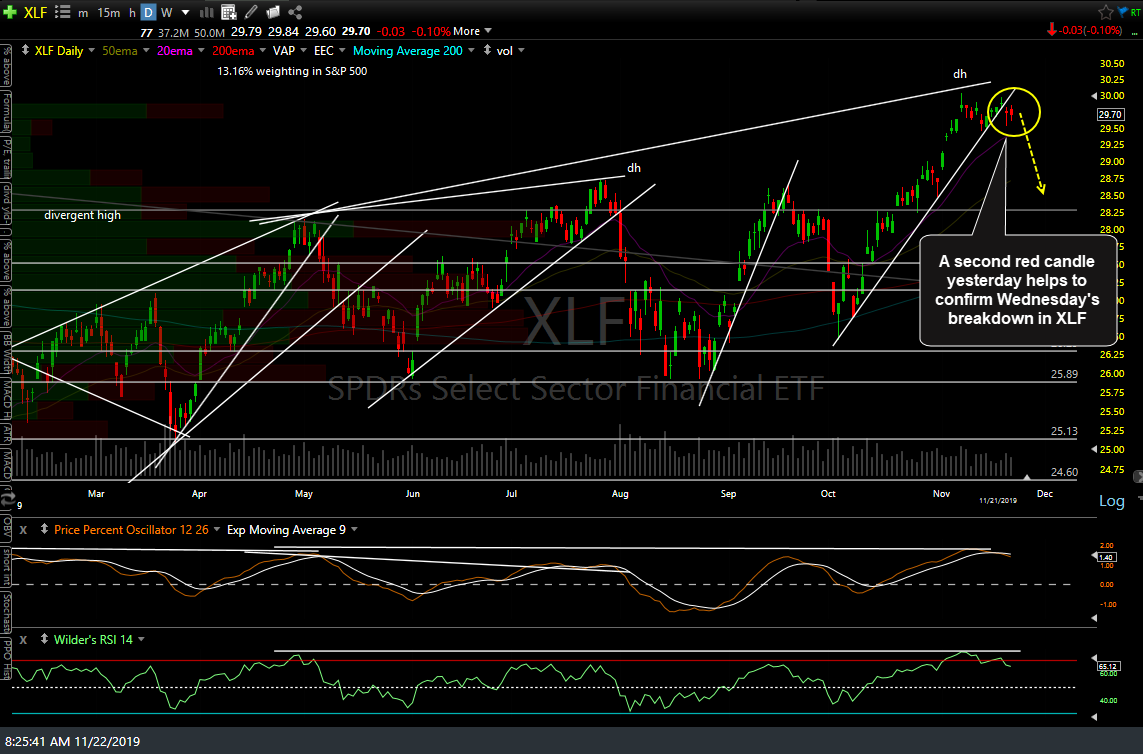
XLF daily Nov 21st close
Awaiting & favoring a break below this 60-minute triangle on /NQ to spark a leg down to the 8200 support level & likely beyond.

NQ 60m Nov 22nd
Sell signal on /ES still pending a break below both of these 60-minute uptrend lines.
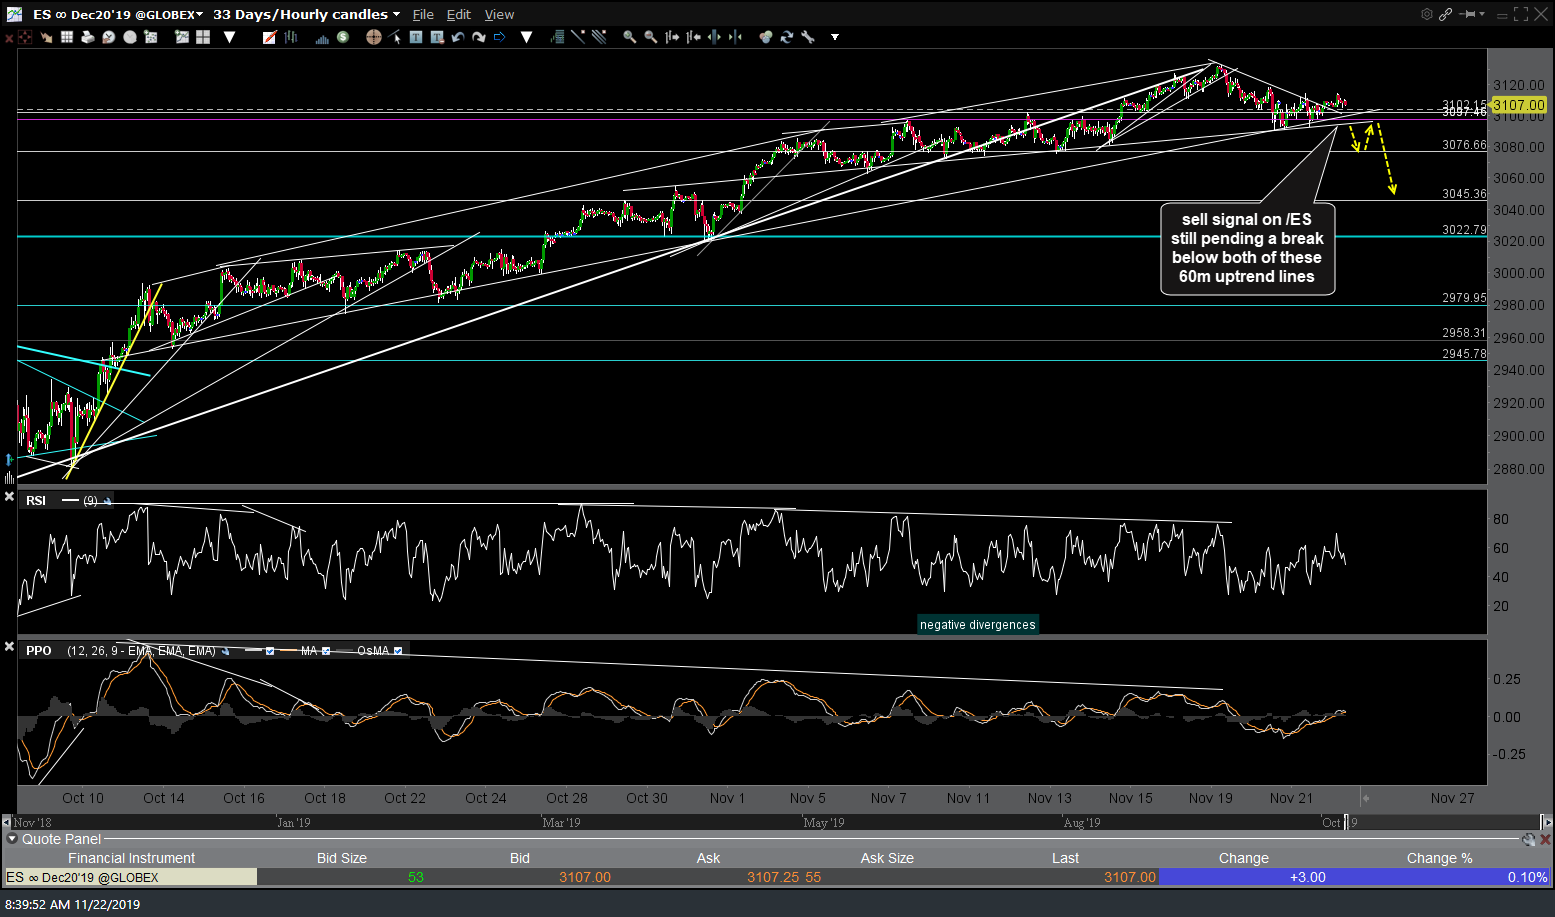
ES 60m Nov 22nd
/NG natural gas is approaching the 2.658 target with a break above that level likely to spark the next wave of buying.
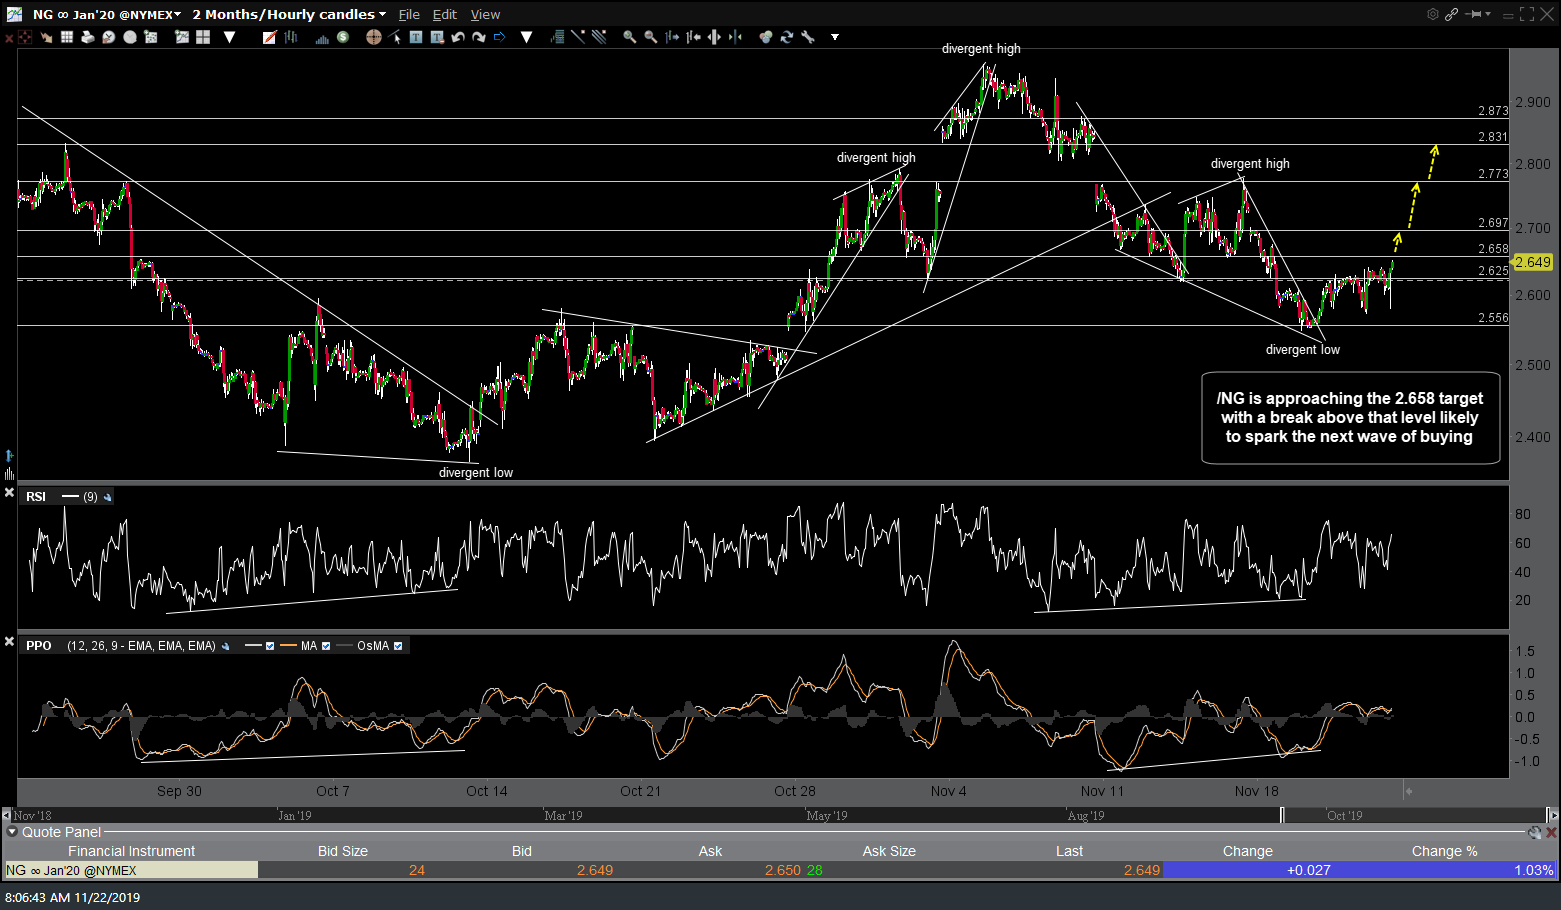
NG 60m Nov 22nd
/ZS soybeans approaching the the 895ish support, where a reversal is likely, as the bullish divergences continue to build.
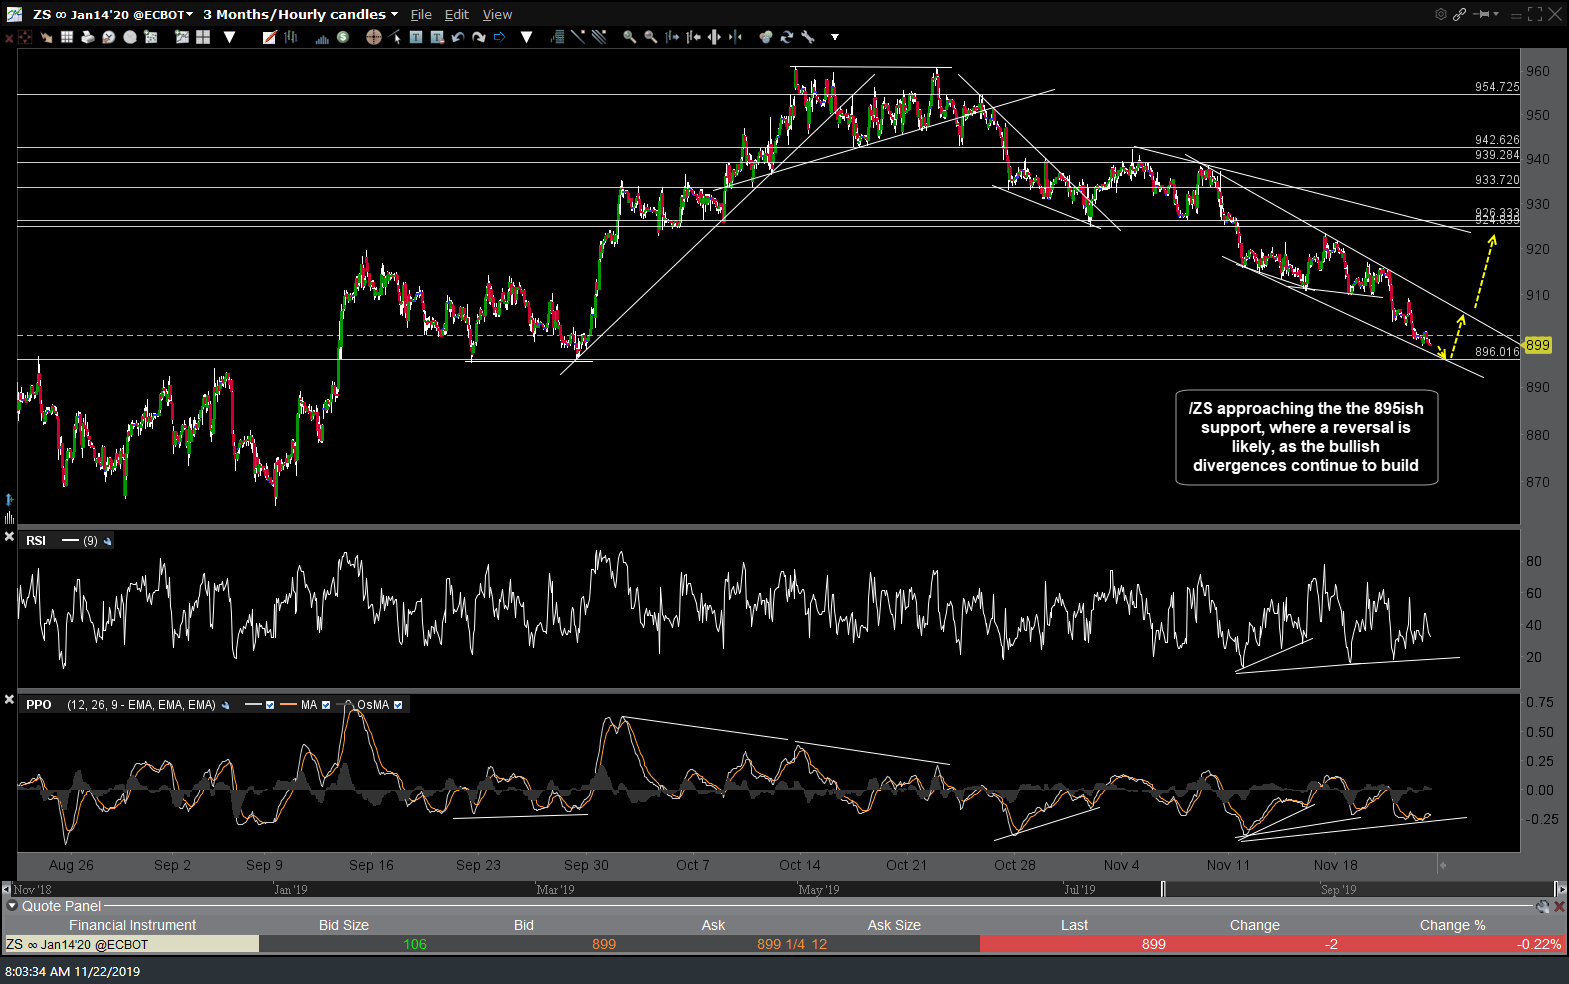
ZS 60m Nov 22nd
As per yesterday’s post-market video, the odds for a pullback in MJ & the cannabis stocks are quite elevated today and/or into early next week.

MJ daily Nov 21st close
As always, any of the charts related to the securities covered in this post (e.g.- UGAZ, SOYB, QQQ, etc.) can be quickly referenced by clicking on the symbol tag located below this post. Clicking on a symbol tag will load all home page post related to that security starting with the most recent.