Let’s start with a few fundamental items that have the potential to move the market the remainder of this week & then we’ll roll into the technicals (charts). The following reports can be clicked to view details.
- Durable Goods Orders at 8:30 am EST today
- Jobless Claims at 8:30 am EST today
- New Home Sales at 10 am EST today
- Natural Gas Inventories (for those trading /NG, UGAZ, etc.) at 10:30 EST today
- AMZN (Amazon), INTC (Intel) & V (Visa) report earnings after the market close today
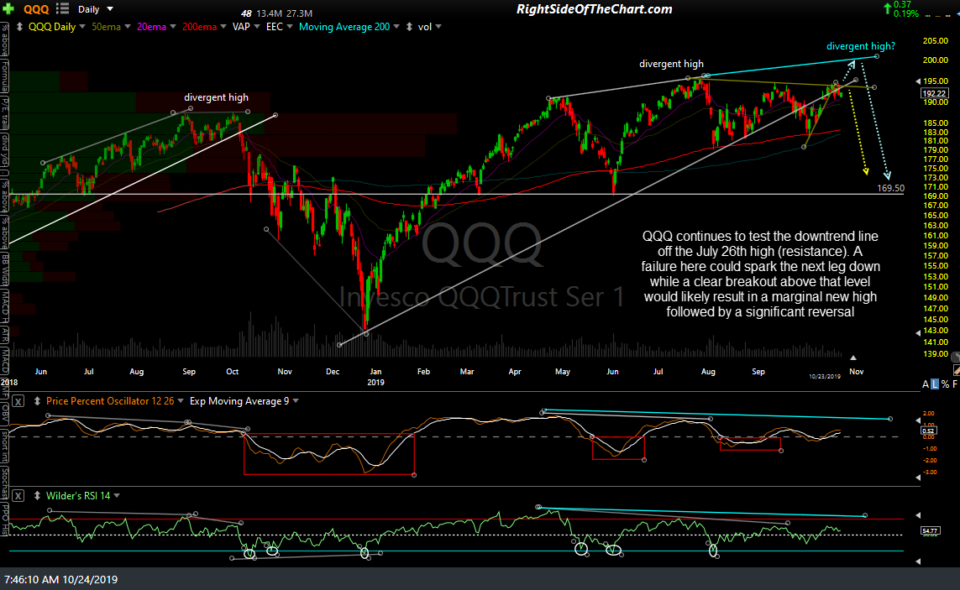
From a technical perspective, with QQQ closing yesterday right at its April highs (i.e.- trading up & down but essentially going nowhere), nothing has changed for months now. The previous all-time high back in July was a divergent high, which was followed by a correction & with QQQ within striking distance of that previous high with the momentum indicators continuing to lag behind prices, any marginal new high soon would simply extend the negative divergences that have been building since the late April highs.
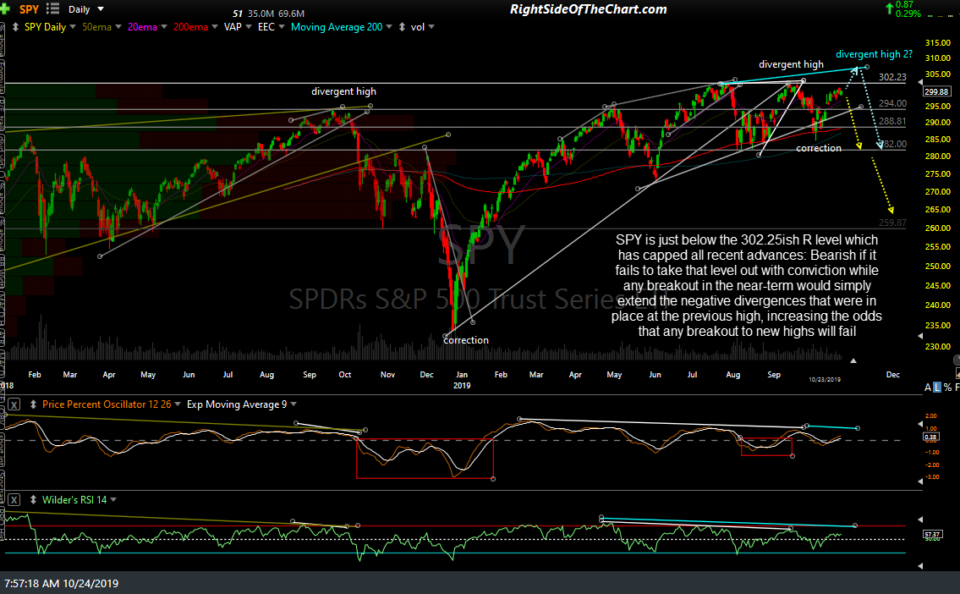
Likewise, SPY is just below the 302.25ish R level which has capped all recent advances: Bearish if it fails to take that level out with conviction while any breakout in the near-term would simply extend the negative divergences that were in place at the previous high, increasing the odds that any breakout to new highs will fail.
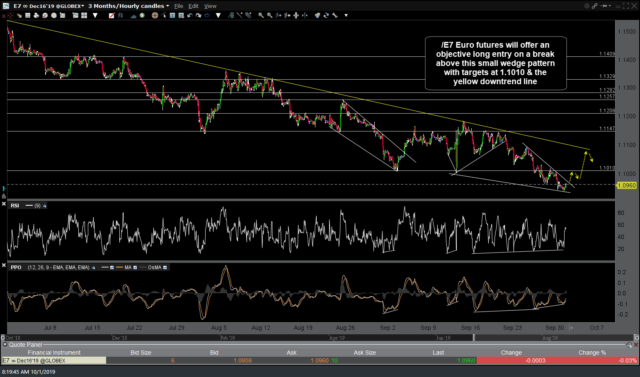
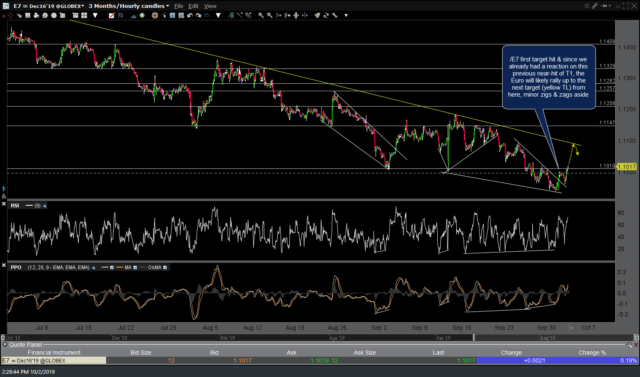
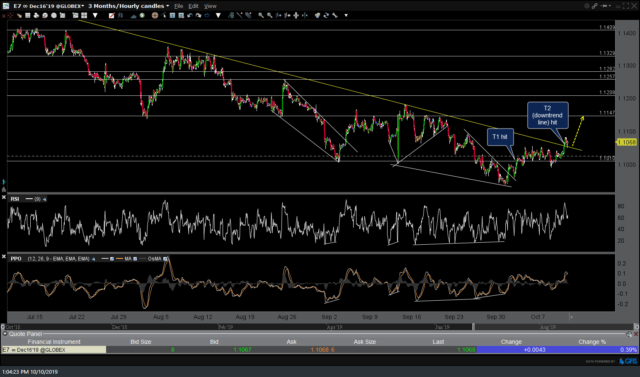
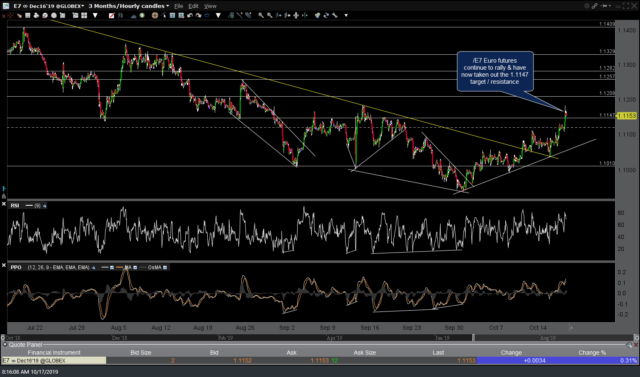
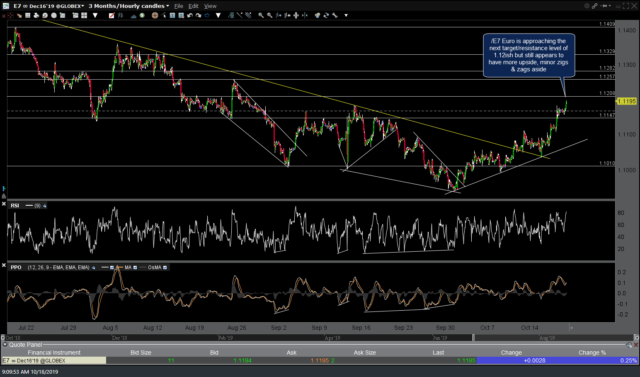
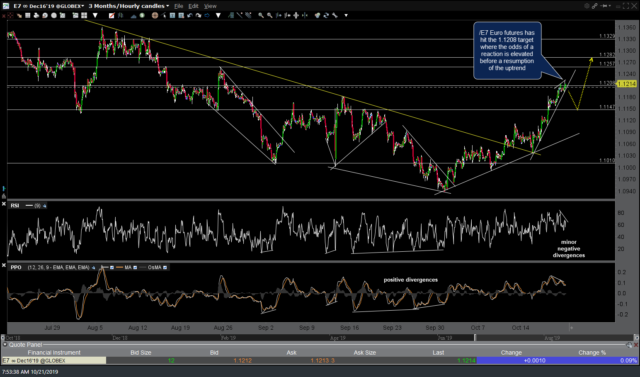
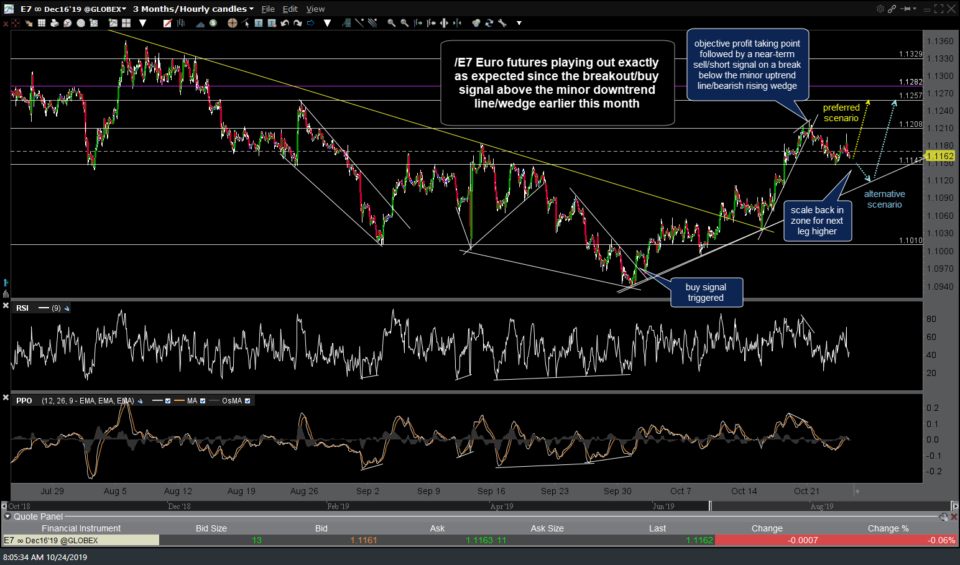
The Euro continues to play out exactly as predicted, including the most recent call for a pullback off the 1.12ish resistance level back down to the 1.1147 level, offering an objective spot to book profits at the 1.1208 target and either reverse to short for a pullback to the 1.1147 level and/or recycle back in long again at that level for the next leg up to the 1.1257ish target. /E7 (or FXE or UDN) once again offers an objective long entry/re-entry here just above the 1.1147 level and/or a scale in here down to but not below the uptrend line off the Sept 30th low. Previous & updated 60-minute charts. Click on first chart to expand, then click on right of each chart to advance.
- E7 60m Oct 1st
- E7 60m Oct 2nd
- E7 60m Oct 10th
- E7 60m Oct 17th
- E7 60m Oct 18th
- E7 60m Oct 21st
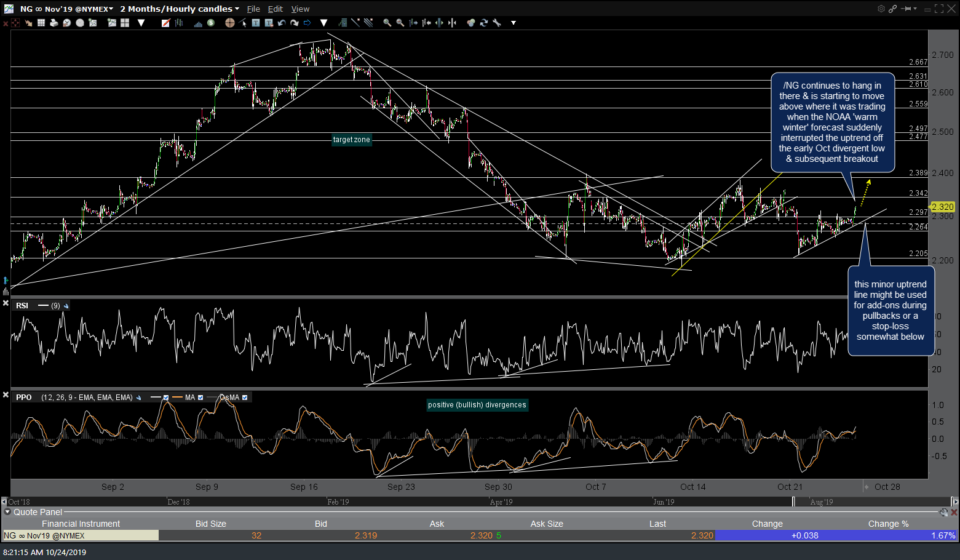
/NG continues to hang in there & is starting to move above where it was trading when the NOAA ‘warm winter’ forecast suddenly interrupted the uptrend off the early Oct divergent low & subsequent breakout. This minor uptrend line might be used for add-ons to /NG or UGAZ during pullbacks or a stop-loss somewhat below. 60-minute chart.
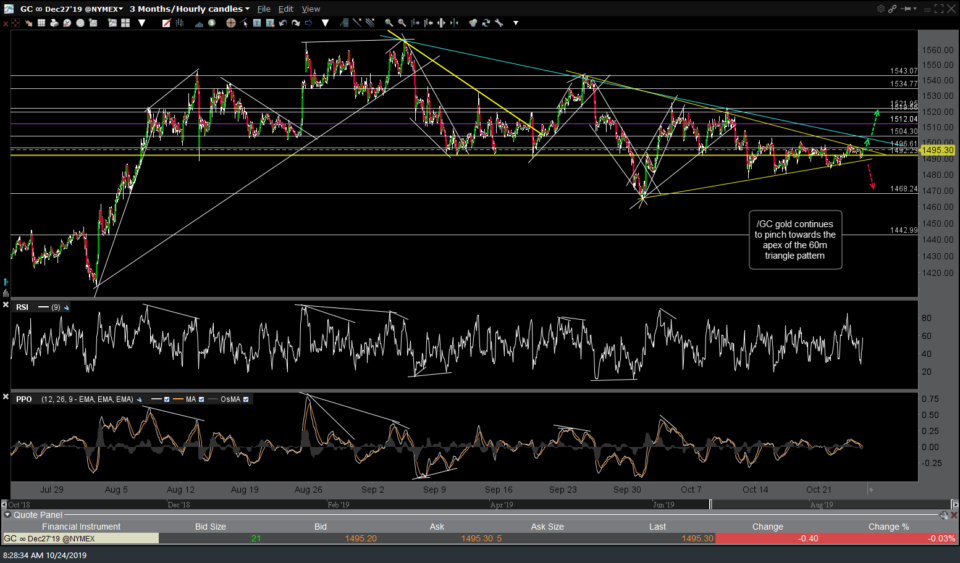
/GC gold continues to pinch towards the apex of the 60m triangle pattern. Still on watch for a convincing upside or downside break to provide some clues at to the next trend in gold.
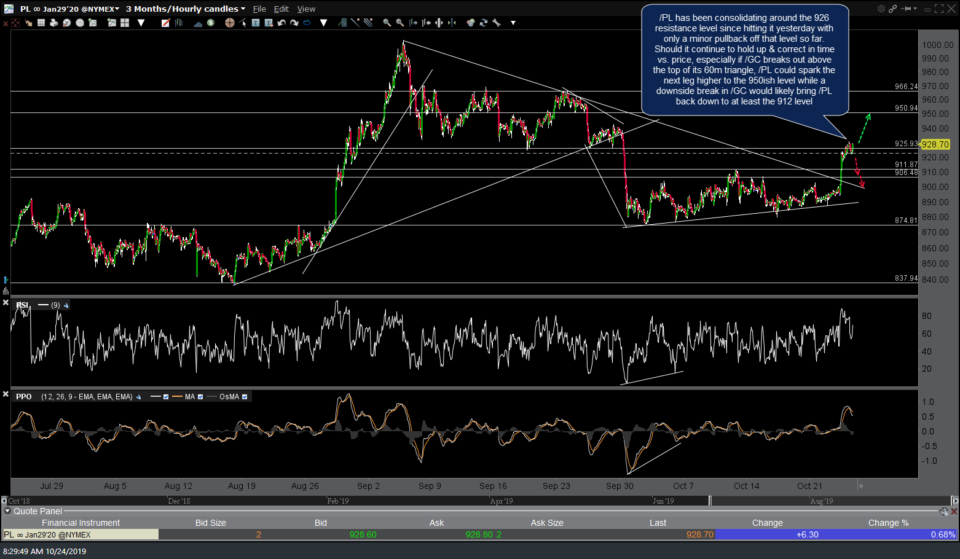
/PL platinum has been consolidating around the 926 resistance level since hitting it yesterday with only a minor pullback off that level so far. Should it continue to hold up & correct in time vs. price, especially if /GC breaks out above the top of its 60m triangle, /PL could spark the next leg higher to the 950ish level while a downside break in /GC would likely bring /PL back down to at least the 912 level. 60-minute chart:
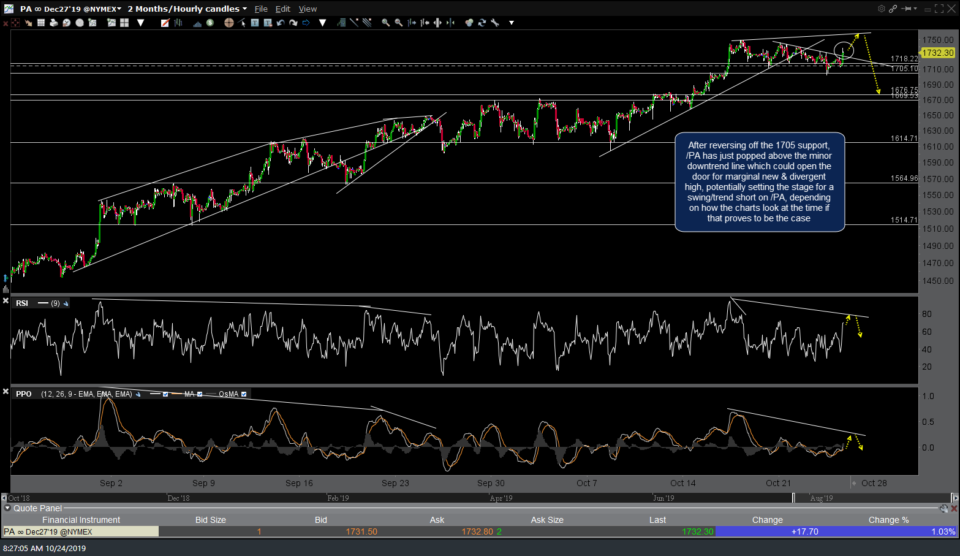
After reversing off the 1705 support, /PA has just popped above the minor downtrend line which could open the door for marginal new & divergent high, potentially setting the stage for a swing/trend short on /PA, depending on how the charts look at the time if that proves to be the case. BTW- Should gold, platinum and/or palladium rally from here, silver (/SI or SLV) appears poised to play a game of catch-up (i.e.- potentially outperform). 60-minute chart of /PA below:


