
I spent the bulk of yesterday working on the back-end of the site & as of yesterday, all of the Long Trade ideas have been updated. The charts on all 4 trades currently listed under the Active Long Swing Trade category (ACBFF, WEAT, NIB & CCE) all still look constructive & all of those trades are profitable at this time. I hope to have all of the Short Trade Ideas updated by the end of the week. Gold members should also remember to check the various trade groups within the trading room (e.g.- Swing Trading, Growth & Income Investing, etc..) occasionally for unofficial trade ideas, such as GPRO which was posted as an unofficial long trade idea on Tuesday while trading at 7.26. The 60-minute & daily bullish divergences are starting to play out with the stock gapping higher today, trading as high as 8.28 so far (a 14% gain) and close to the bounce target of the 8.64 area. 60-minute chart with additional targets/resistance levels was posted in the trading room right after the open.
-

- SPY 60-min March 16th
-

- QQQ 60-min March 16th
-

- IWM 60-min March 16th
Regarding the broad market, despite a relatively run-of-the mill rally yesterday with the broad market (S&P 500) closing the day up 0.84%, I can’t find anything even remotely significant (other than a new high in only one index, $NDX) that changed the technical picture & outlook for the US stock market. The charts above are the 60-minute charts of the 3 major index tracking ETFs that I follow closely; SPY, QQQ & IWM. Essentially, 2 of the 3 are still well off their recent divergent highs with the extremely top-heavy (component-wise) and tech-heavy QQQ eking out a marginal new high yesterday, albeit with negative divergence still in place.
Worth noting & further evidence of the fact that only a handful of mega-cap tech stocks are doing most of the heavy lifting recently is the fact that the Nasdaq Composite is still trading below its March 1st peak, as are all other major diversified US stock indices. While the markets may or may not follow through to yesterday’s FOMC rally, and I would once again caution anyone from trying to extrapolate how the market trades in the wake of an important FOMC meeting. At this time, the recent 2-day rally in the US stock market appears to be nothing more than a near-term oversold bounce, as the market have been in a near-term downtrend since peaking on March 1st.
Worth noting & further evidence of the fact that only a handful of mega-cap tech stocks are doing most of the heavy lifting recently is the fact that the Nasdaq Composite is still trading below its March 1st peak, as are all other major diversified US stock indices. While the markets may or may not follow through to yesterday’s FOMC rally, and I would once again caution anyone from trying to extrapolate how the market trades in the wake of an important FOMC meeting, at this time, the recent 2-day rally in the US stock market appears to be nothing more than a near-term oversold bounce, as the market have been in a near-term downtrend since peaking on March 1st.
-
- QQQ 10-min March 16th

-
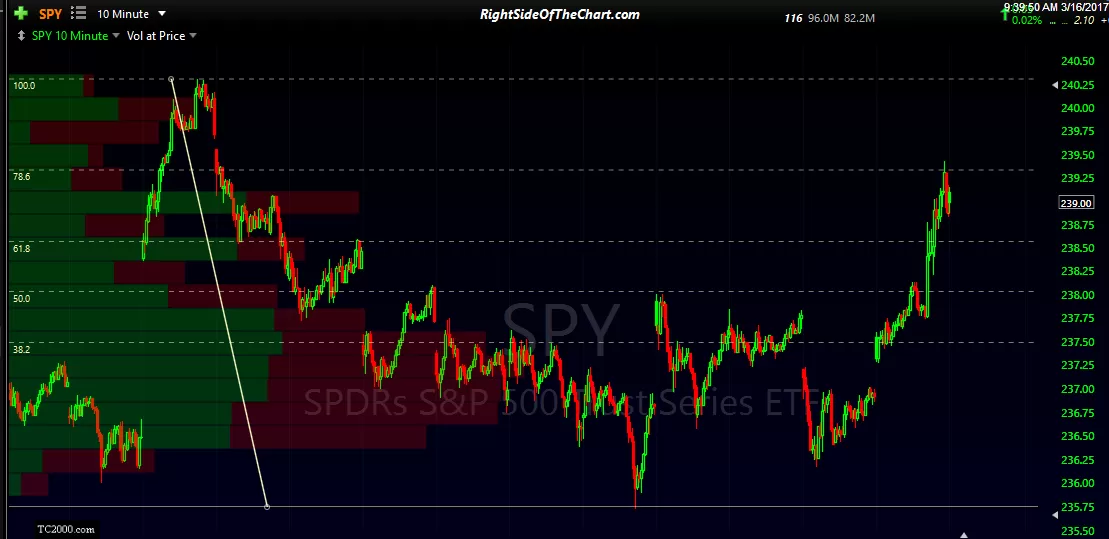
- SPY 10-min March 16th
-
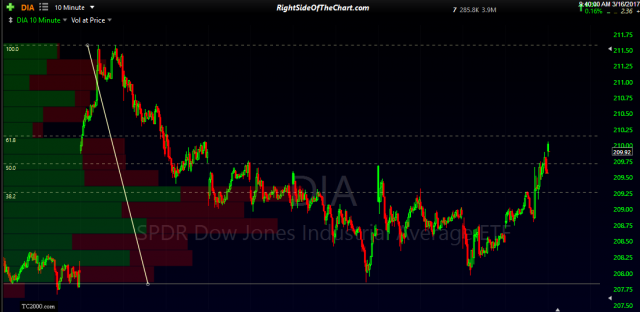
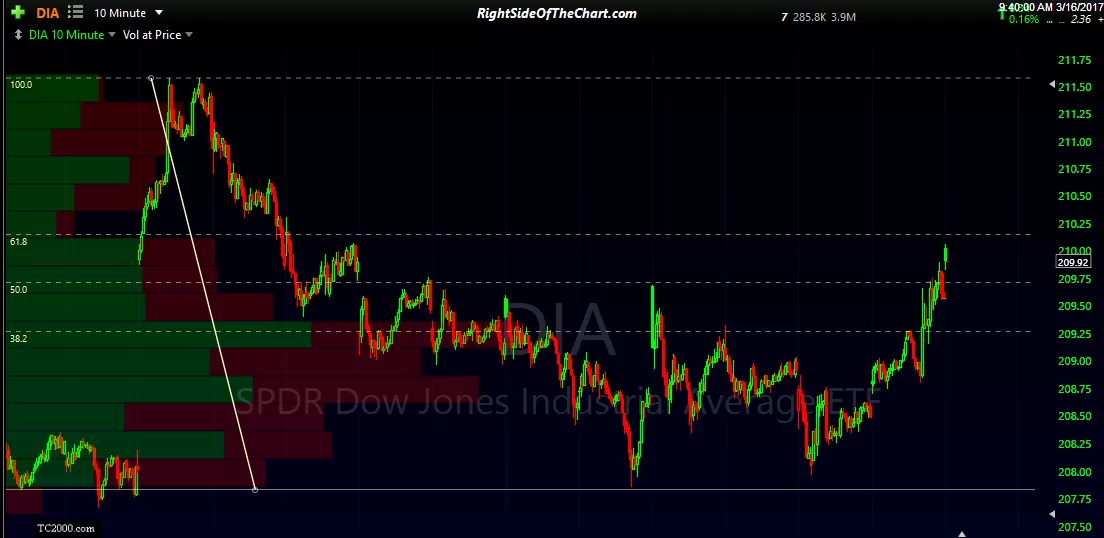
- DIA 10 min March 16th
-
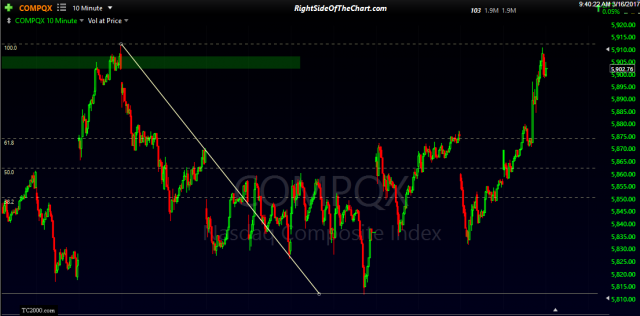
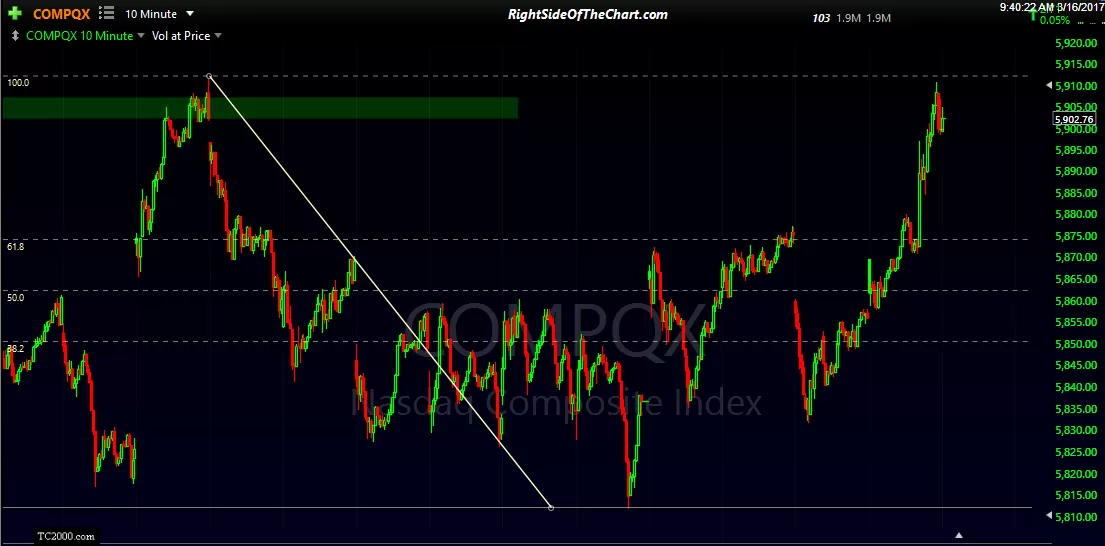
- $COMPQ 10-min March 16th
-

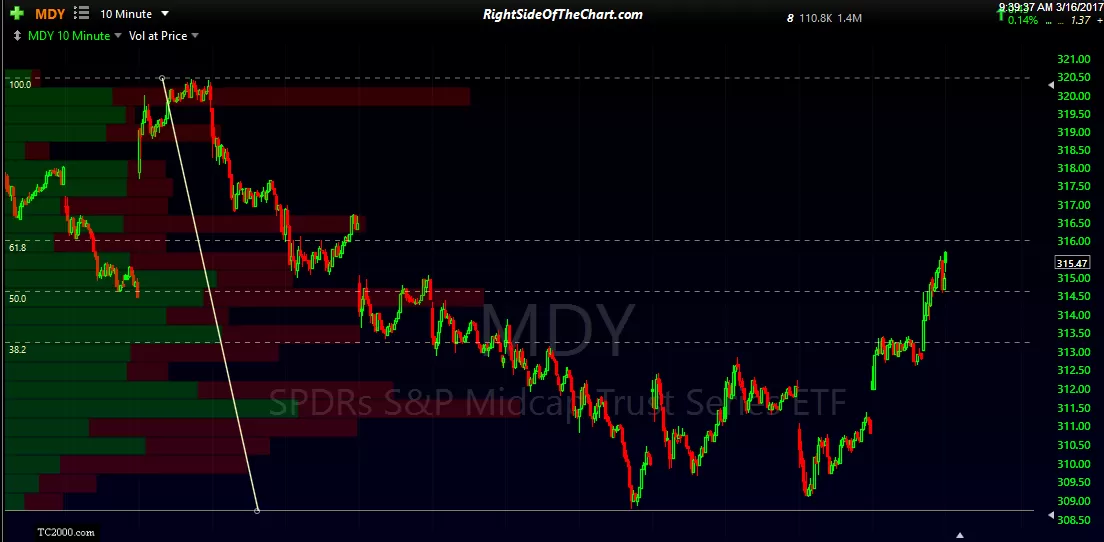
- MDY 10-min March 16th
-

- IWM 10-min March 16th
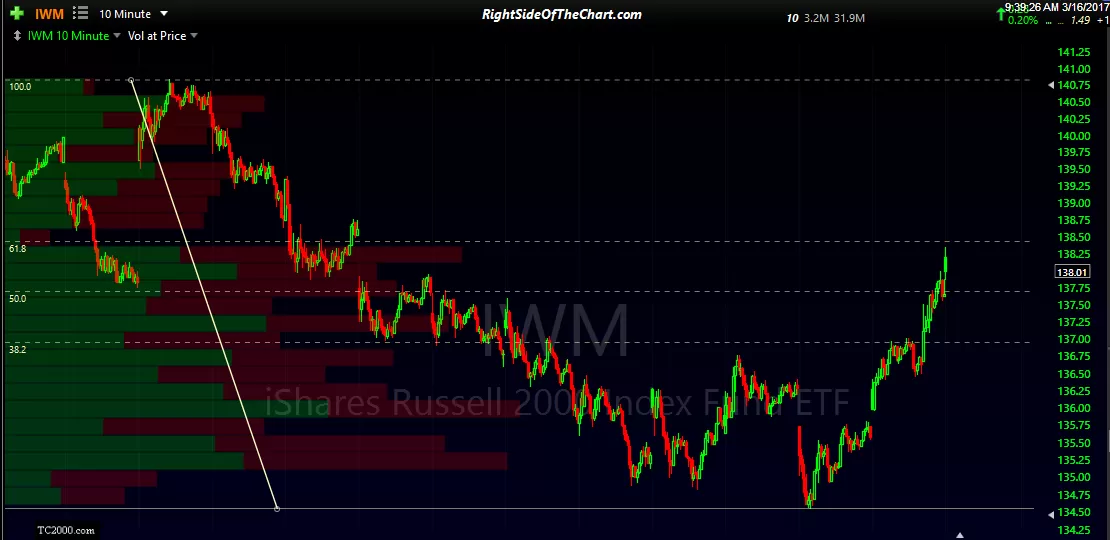
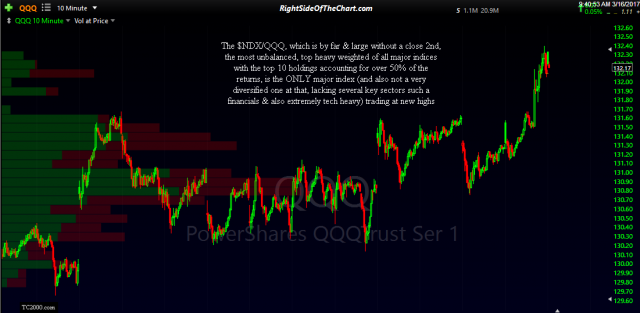
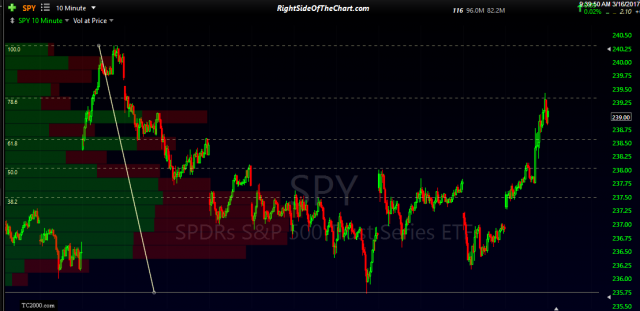
The 10-minute period charts above illustrate that the Nasdaq 100, which is by far & large without a close 2nd, the most unbalanced, top heavy weighted of all major indices with the top 10 holdings accounting for over 50% of the returns, is the ONLY major index (and also not a very diversified one at that, lacking several key sectors such a financials & also extremely tech heavy) trading at new highs. Those charts above are the major US stock indices shown in order of market cap (large-cap to small cap). Also note how the recent bounce in all but the tech heavy Nasdaq Composite & Nasdaq 100 has so far only been to Fibonacci retracement levels which are typical retracement levels during a counter-trend bounce. Again, the post-FOMC noise should start to abate sometime today with the market soon choosing its next likely path, whether that will be to the upside & new highs among all the major stock indices or a continuation of the downtrend that kicked off on the first day of this month.