
/DX (US Dollar Index futures) has rallied since Friday’s breakout to hit my first price target & resulting in a corresponding drop in the stock futures. 60-minute chart below.
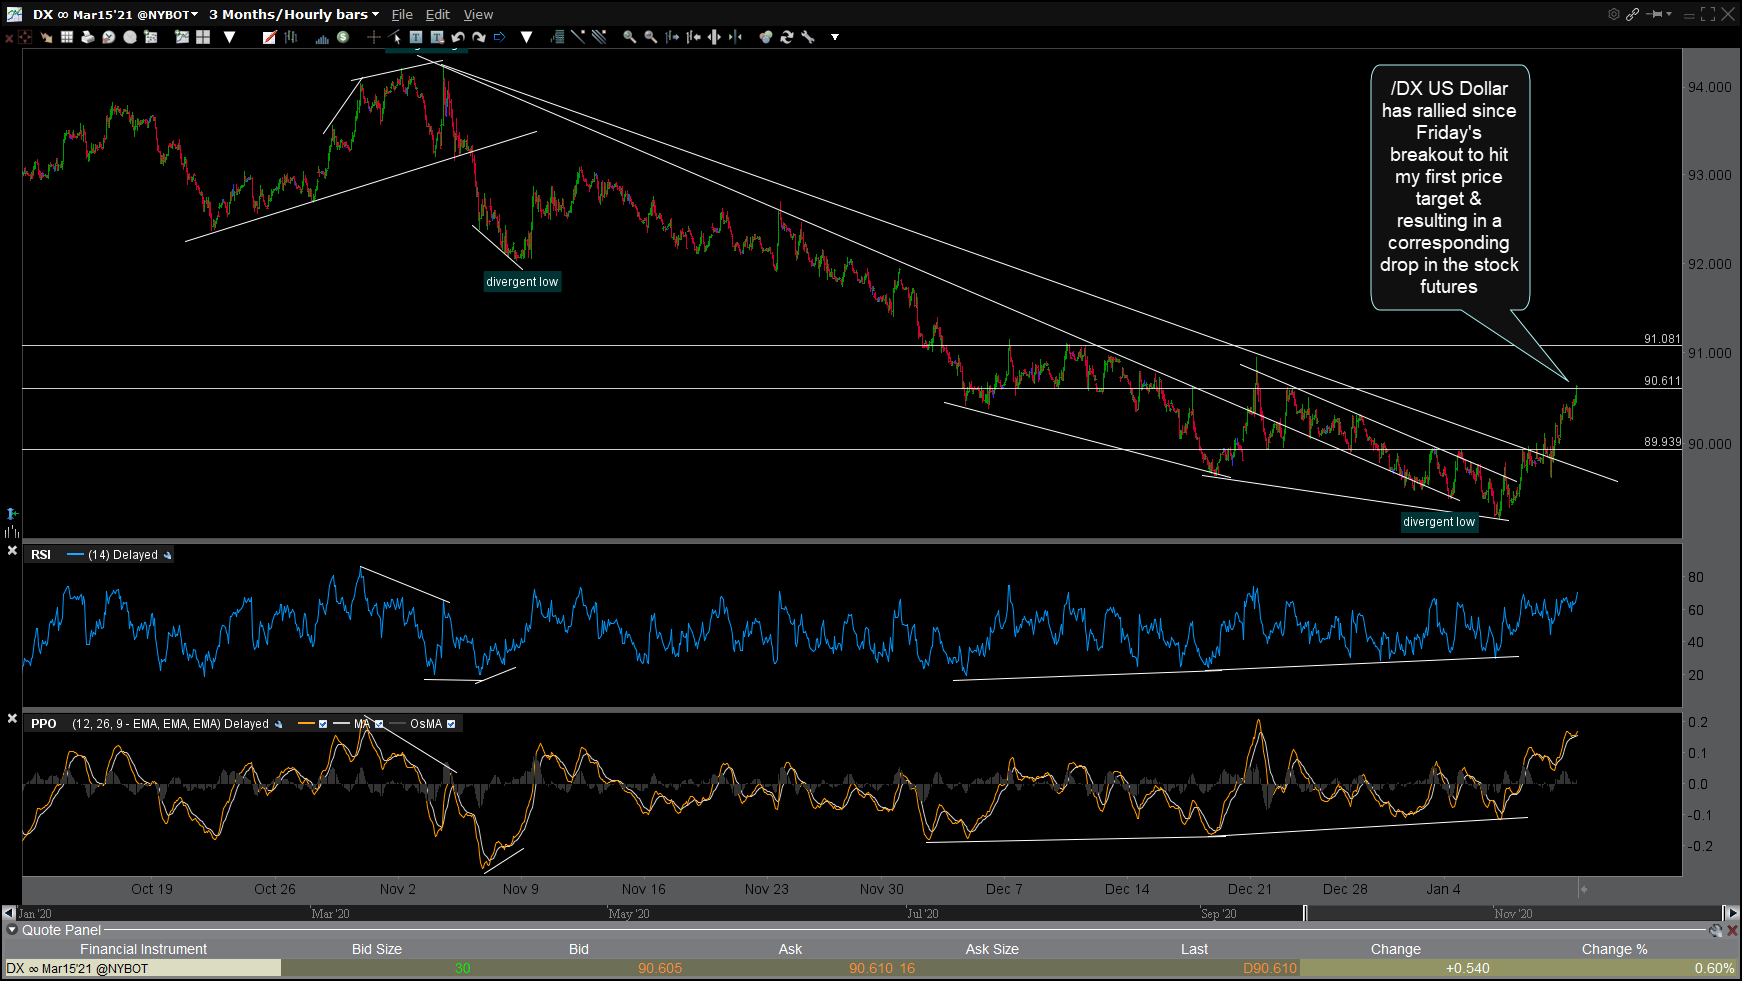
DX 60m Jan 11th
As highlighted in recent videos, this chart of the S&P 500 (white line) plotted with the inverse $USD ETN, UDN (green/red candles) shows the strong positive correlation between the stock market & US Dollar & helped us get a head start to the overnight & early-session drop in the stock futures.
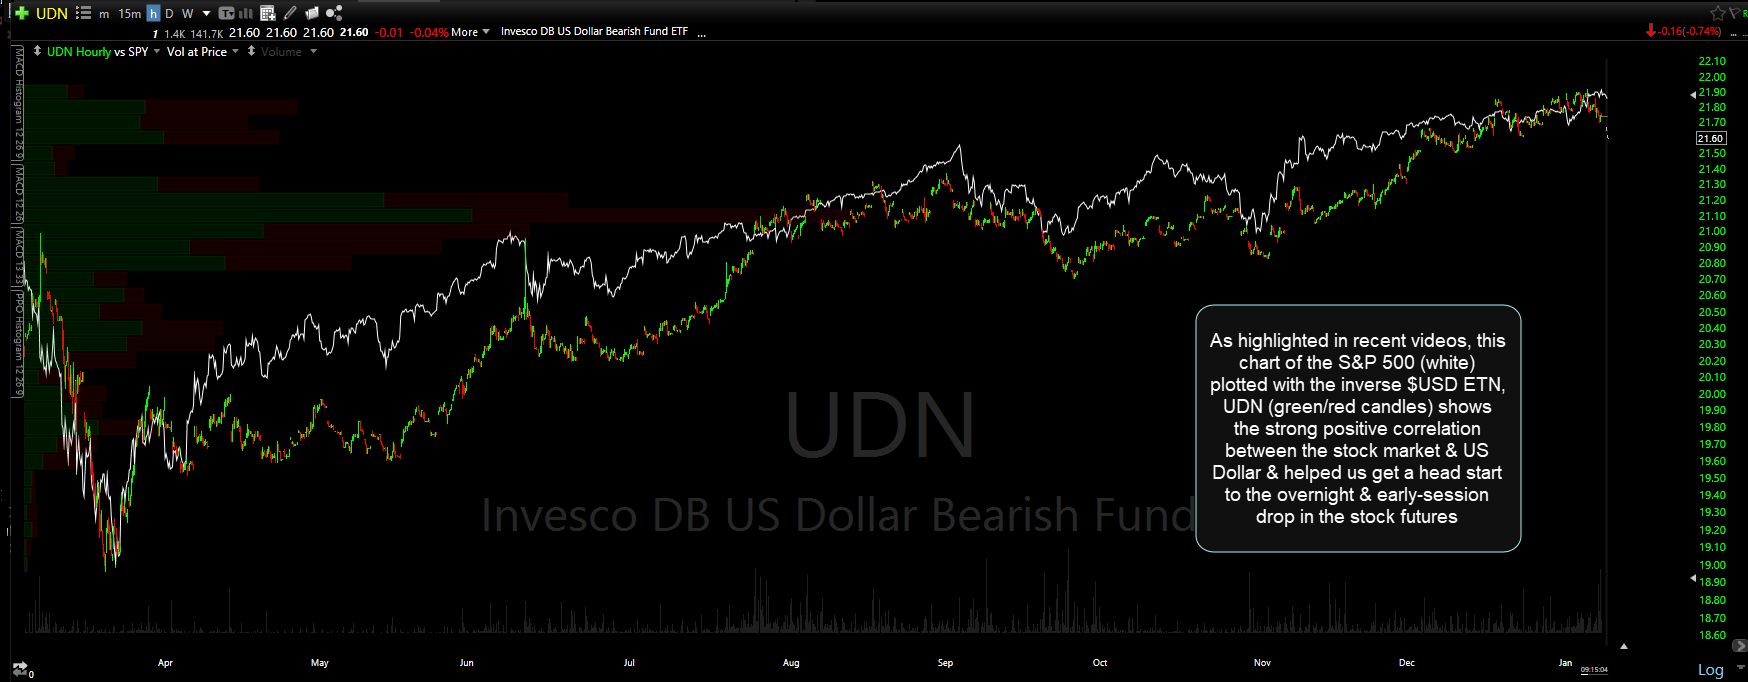
SPY vs UDN Jan 11th
As the US Dollar futures have just hit my first target (resistance) with the stock market regular session poised to open shortly, we could get a reaction in the $USD which could result in some dip-buying at the open as the major indices are currently poised for a substantial gap down at the open. Regardless of how the equity markets trade today, the price action since Friday’s breakout in the US Dollar (and corresponding breakdown in the Euro) has been impulsive so far, helping to confirm those breakouts & increase the odds of a trend change in those currencies which could last for weeks or even months. Should that prove to be the case, that will most likely put pressure on the stock market & other Dollar sensitive assets such as crude oil & gold.