
As we head into the new trading month, /NQ (Nasdaq 100 futures) & QQQ remain above their respective minor uptrend lines with a sell signal pending a solid break and/or 60-minute close below while /ES (S&P 500 futures) & SPY remain slightly below their comparable 60-minute trendlines following yesterday’s unimpulsive breakdowns. With the $VIX recently breaking out & steadily inching higher since, it appears that a breakdown in the tech-heavy Nasdaq 100 is both likely & imminent at this time although as I like to say, support is support until & unless broken.
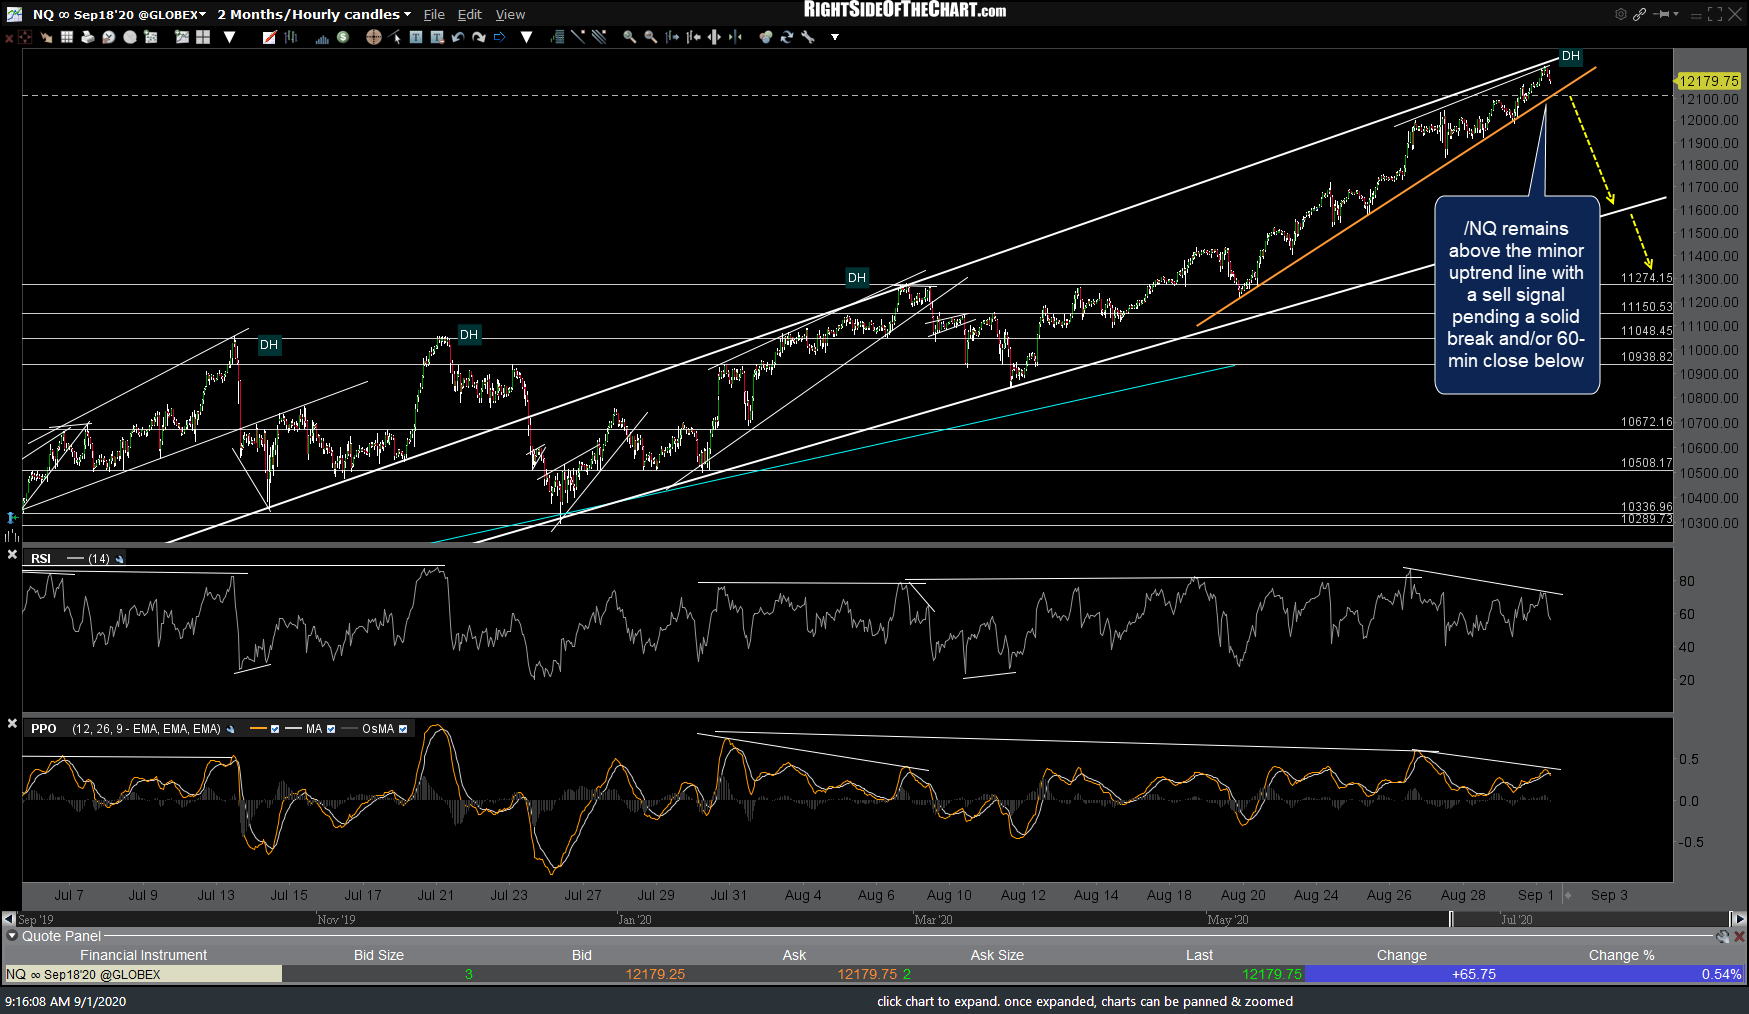
NQ 60m Sept 1st
GLD (gold ETF) continues to consolidate around the long-term resistance zone for the 6th consecutive week on the weekly timeframe.

GLD daily Sept 1st
Zooming down to the 60-minute timeframe, /GC (gold futures) is testing the 1997 resistance following the last bounce off the 60-minute uptrend line.

GC 60m Sept 1st
EUR/USD (Euro-US Dollar forex pair) continues to chop around while at long-term resistance on the weekly chart (not shown on the daily chart below), wedging higher between the 1.20943 resistance level & uptrend line support just below, with a sell signal to come on a solid break below the trendline.
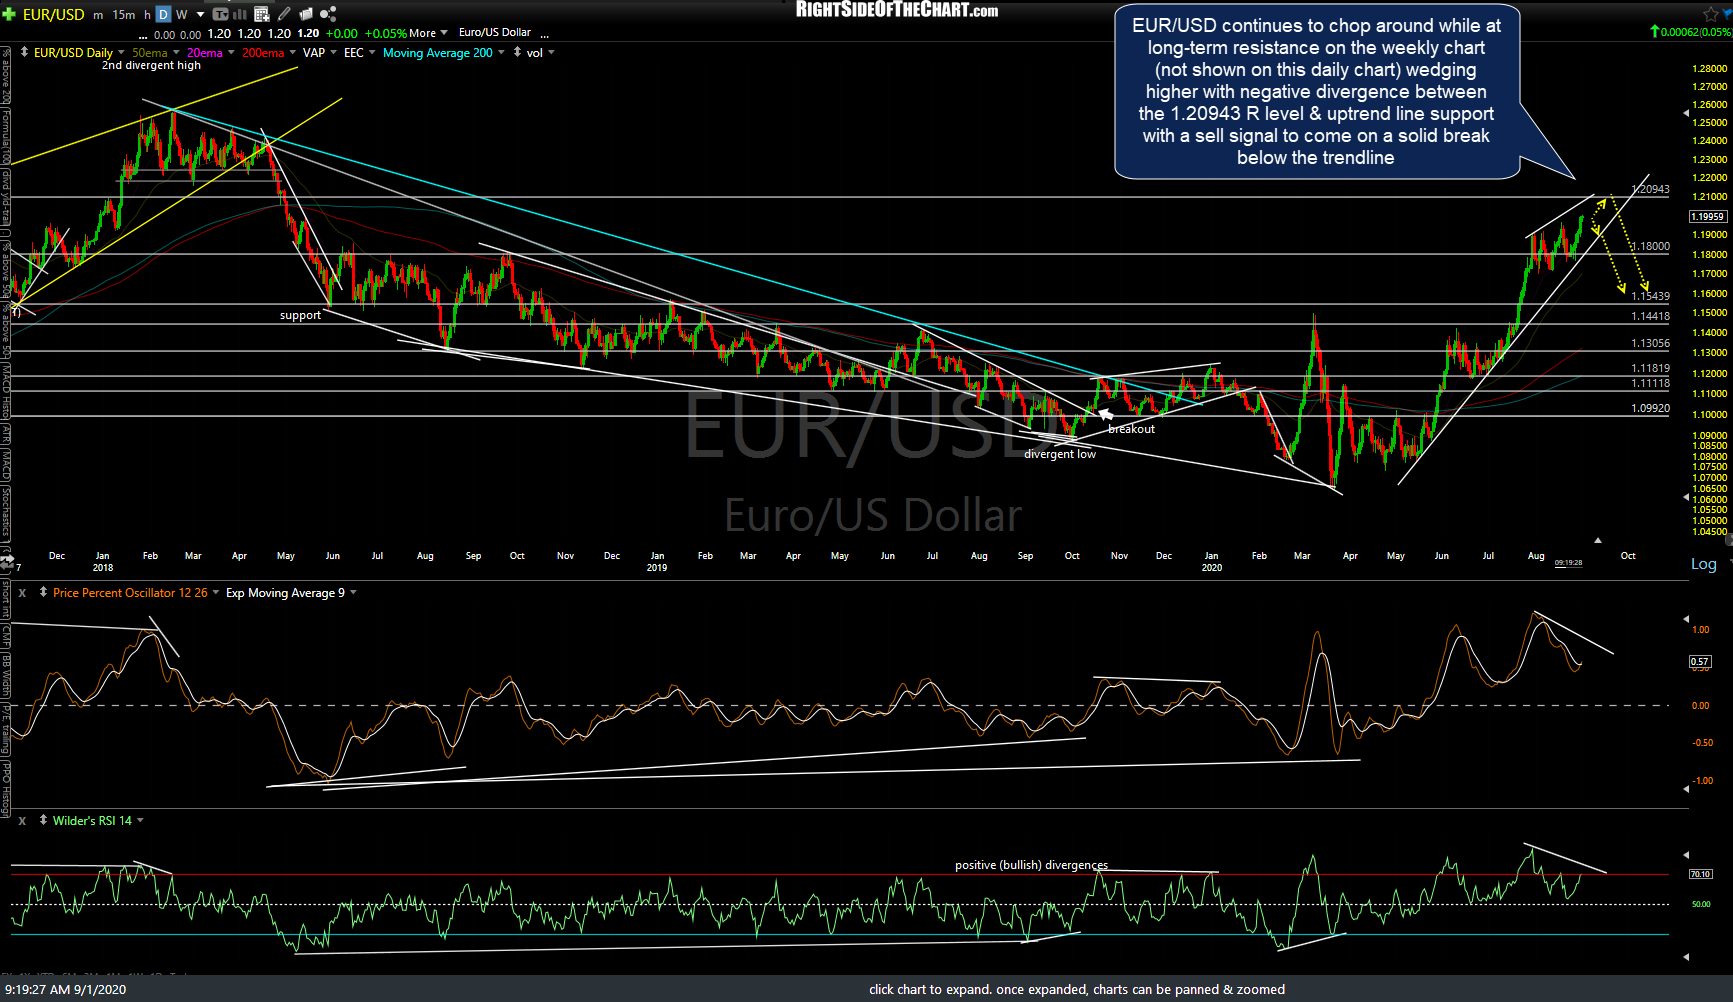
EUR-USD daily Sept 1st
Zooming down to the 60-minute time frame, the positive (bullish) divergences continue to build as /DX ($USD futures) puts in a marginal new low within this bullish falling wedge pattern with a buy signal still pending a solid break & close above the downtrend line. A rising Dollar (and falling Euro) is generally bearish for gold.

DX 60m Sept 1st