
I’ve slightly tweaked the uptrend line to the /NQ 60-minute rising wedge pattern, with /NQ testing that support level now & a near-term sell signal still to come on a break below it although the trend remains bullish until & unless we get a convincing breakdown below that wedge.

NQ 60m Nov 6th
I’ve also modified the upper (divergence) trendline along with the lower uptrend line on /ES with a near-term pullback target of 3023ish.
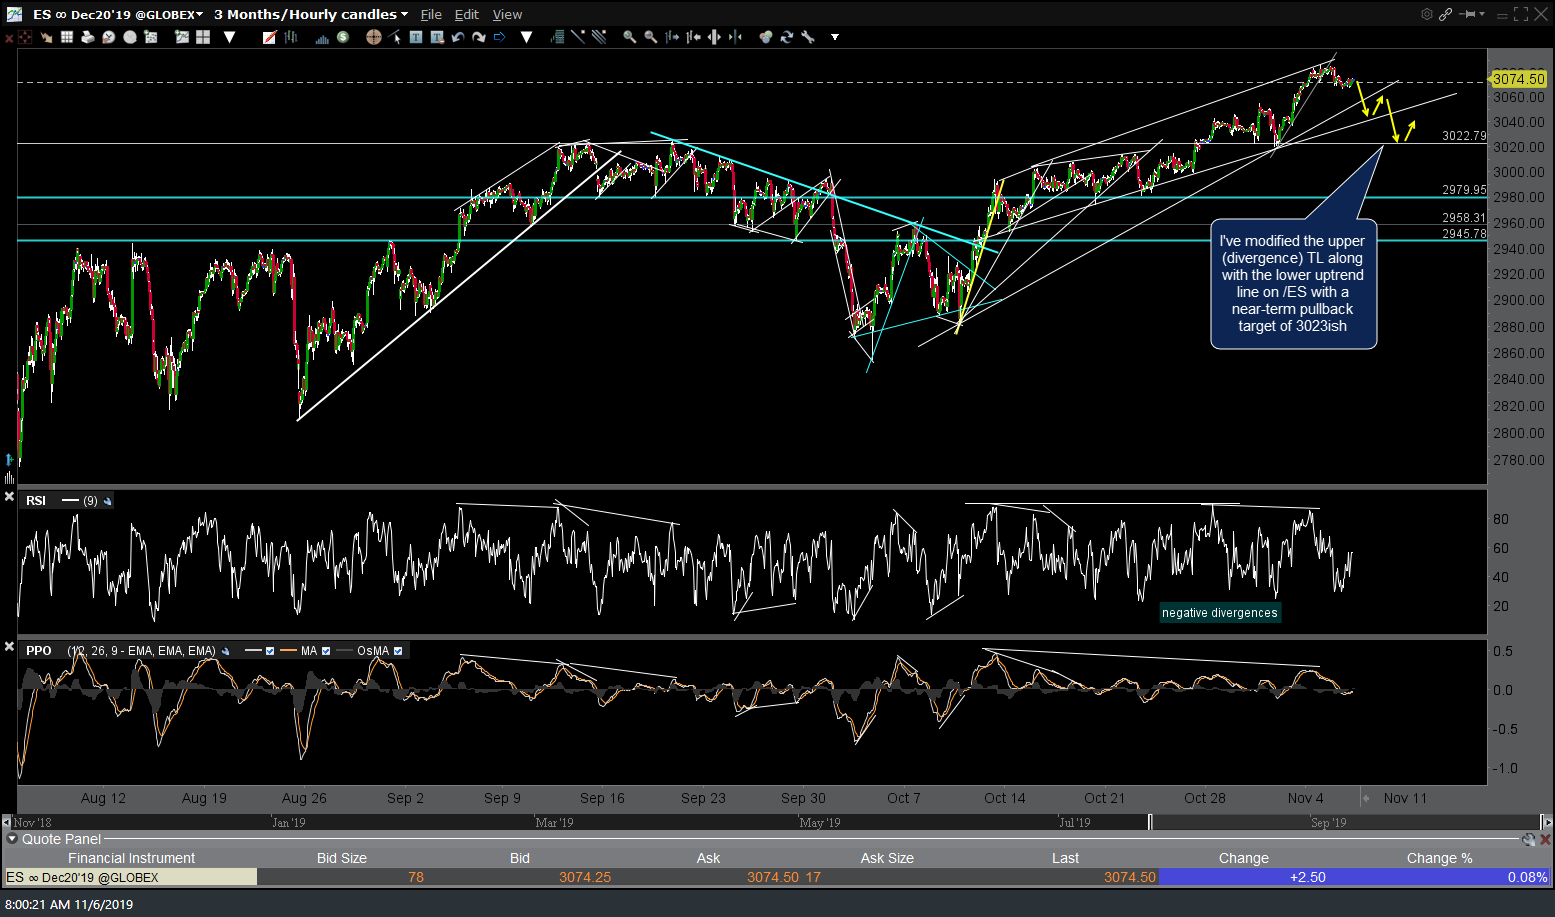
ES 60m Nov 6th
At the same time the Nasdaq 100 futures test trendline support, /ZB (30-yr T-bond futures contract) continues to trade around the intersecting uptrend line + 157-158ish support zone. As such, we’re likely to see one of those two typically inversely correlated assets break support & the other one bounce off support. Based on the technical posture of each, I favor /NQ breaking down soon with /ZB (and TLT) mounting at least a near-term, tradable bounce. Daily chart below.
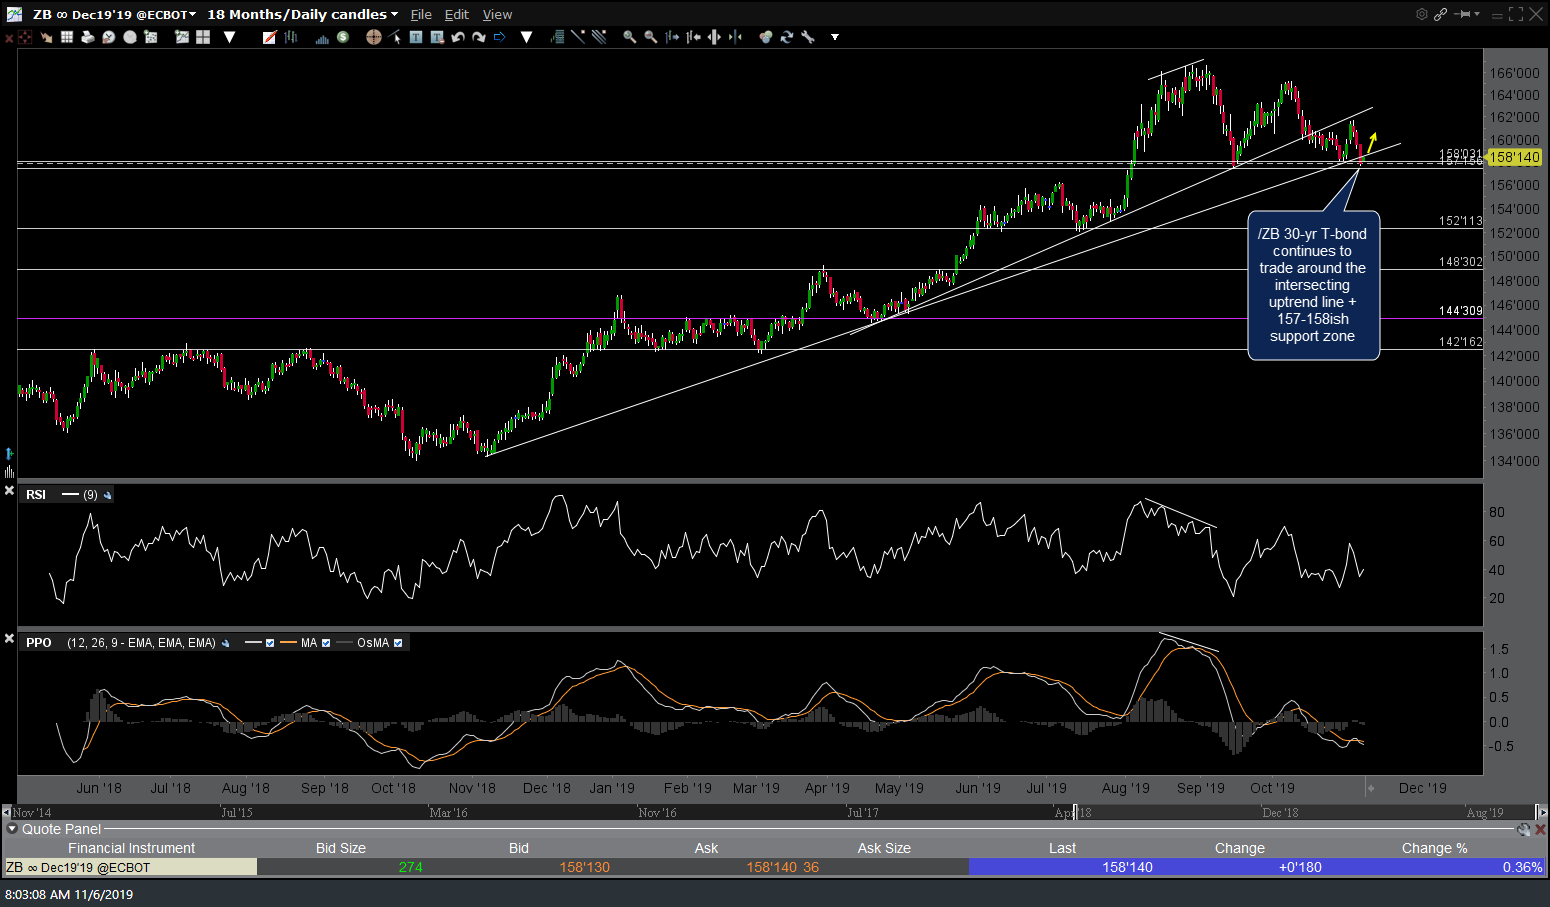
ZB daily Nov 6th
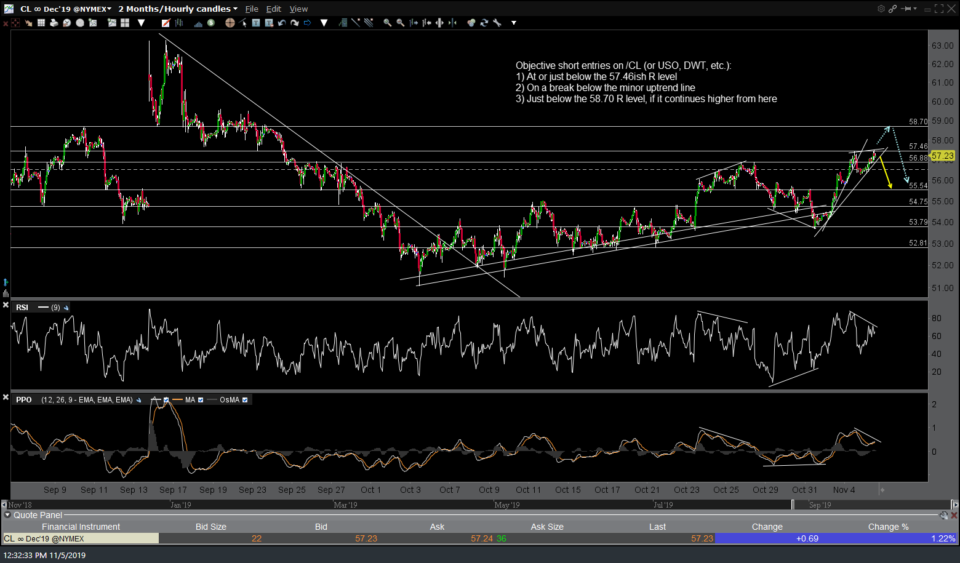
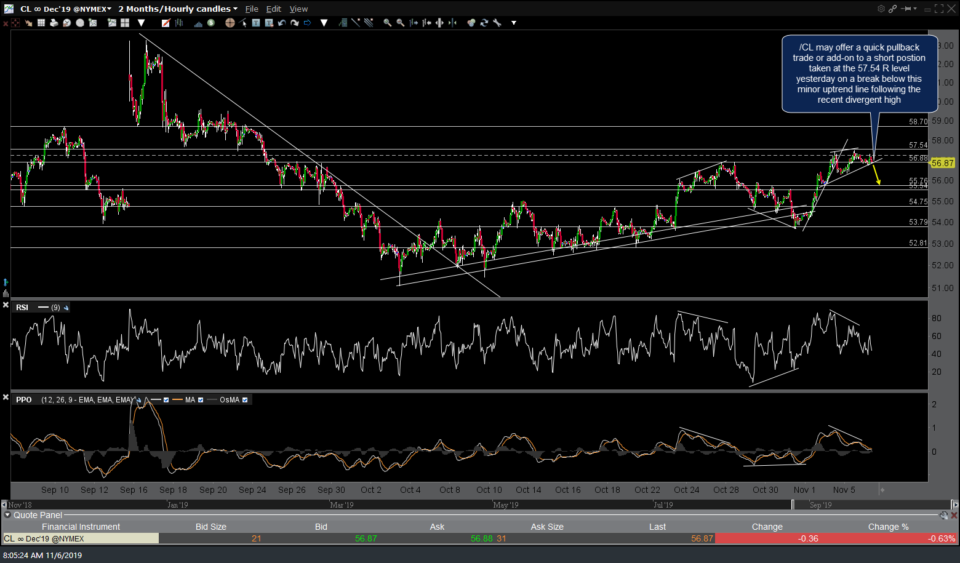
I posted /CL (or USO, DWT, etc..) as a potential short trade in the Swing Trading Group within the trading room yesterday, at the time stating “Objective short entries on /CL (or USO, DWT, etc.):
1) At or just below the 57.46ish R level
2) On a break below the minor uptrend line
3) Just below the 58.70 R level, if it continues higher from here”, along with the first 60-minute chart below:
-
- CL 60m Nov 5th
-
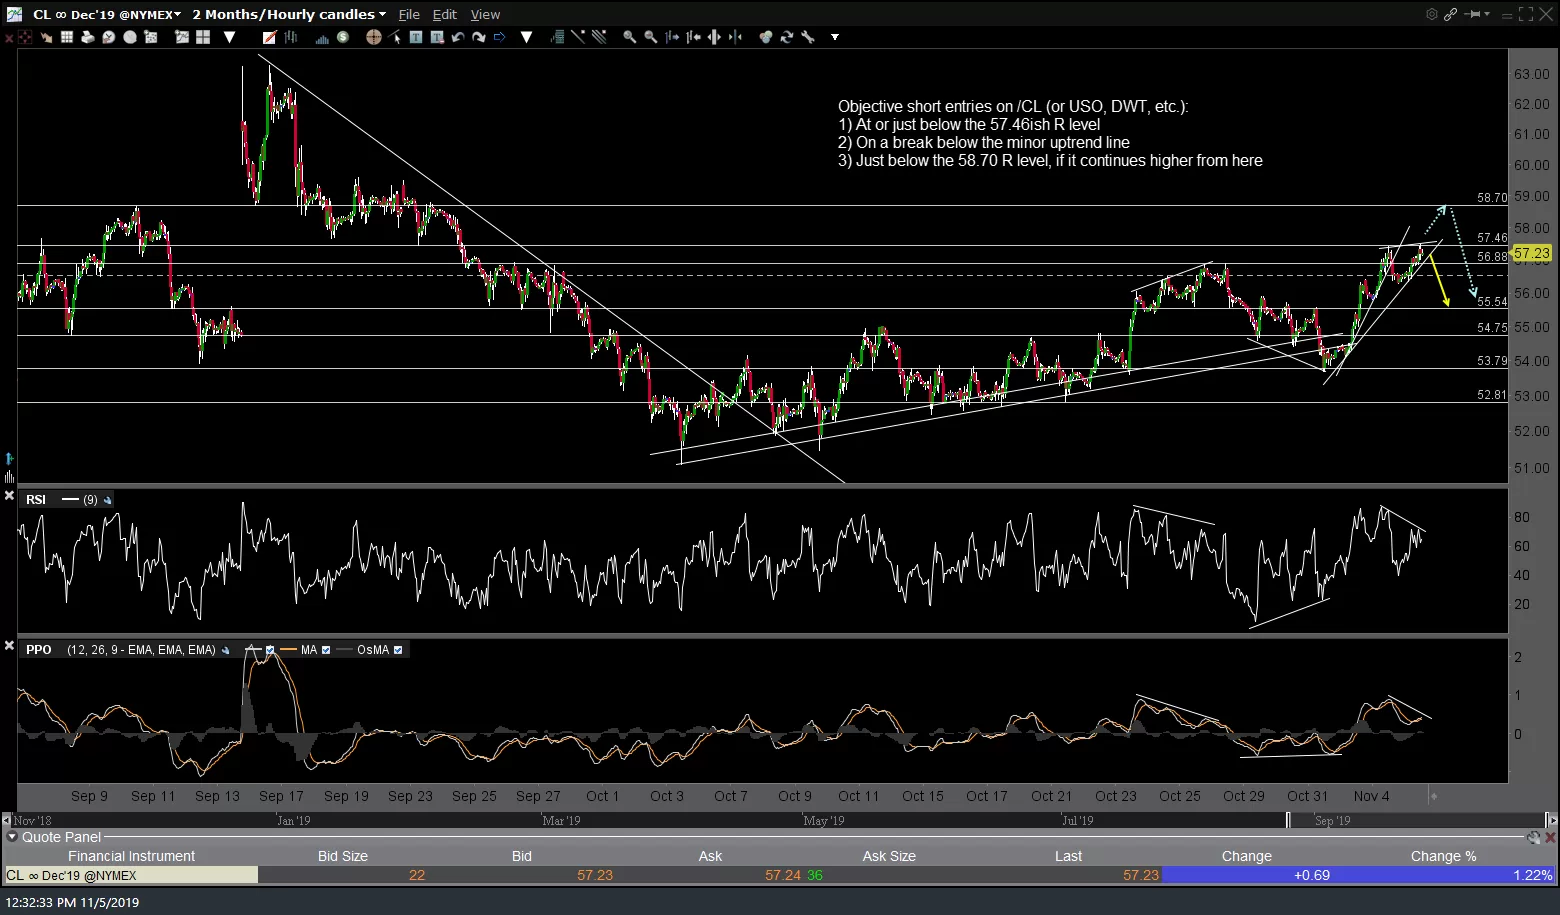
- CL 60m Nov 6th
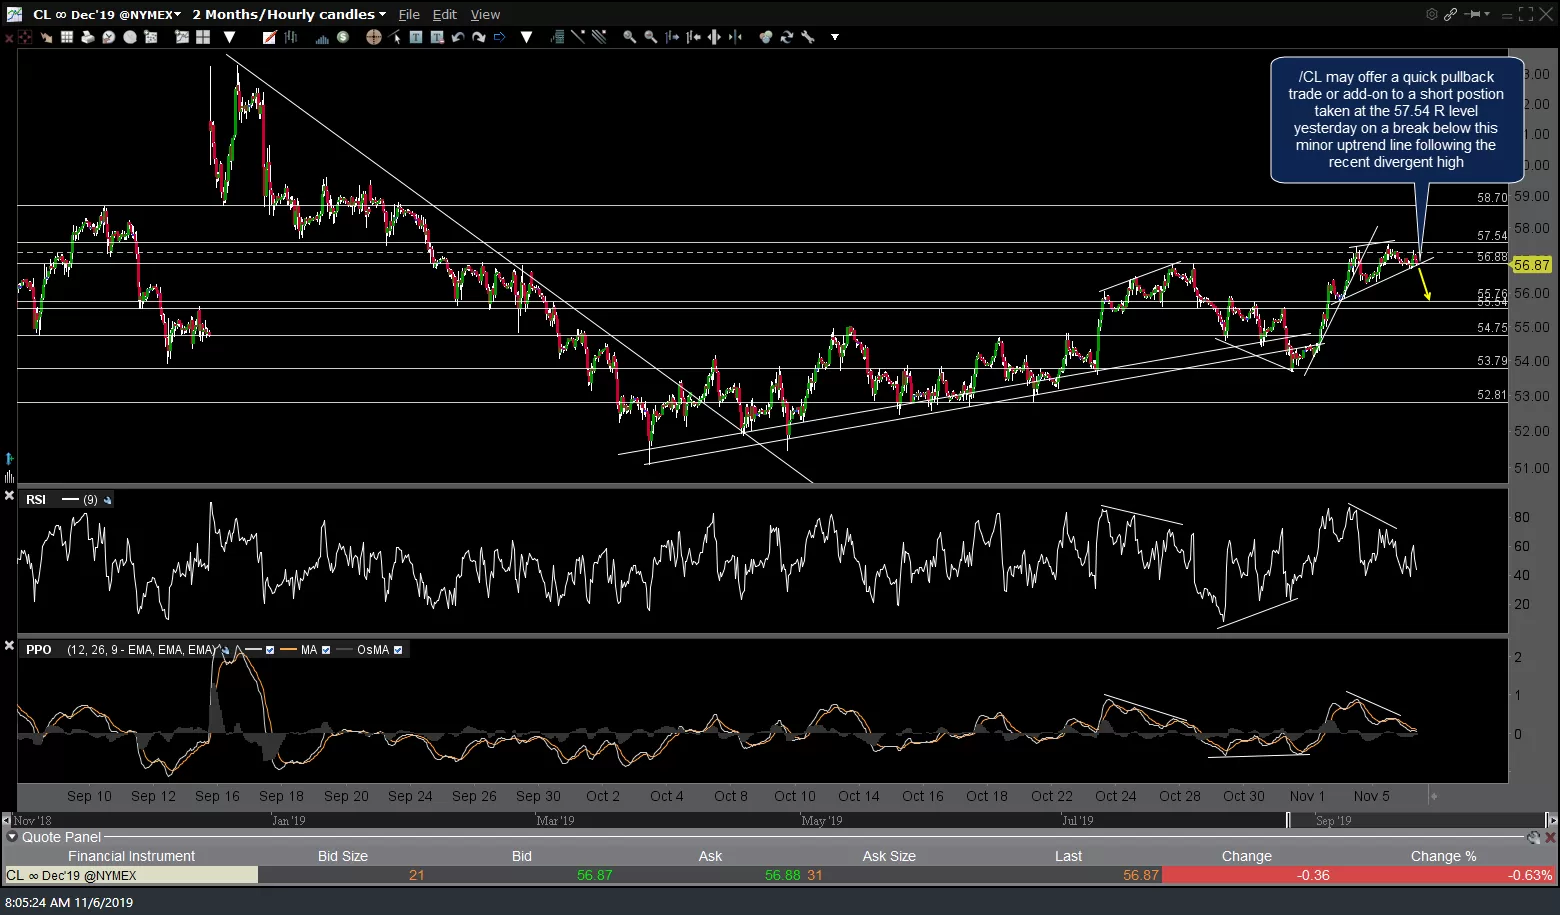
In the updated (second) 60-minute chart above, /CL (or USO, DWT, etc..) may offer a quick pullback trade or add-on to a short position taken at the 57.54 resistance level yesterday on a break below this minor uptrend line following the recent divergent high.