
Following the divergent high put in on the 60-minute chart of /NQ (Nasdaq 100) yesterday, I am on watch for a sell signal pending a solid break or 60-minute close below 9398 with a minimum pullback target of 9319. Essentially, the (nearby) yellow lines on each of the 4 charts below are near-term support & resistance levels that have the potential to spark a correction/rally if taken out.
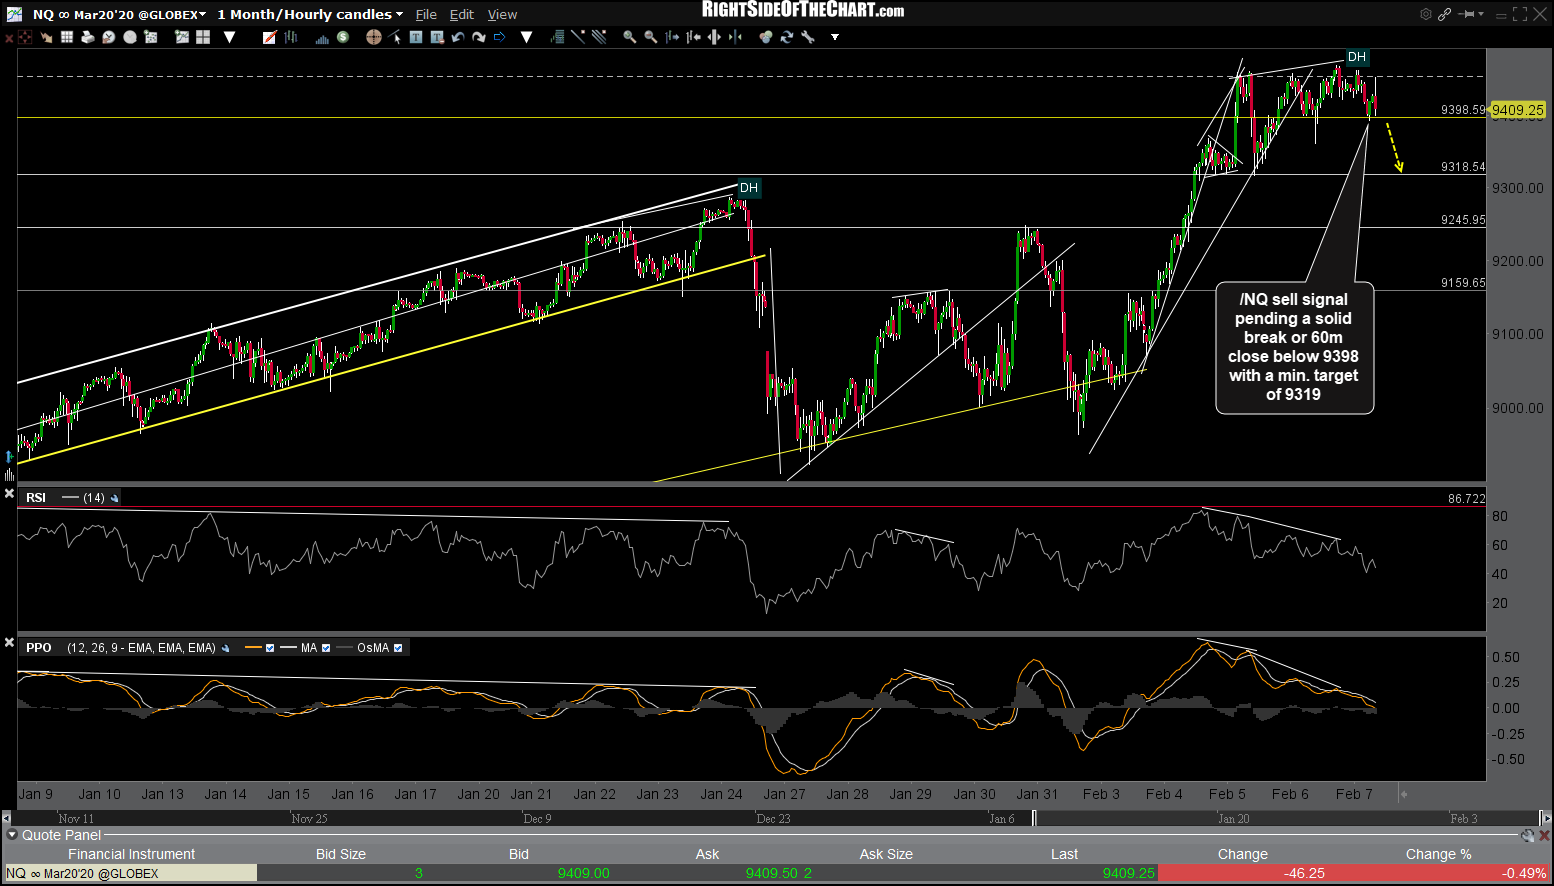
NQ 60m Feb 7th
/ES (S&P 500 futures) has broken below the 3337 support following the most recent divergent high & subsequent rising wedge breakdown with a sell signal pending a break below 9398 (edit) in /NQ. If so, min. target range 3310-3300.
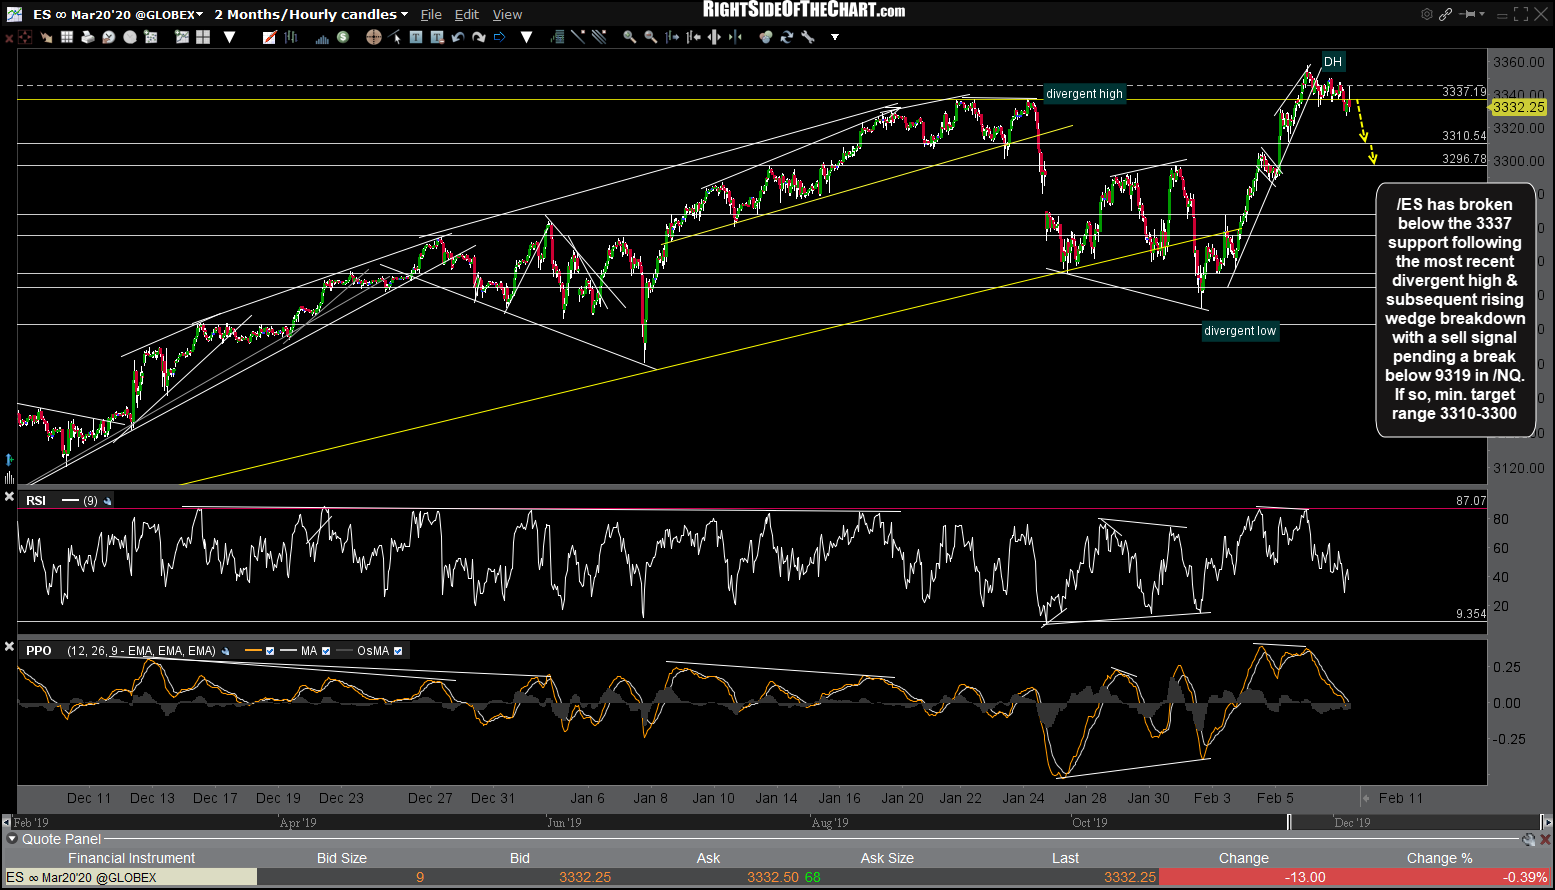
ES 60m Feb 7th
/CL (crude futures) continues to hold the key 50ish long-term support level & remains above the falling wedge pattern for now with the next buy signal to come on a solid break above 52.20.
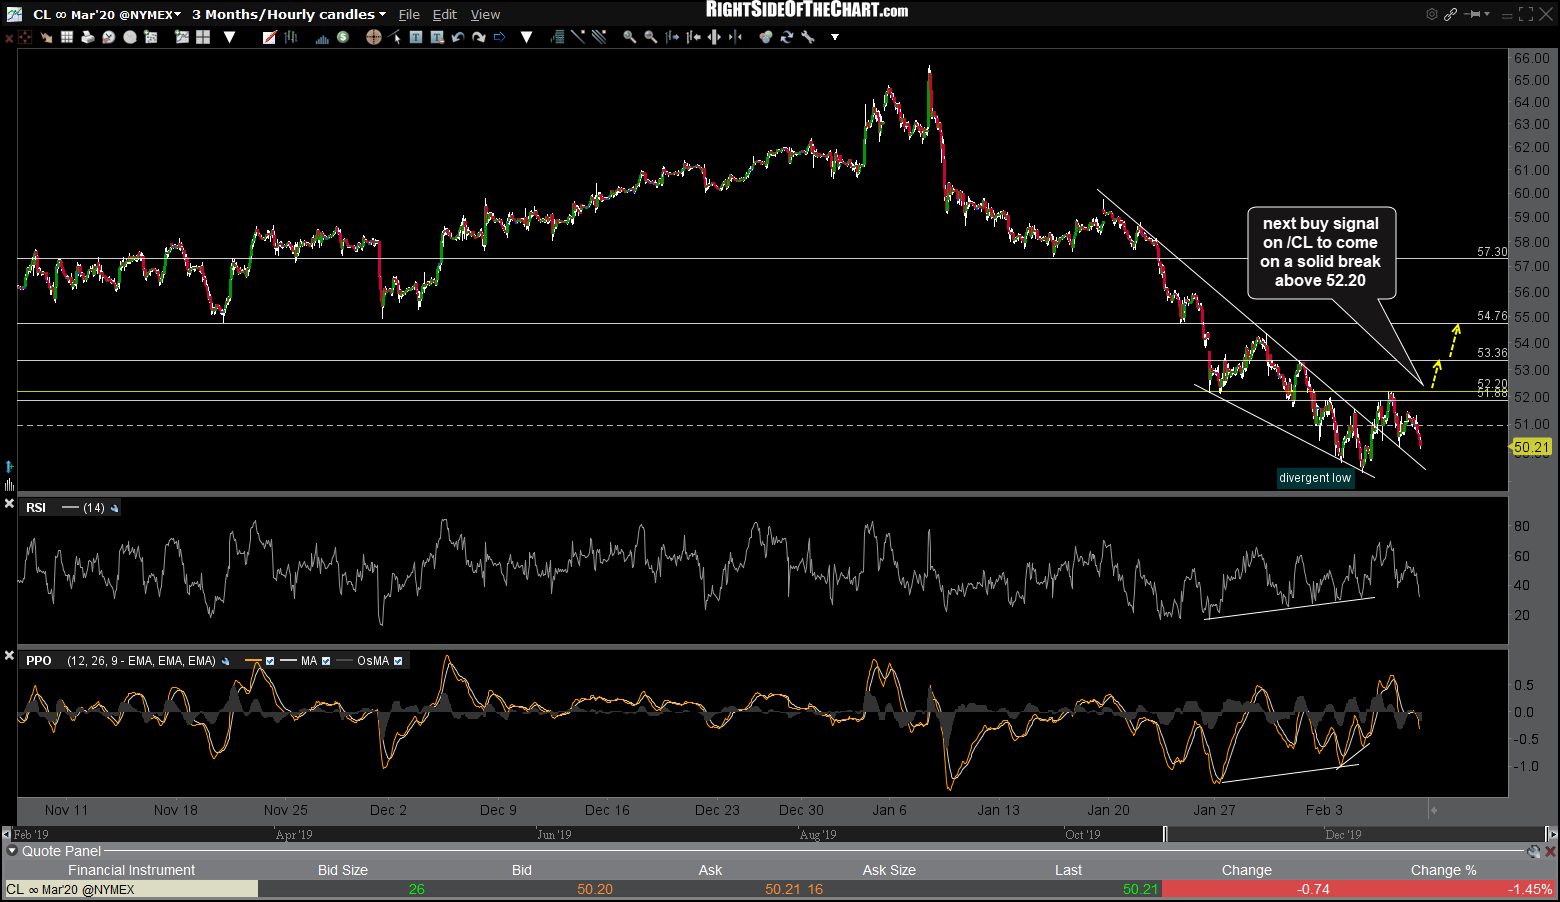
CL 60m Feb 7th
I’m also on watch for the next buy signal on /NG (natural gas futures) to come on a solid break above the 1.89ish resistance level.
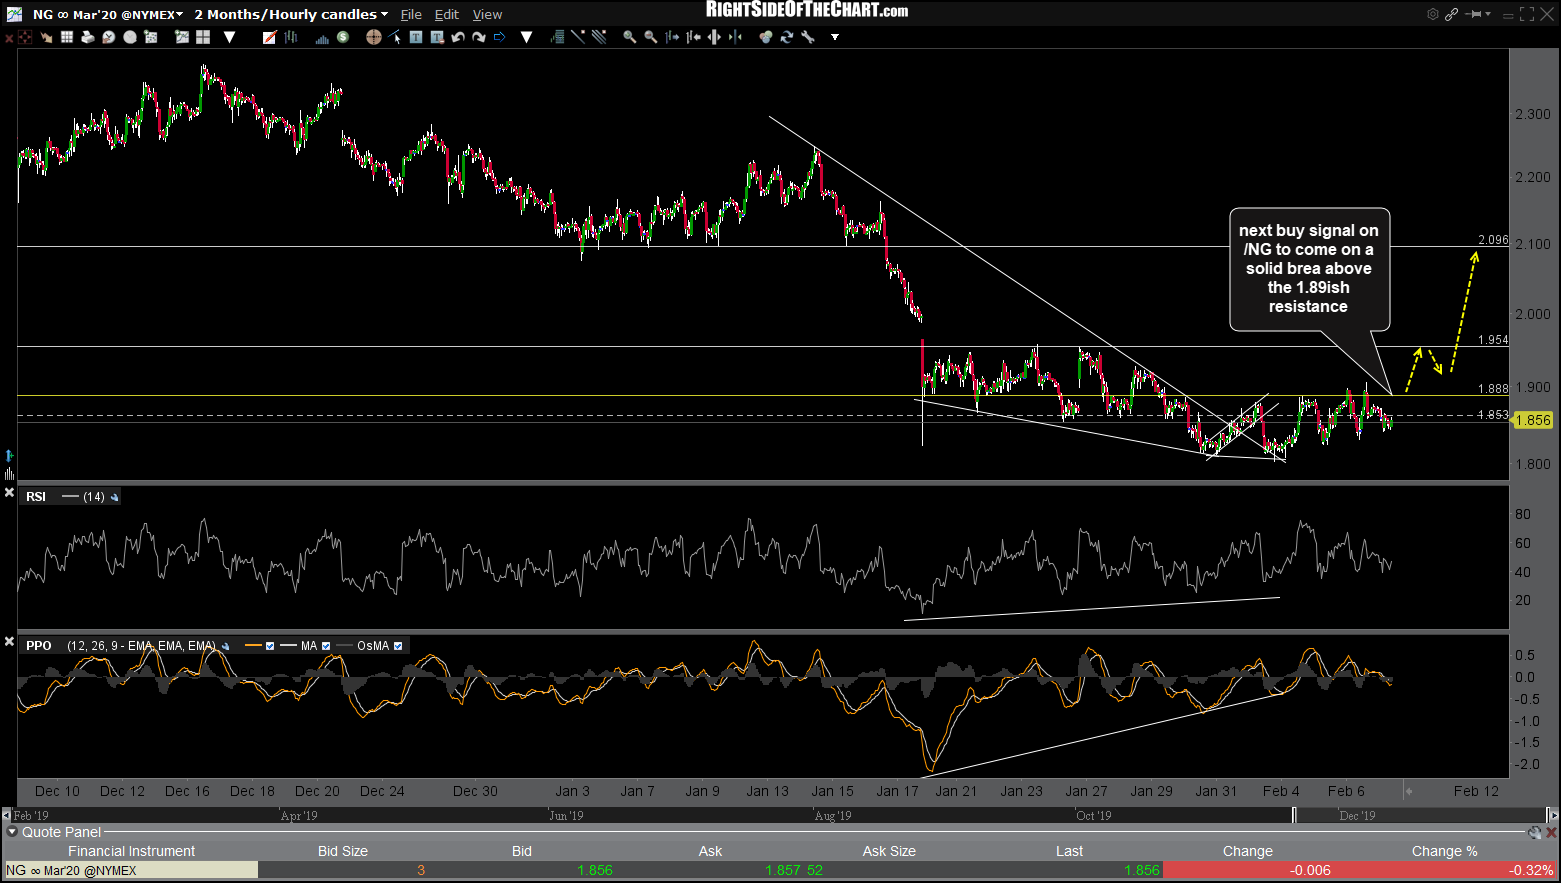
NG 60m Feb 7th