
The stock market essentially flatlined today, closing mostly flat on anemic volume. As such, there aren’t enough technical developments to warrant a video but I figured that I would share a few charts on the index tracking ETFs with some levels to watch. Both SPY & QQQ continue to pinch within the apexes of their bearish rising wedge patterns with sell signals to come should both make impulsive breakdowns below their wedges, ideally on increased volume. 60-minute charts below.
-
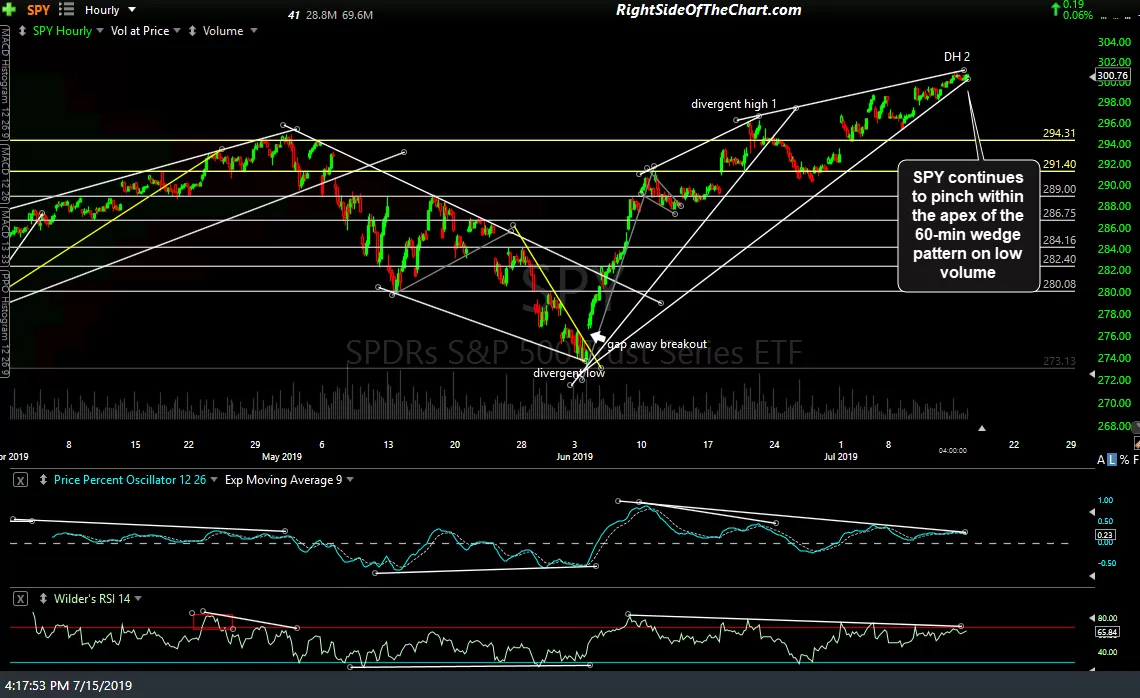
- SPY 60-min July 15th
-
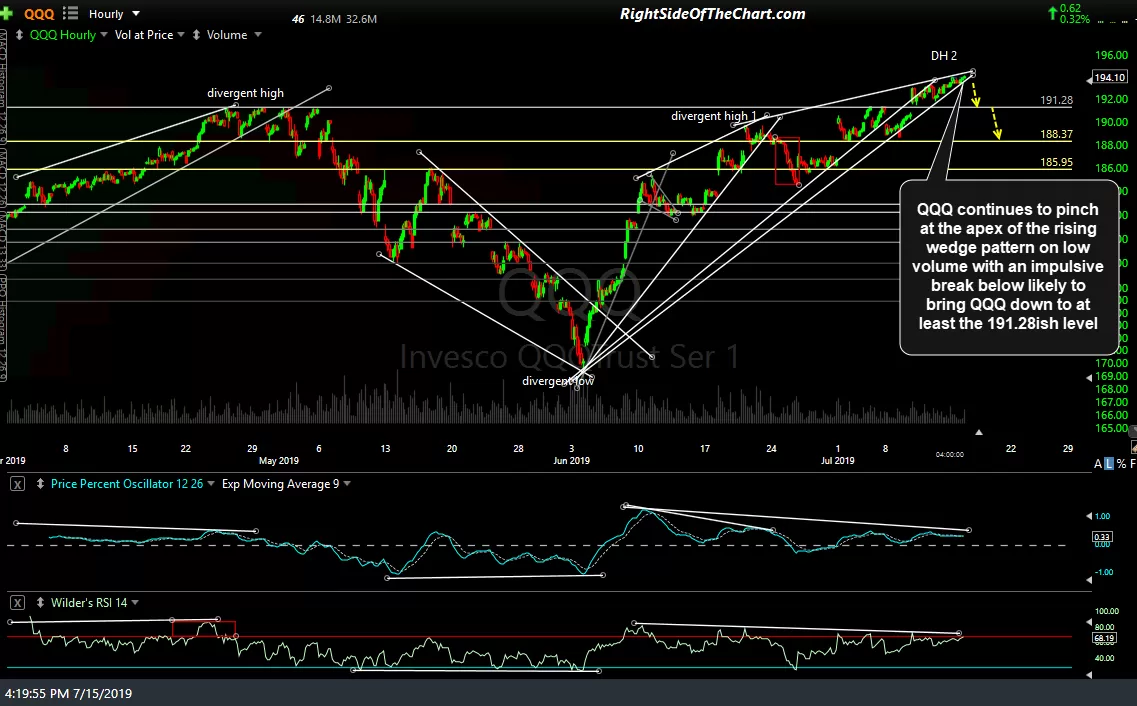
- QQQ 60-min July 15th
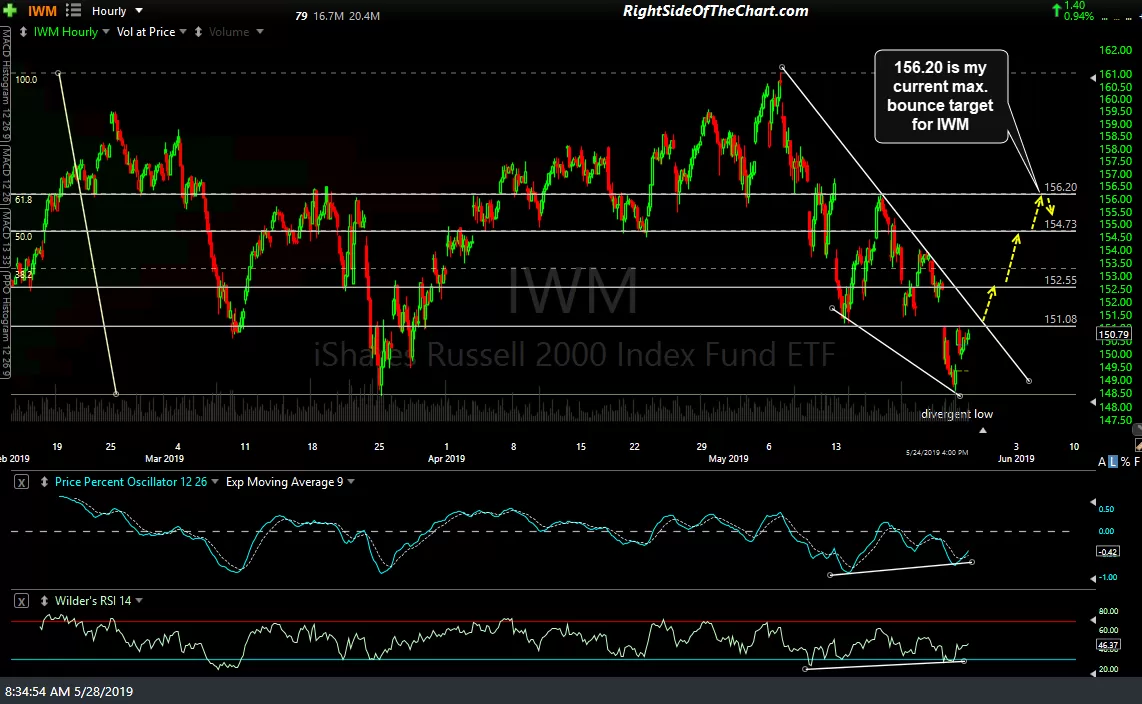
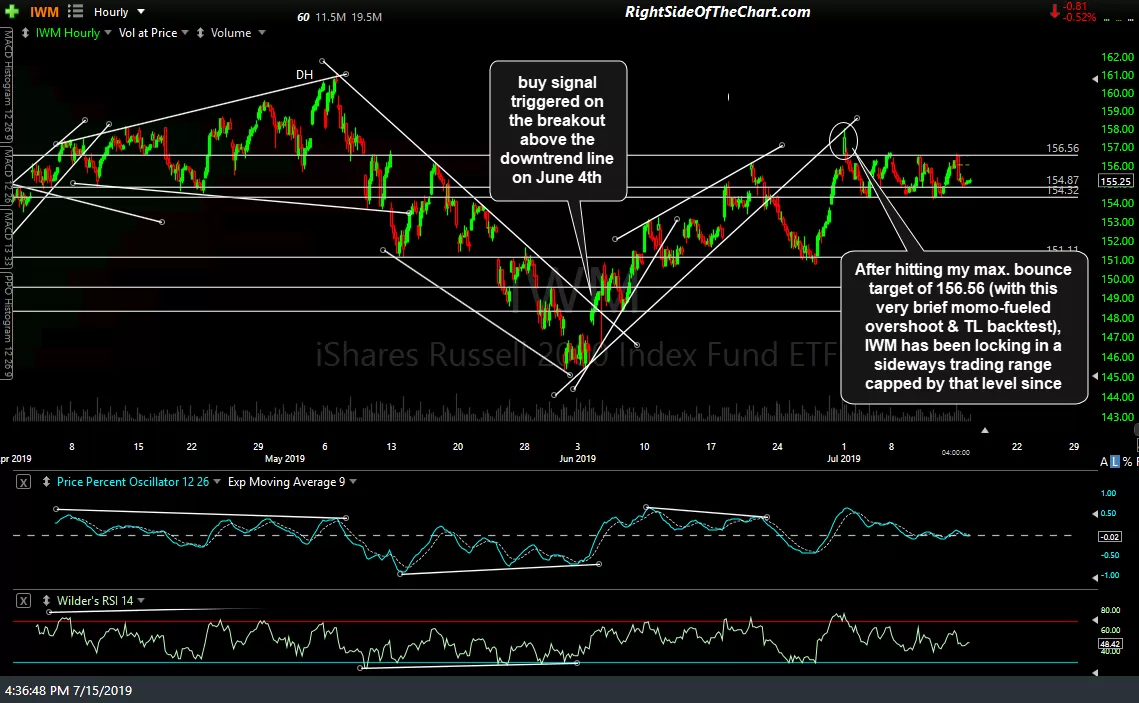
After hitting my max. bounce target of 156.56 (with this very brief momo-fueled overshoot & TL backtest) from back on May 28th (first chart below), IWM has been locking in a sideways trading range capped by that level since with the small-caps significantly lagging behind the large-cap indexes.
-
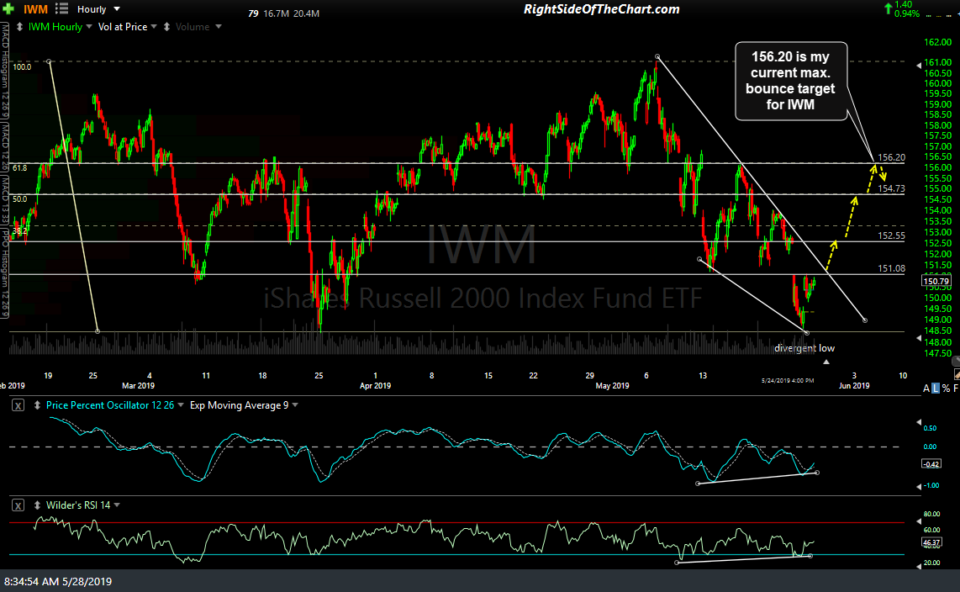
- IWM 60-min May 28th
-
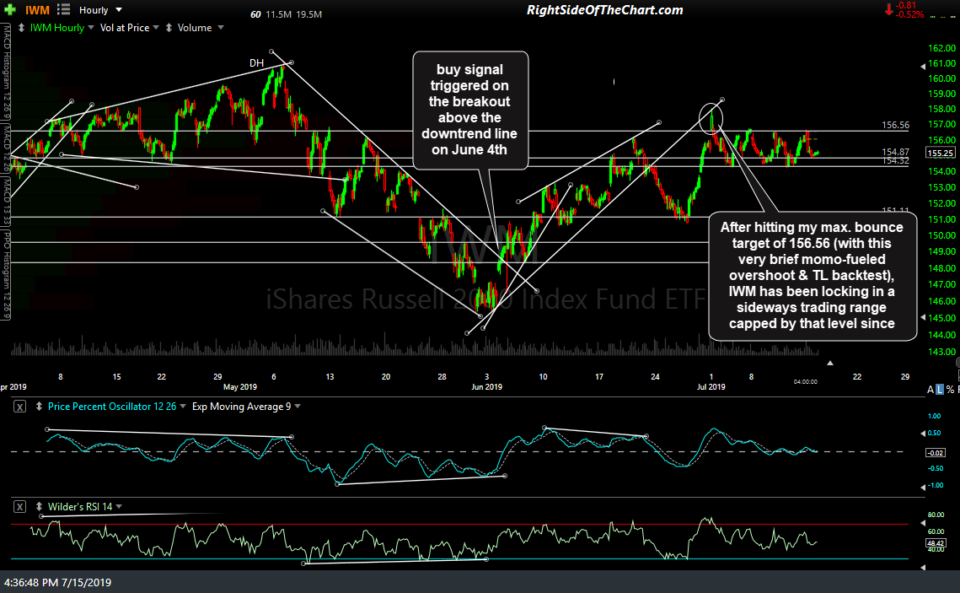
- IWM 60-min July 15th
For the most part, about the only major sectors or commodities that gained or lost more than 1% today were natural gas (with Friday’s DGAZ trade closing +6.5% today) as well as the energy sector & crude oil (posted as an unofficial trade on Friday as well), with USO (crude ETN) closing -1.76% today. Other than than, not much to report other than a pretty decent fade of nearly 1% on XLF following the open today. With a slew of big banks reporting this week, I’ll be keeping a close eye on XLF going forward.