
I was asked to post an update on the semiconductor sector so here are the updated charts of SMH (semiconductor ETF), INTC (the undisputed leader of the semiconductor sector) and QQQ (Nasdaq 100 tracking ETF). Each of those updated 60-minute charts are preceded by the previous 60-minute charts that were published in this post one week ago today.
-
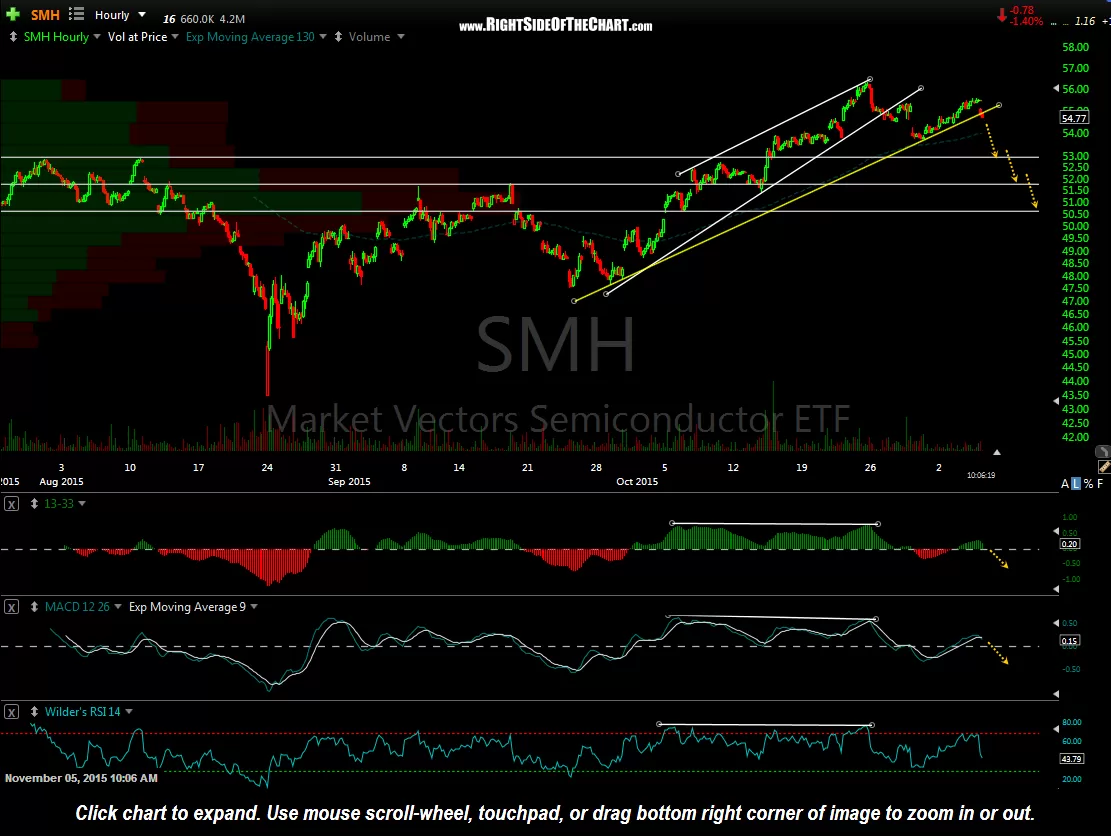
- SMH 60 minute Nov 5th
-
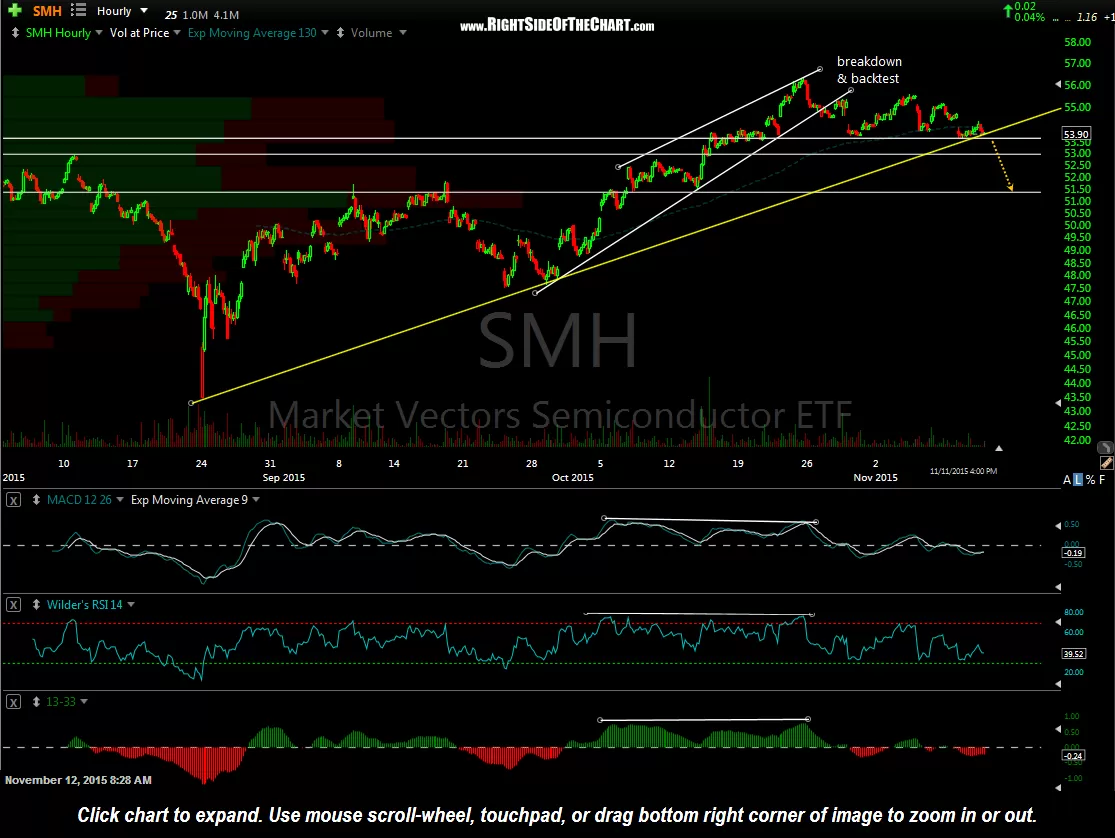
- SMH 60 min Nov 11th
-
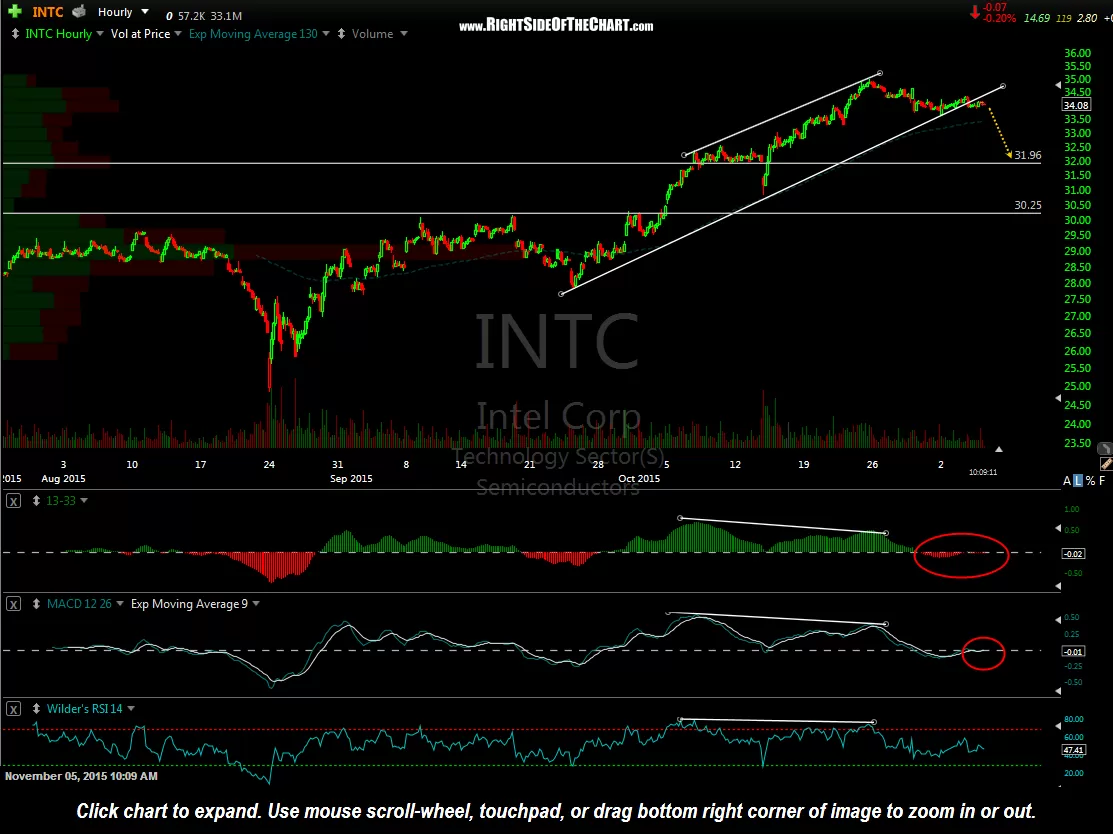
- INTC 60 min Nov 5th
-
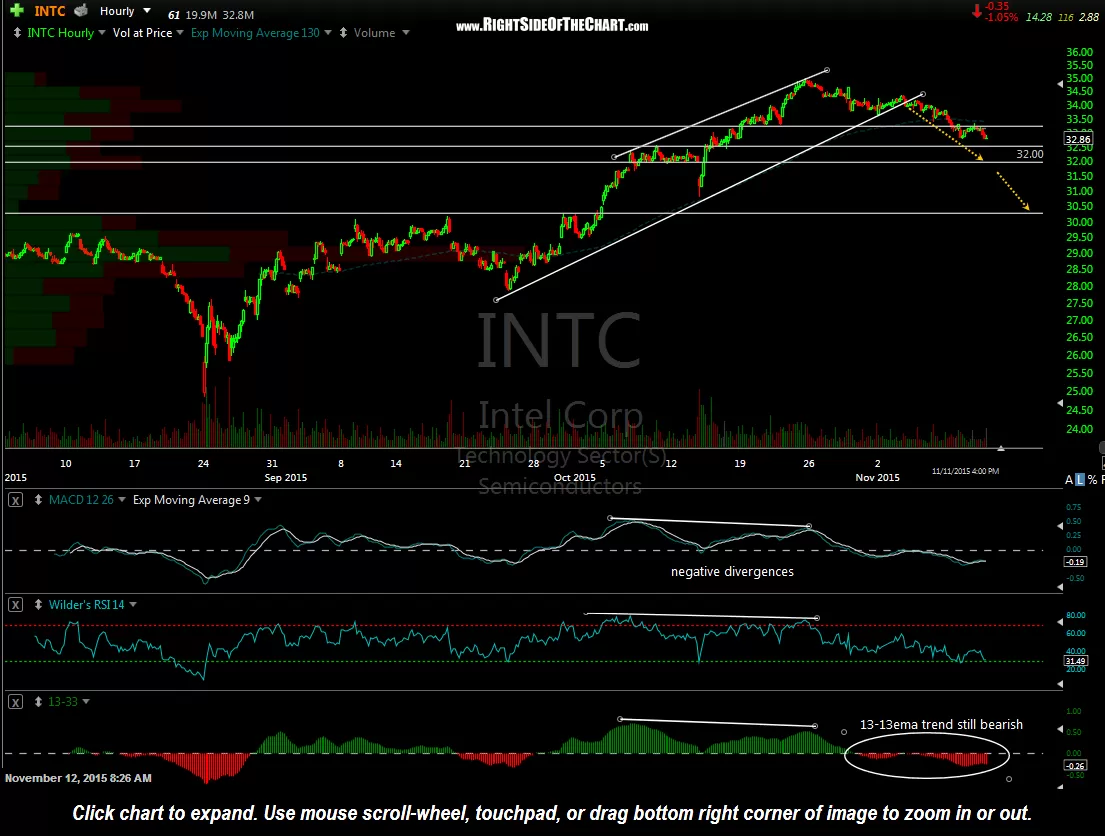
- INTC 60 min Nov 11th
-
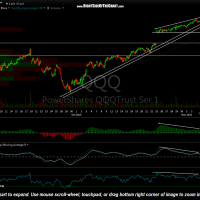
- QQQ 60 minute Nov 5th
-

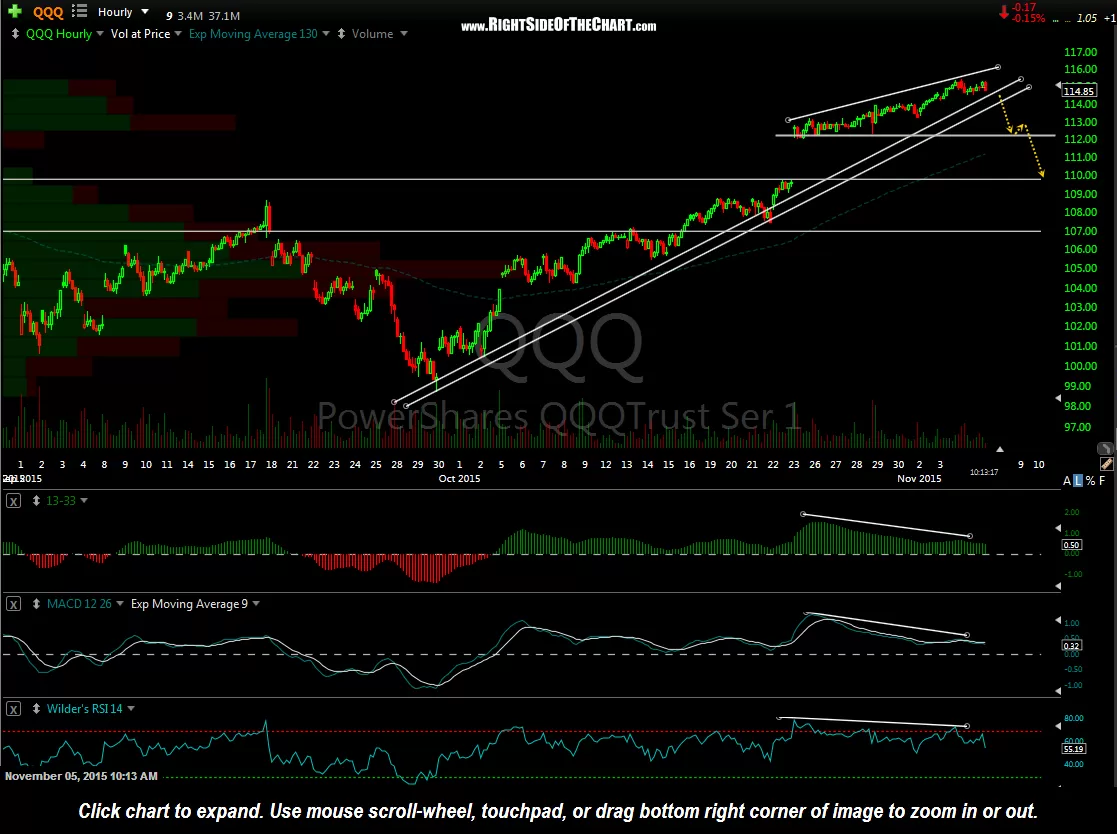
- QQQ 60 min Nov 11th
So far these charts are playing out as expected and I don’t see any developments that indicate that won’t continue to do so. At minimum, I’m expecting a backfill of the Oct 23rd gap on QQQ & likely more downside following the initial reaction off the bottom of the gap (109.85ish area).
When comparing the charts of the semis & QQQ above, also note how the semis peaked back on Oct 23rd, nearly 3 weeks ago, while the leading US index, $NDX/QQQ didn’t top until Nov 4, a week ago yesterday (these charts are reflective of yesterday’s close). The bearish implications of such divergence between the semis & the tech laden QQQ was highlighted last week in the Nov 5th post Divergence between the Semis & Nasdaq 100 a Red Flag.
Despite the recent 60-minute wedge breakdowns & my near-term and longer-term bearish outlook for US equities, there is still quite a bit of work to be done to strengthen the bearish case. I wouldn’t mind seeing the markets hold the top of the gap today only to gap down soon to print that Island Cluster top but that is just one of many possibilities. As such, I continue to remain cautiously bearish & moderately short, awaiting additional bearish confirmation before getting more aggressively short as well as any potential bullish developments, such as close above 117 on QQQ (the official stop for the active TQQQ short trade) or a move above 31.00 on SOXL (the official stop for that short trade on the semis).