

Detailed comparison of the uncanny similarities between the recent price action in QQQ over the past few months and that leading up to the start of the last bear market, when QQQ peaked in November of 2021, followed by a 38% bear market.
YouTube link: https://youtu.be/9kSafTU7iEc
In this mid-session market update, Randy Phinney compares the current technical posture of Invesco QQQ Trust (QQQ) with its 2021 bull market top structure. By examining the 60-minute and daily charts, the analysis illustrates uncanny technical similarities—including divergent highs, trendline breakdowns, and bounce levels—and outlines objective entries and downside price targets.
Securities & Topics Covered
- Invesco QQQ Trust (00:00) — QQQDetailed technical breakdown of QQQ on 60-minute, daily, and 2-day timeframes. The video highlights current resistance backtests of a symmetrical triangle pattern, persistent negative divergence, and the active short trade setup. Objective downside price targets discussed for QQQ include:
- T1: Initial support/target zone (previously hit & reacted)
- T2: ~467 level (previously hit & reacted)
- T3: ~454 level
- T4 (Final Target): ~436 level (representing an approximate 15% drop from entry, aligning closely with the 200-day moving average)
Additionally, an alternate “marginal new high” scenario is detailed where a brief punch to new highs would create a guaranteed divergent high on daily/weekly charts before failing toward T4.
- Nasdaq 100 Index / Futures (01:41) — $NDX / /NQHistorical perspective on major bear market drawdowns, comparing the 78% drop during the 2000–2002 dot-com bubble and the 38% (11-month) decline during the 2021–2022 tech bear market. Discussion on how tech concentration impacts $NDX, QQQ, and /NQ compared to broader market indexes.
- SPDR S&P 500 ETF Trust (10:33) — SPY / $SPX / /ESAnalysis of SPY/S&P 500 divergence relative to QQQ. Just as in late 2021 when SPY pushed to a marginal new high 1.4 months after QQQ peaked on November 22, 2021, recent price action shows broader indexes pushing new highs while tech leadership lags under negative divergence.
- Historical Chart Comparison: Late 2021 vs. Present (16:00) — QQQWalkthrough of archived 60-minute QQQ charts from Nov 2021 through March 2022 (16:56, 23:09, 25:45, 28:00, 29:03). Highlights how initial minor trendline breaks and sell signals preceded massive 38% downside moves, offering a roadmap for current expectations.
- VanEck Rare Earth/Strategic Metals ETF (42:02) — REMXReview of a completed short trade setup in REMX that achieved its T2 target for a +20% profit (and ultimate potential T3 target for a +24% gain). Demonstrates risk management techniques such as trailing stop-losses (e.g., 5% trailing stops) to maximize trend capture.
- Snowline Gold Corp. (45:08) — SNWGFCase study of active swing trading in gold mining stocks. Highlights multiple completed cycles on SNWGF, including a short trade off a Head & Shoulders pattern for a 23% gain, a second short break for 25–26% profit, and subsequent long bounce trades hitting targets up to +37% upside.
Ticker Symbols Discussed:
QQQ, $NDX, /NQ, SPY, $SPX, /ES, REMX, SNWGF, GDX, GLD, $GOLD, $SLV, AAPL, AMZN, NVDA, META, TSLA, MSFT
Current 60-minute Chart Of QQQ Followed By Those From 2021/2022 Covered in Video:
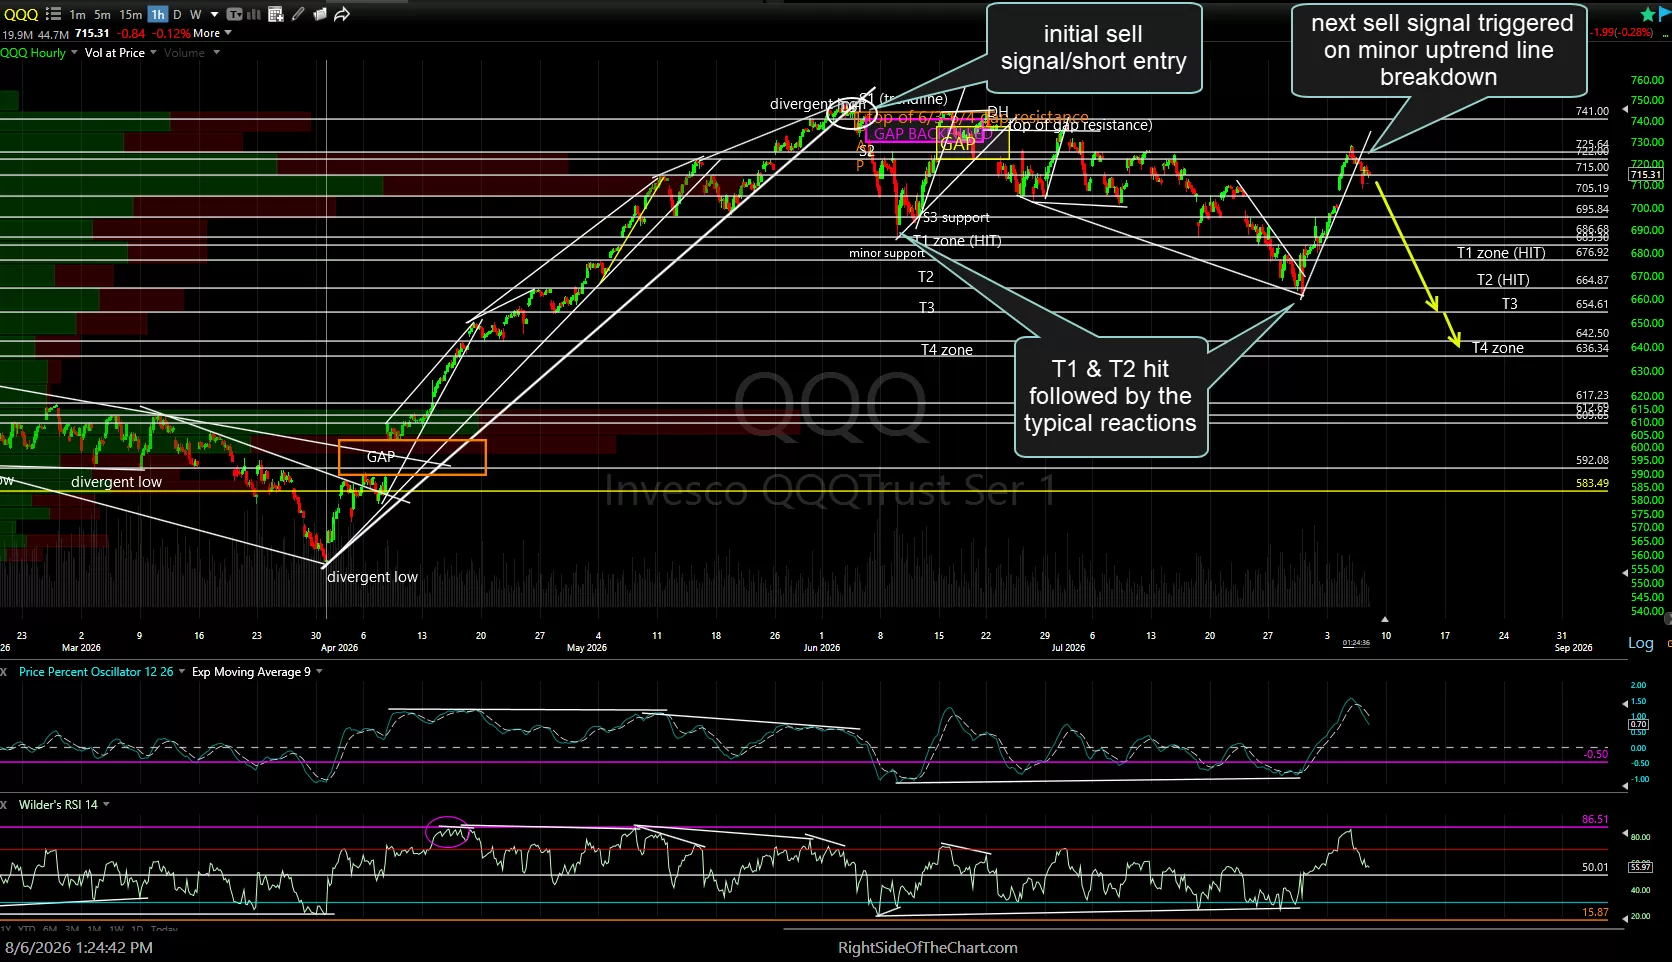
QQQ 60m Aug 6th 2026
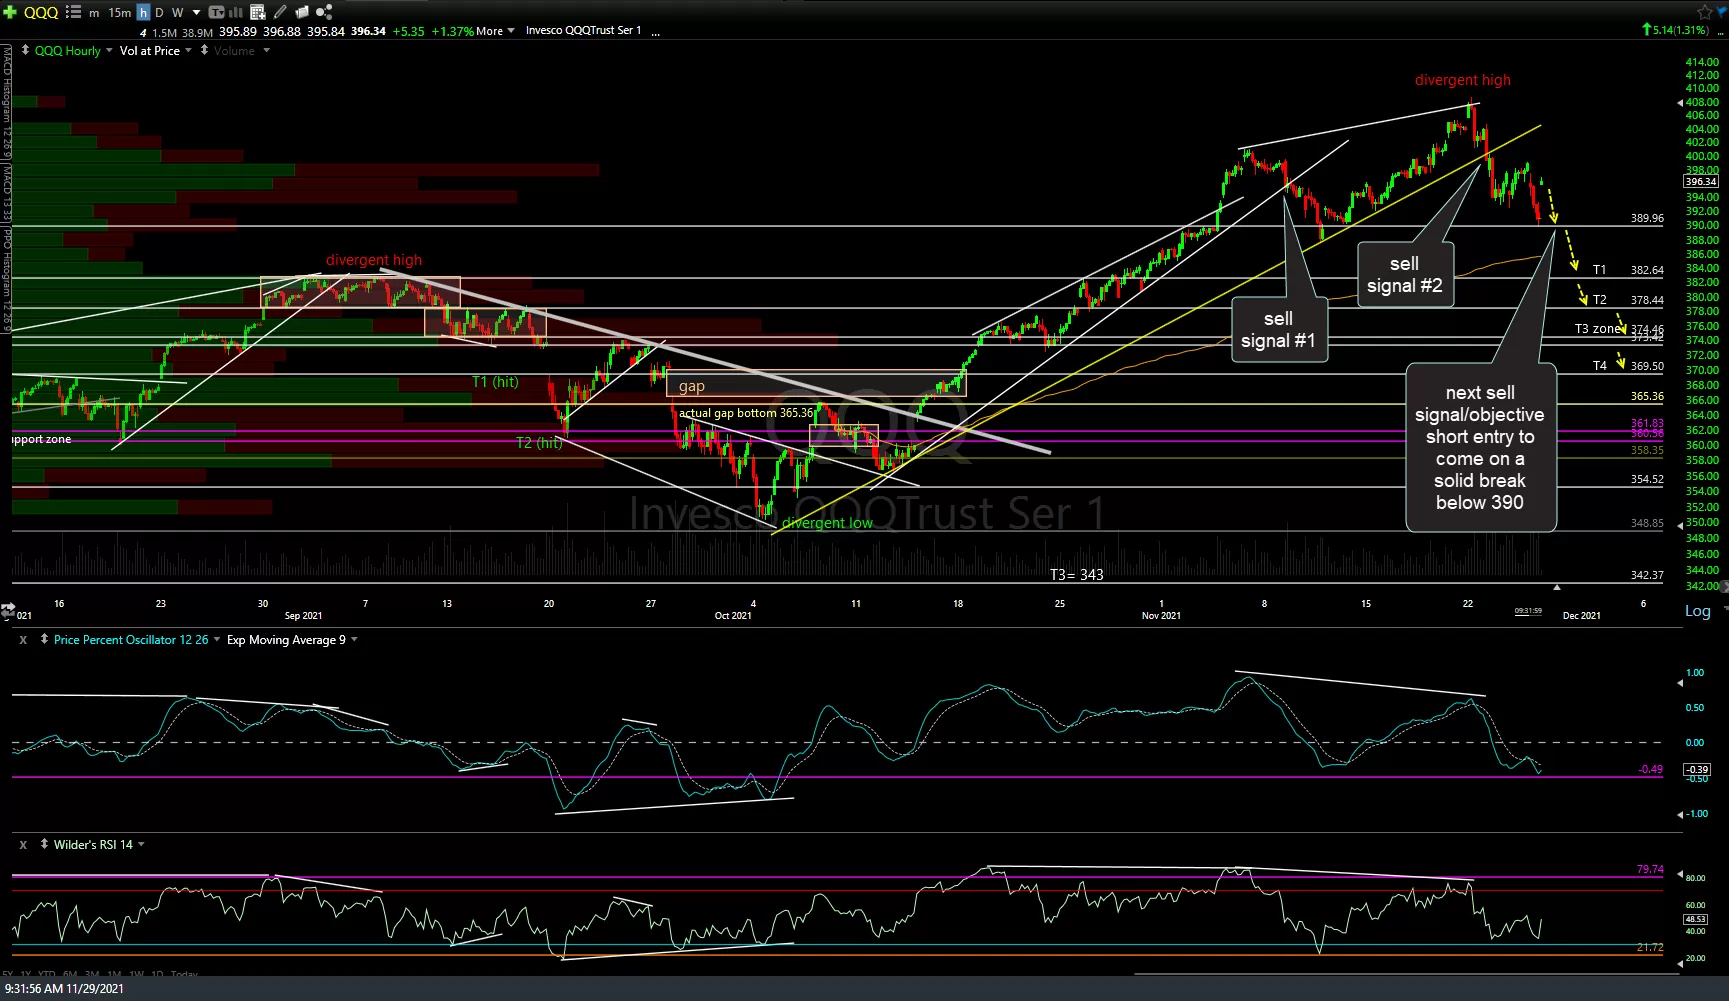
QQQ 60m Nov 29th 2021
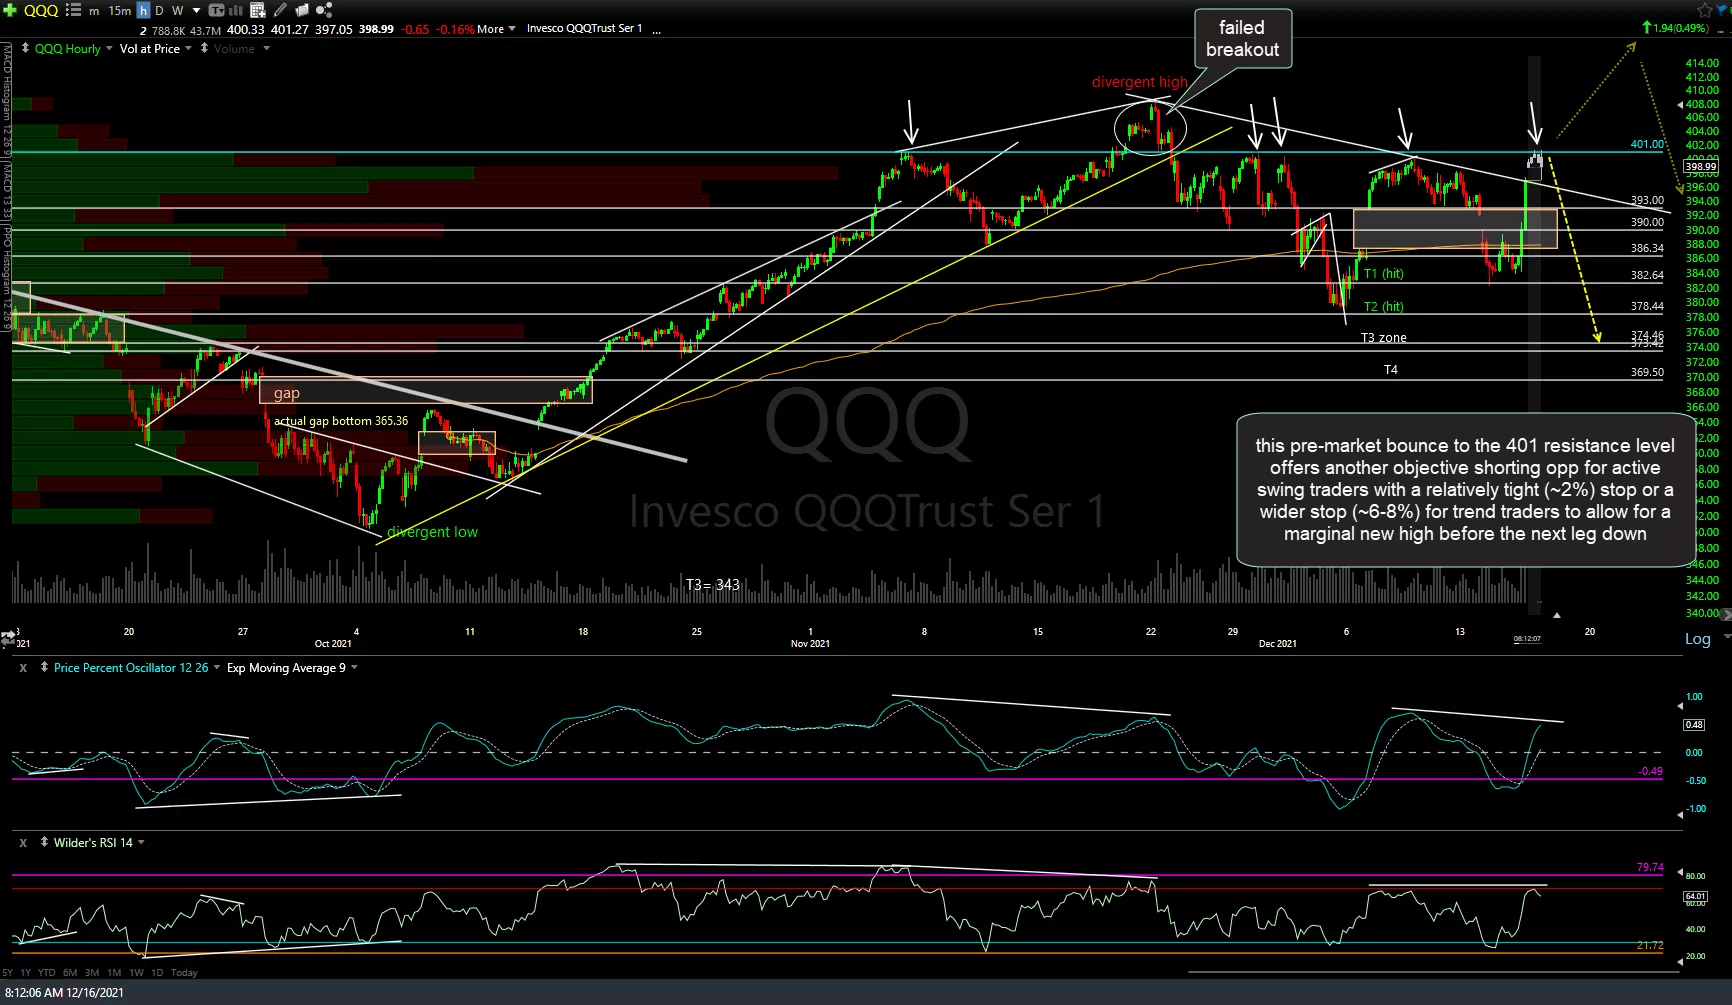
QQQ 60m Dec 16th 2021
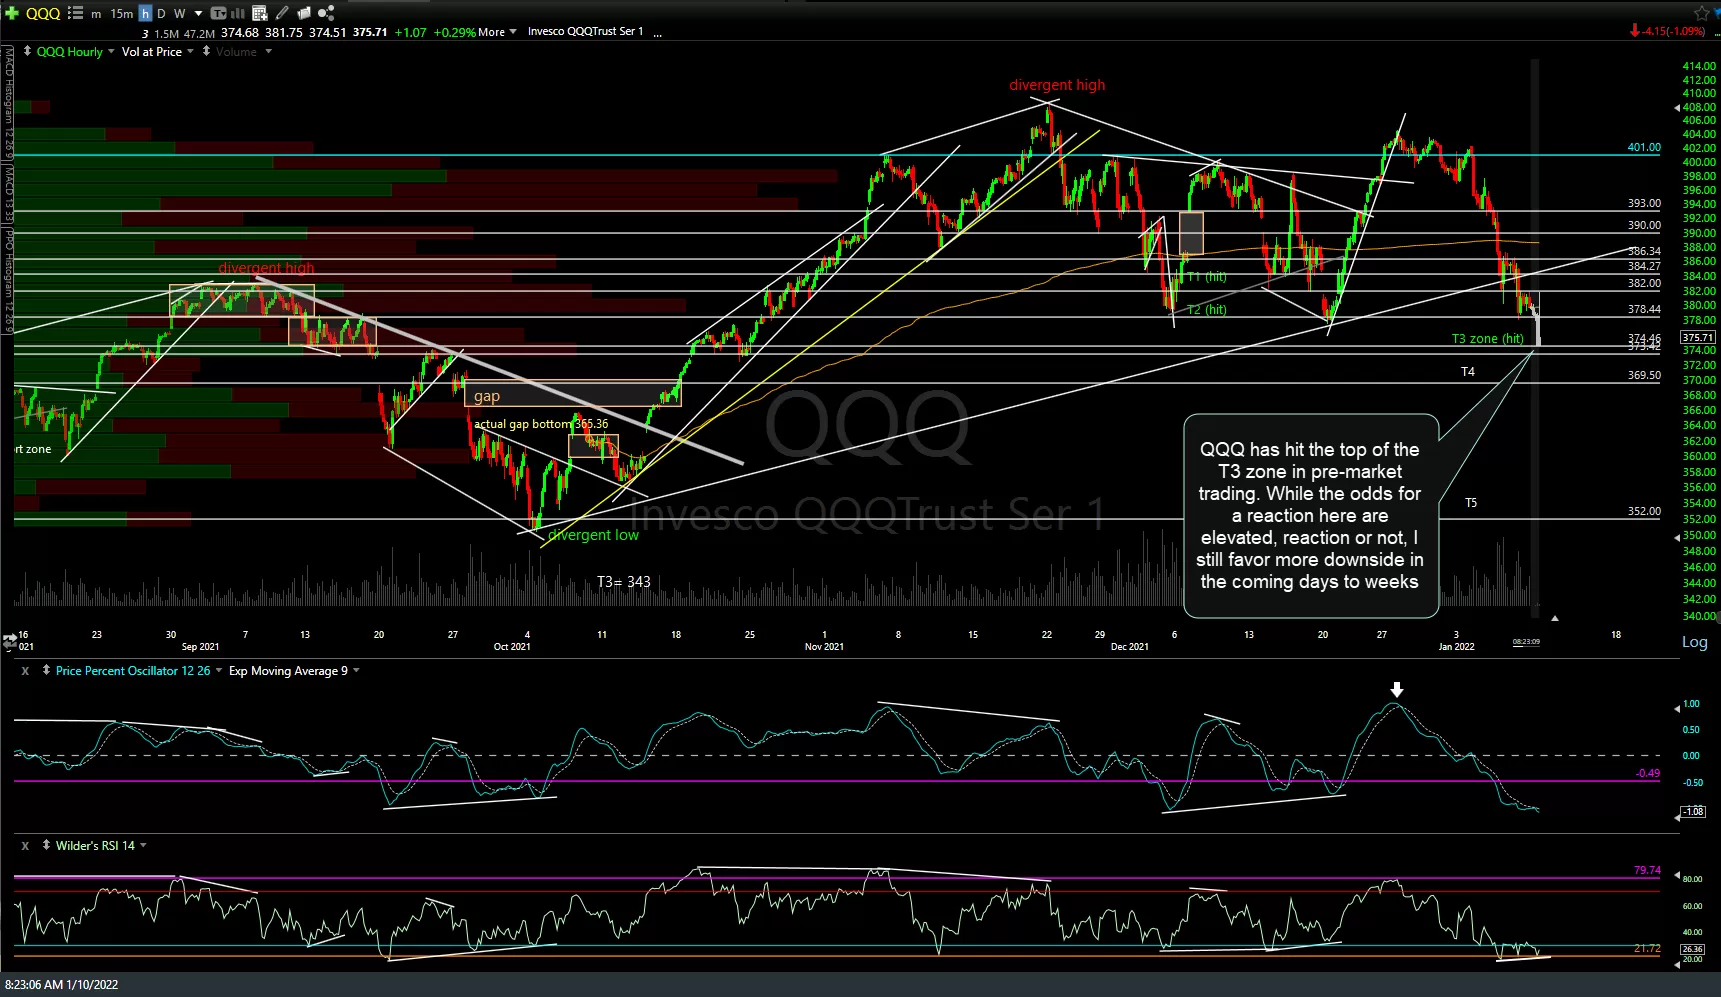
QQQ 60m Jan 10th 2022
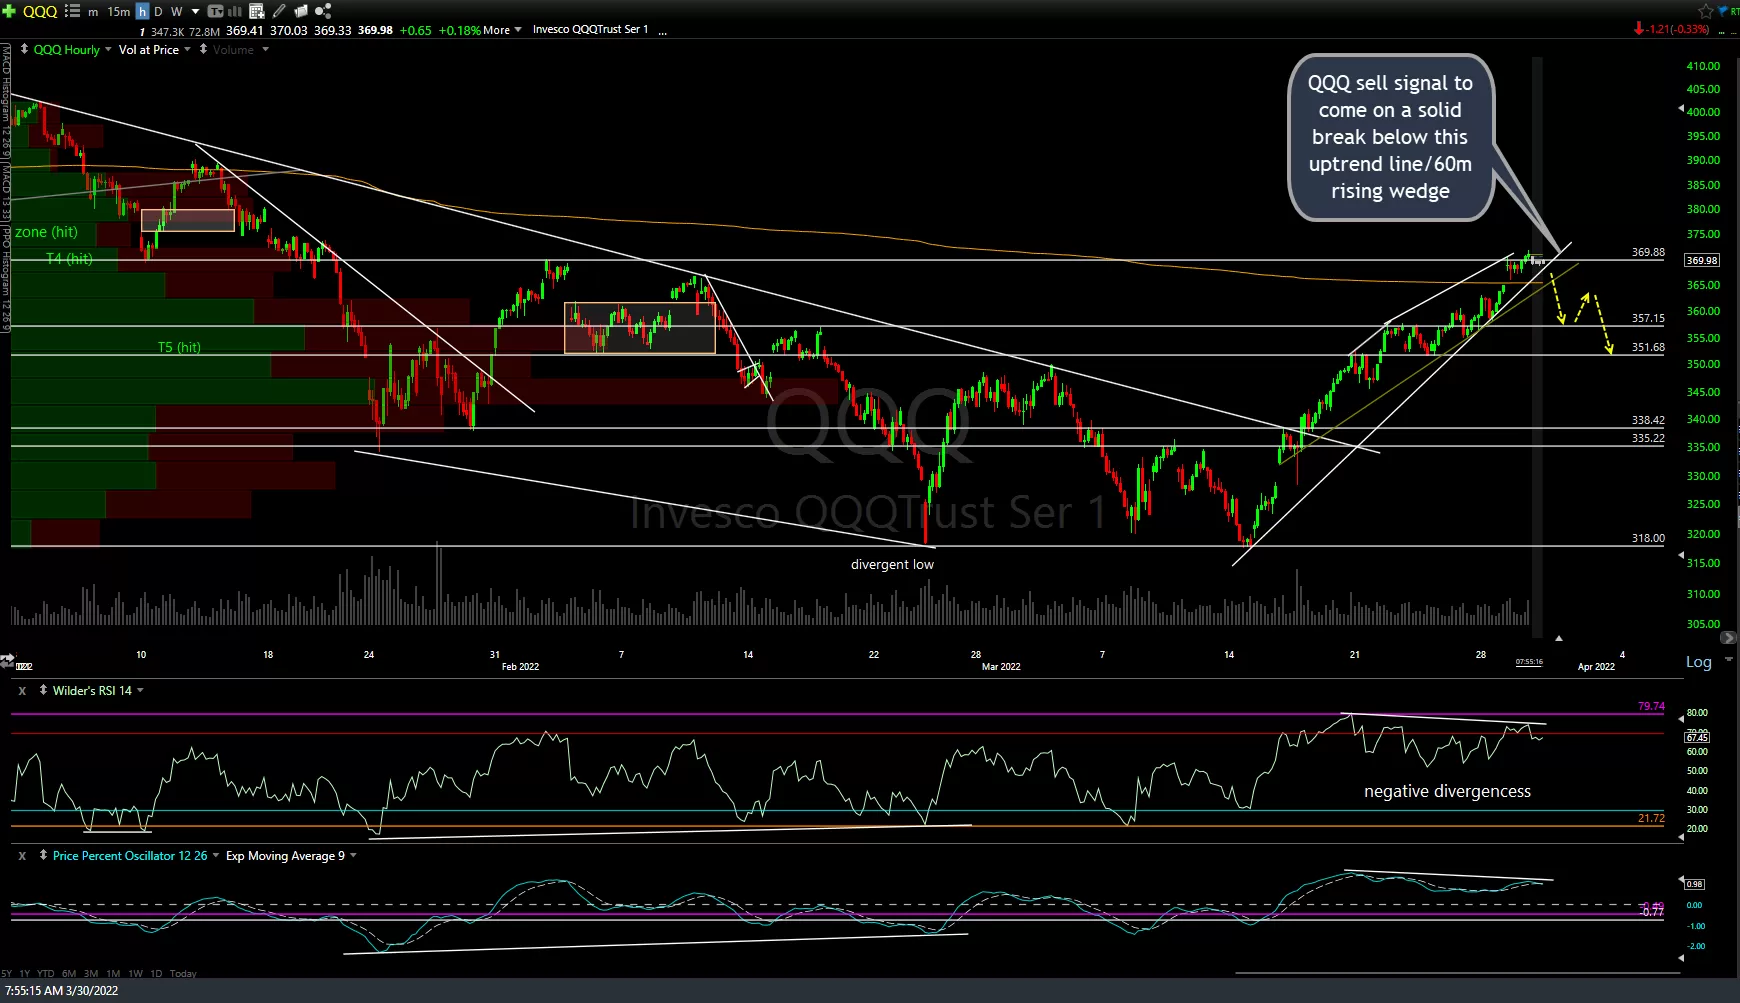
QQQ 60m March 30th 2022
(Time/Date stamp on bottom left corner of each chart)