
These are the 60-minute charts of /NQ (Nasdaq 100 futures) and /ES (S&P 500) with key support & resistance levels that are likely to determine the next tradable trend. Essentially, a solid break & especially a solid close below the recent lows today would likely usher the next wave of selling & likely move down to my next price targets on the SPY & QQQ weekly charts next week while a successful defense of the recent lows, including a brief whipsaw break below followed by a solid recovery, would be bullish. I still favor the former but will certainly respect (and adjust my positioning accordingly) the latter.
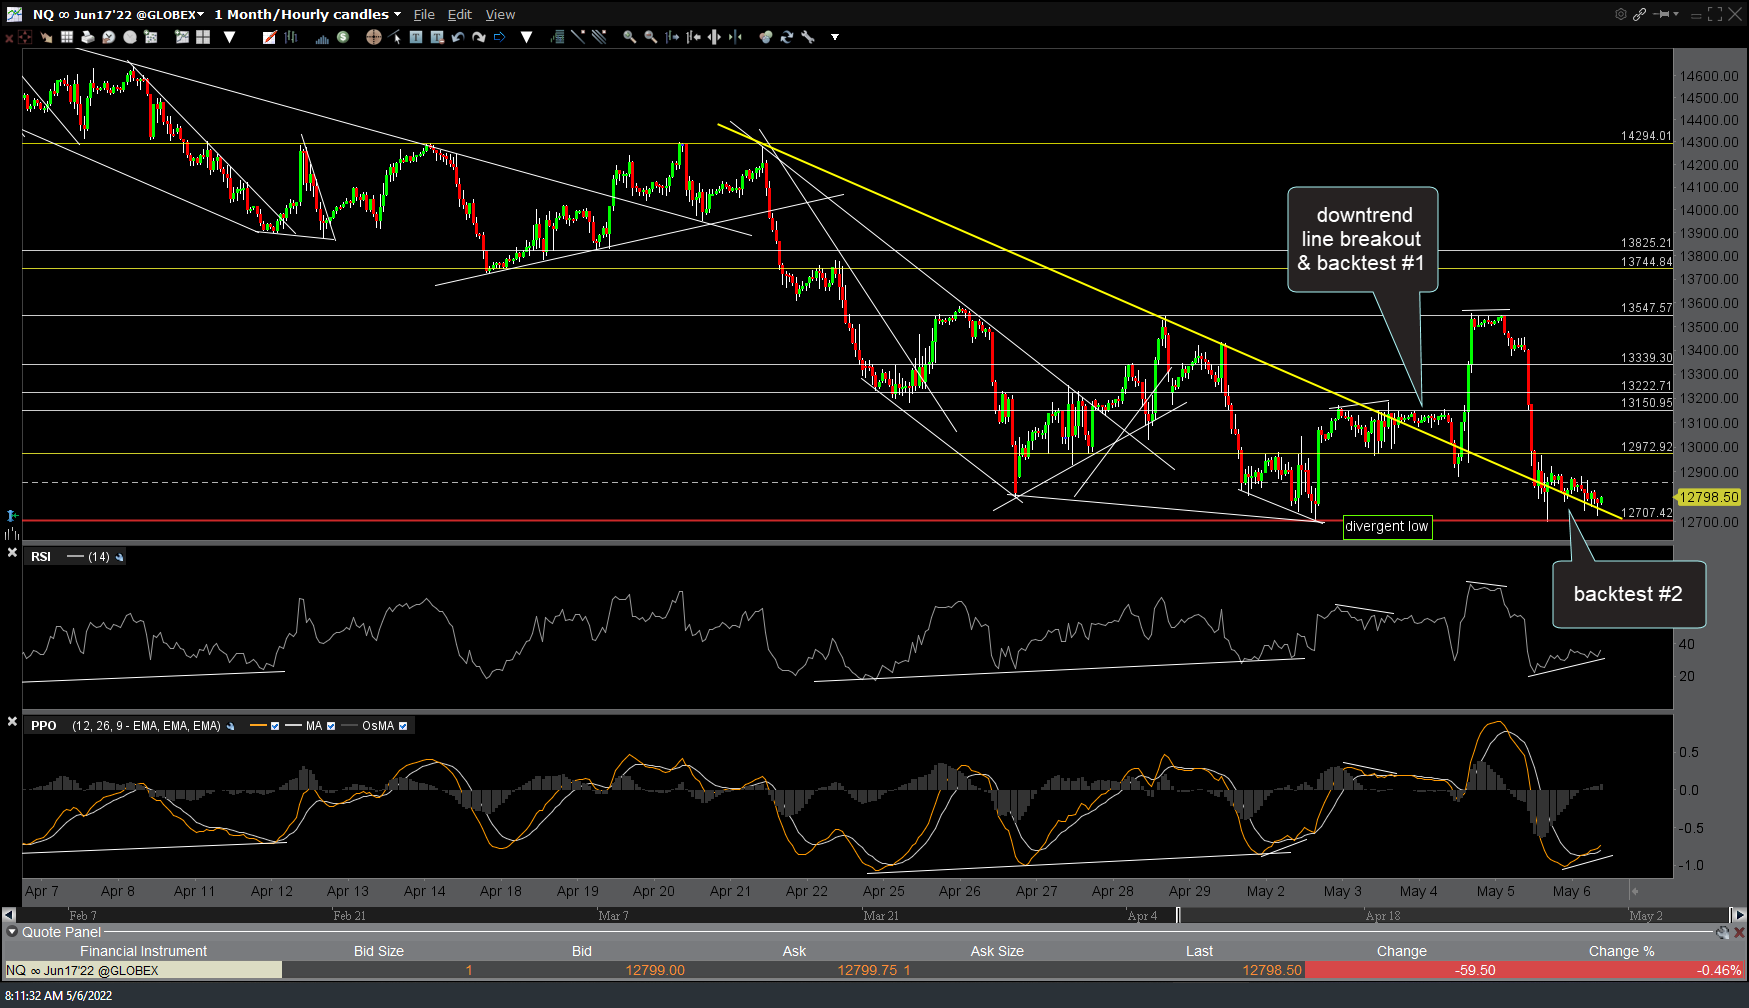
NQ 60m May 6th
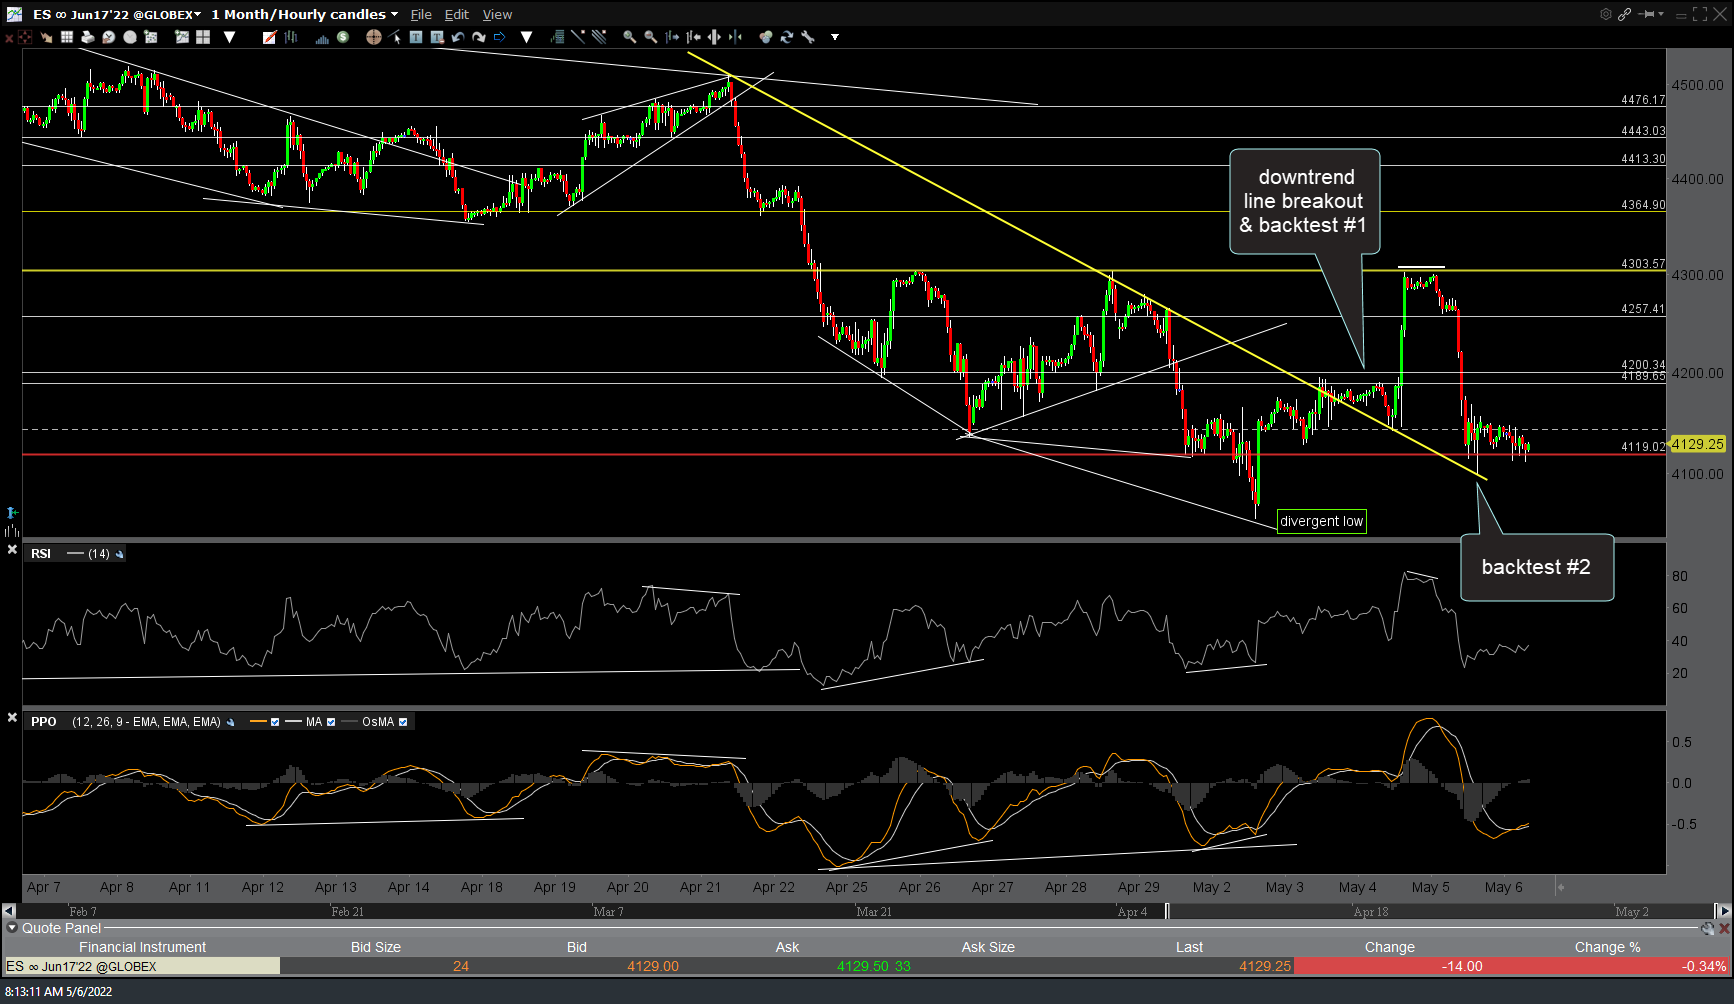
ES 60m May 6th
Should the major stock indices solidly take out the recent lows, which remains key support, other than the pure-play stock index and/or individual stock shorts, gold, Treasury bonds, & the $VIX tracking instruments (ETNs, futures, & options on those futures) are likely to do well.