Identifying & Incorporating Divergences Into Your Trading (video + static charts)
Identifying & Incorporating Divergences Into Your Trading (video + static charts)
Identifying divergences between the stock market & various indicators in order to help identify when to be on the look out for a trend reversal. Covered in this video are the charts of the Nasdaq 100, S&P 500, IWM (Russell 200) and the percentage of stocks trading above their 50-day moving average in the Nasdaq.
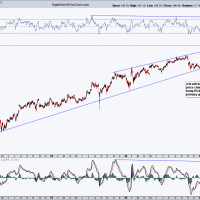
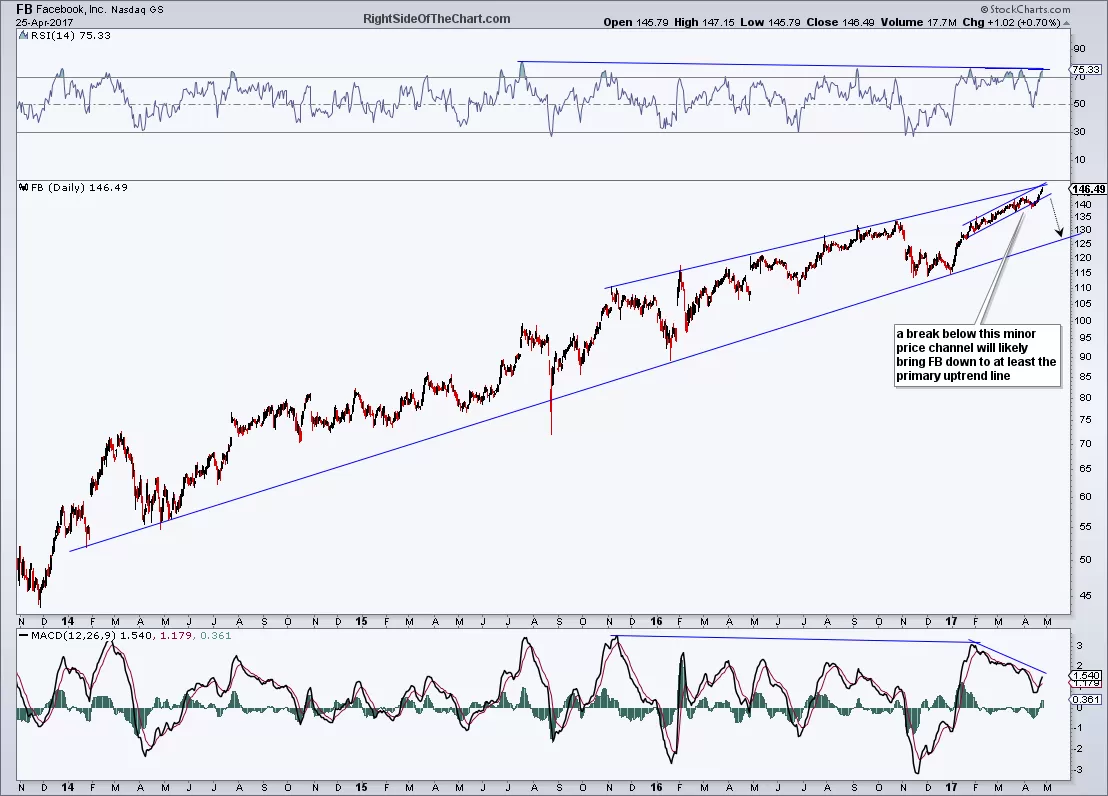
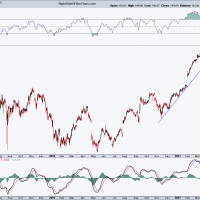
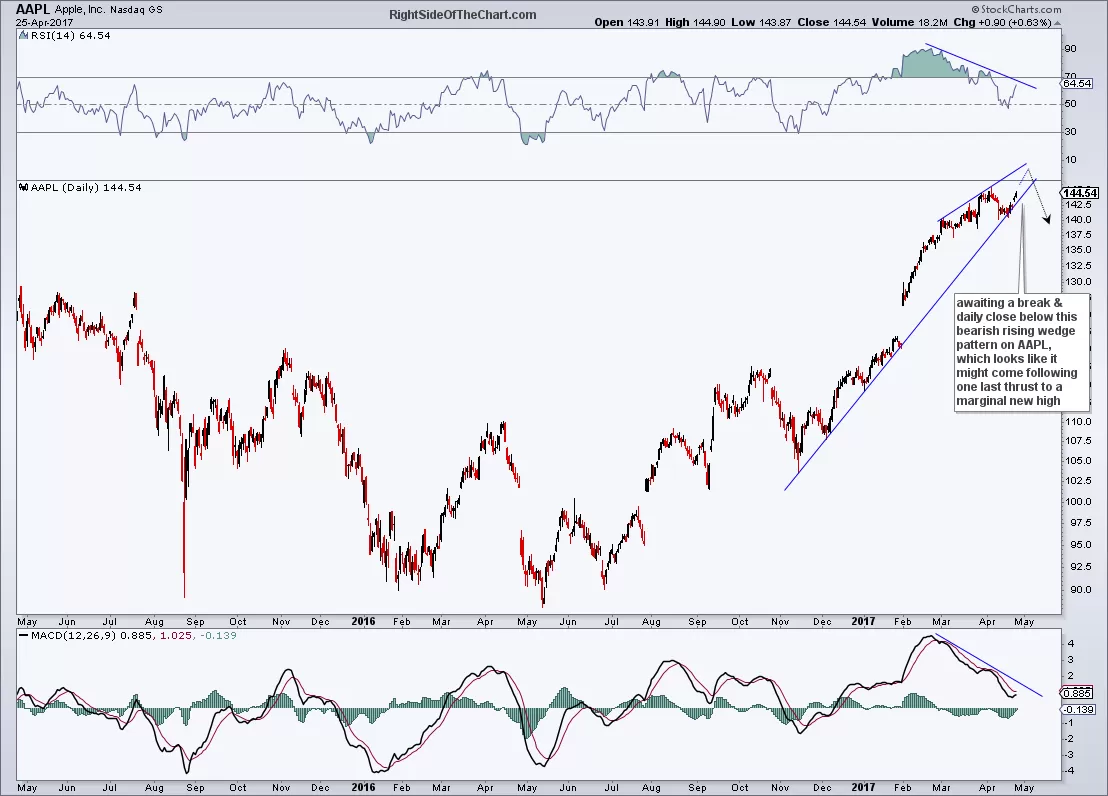
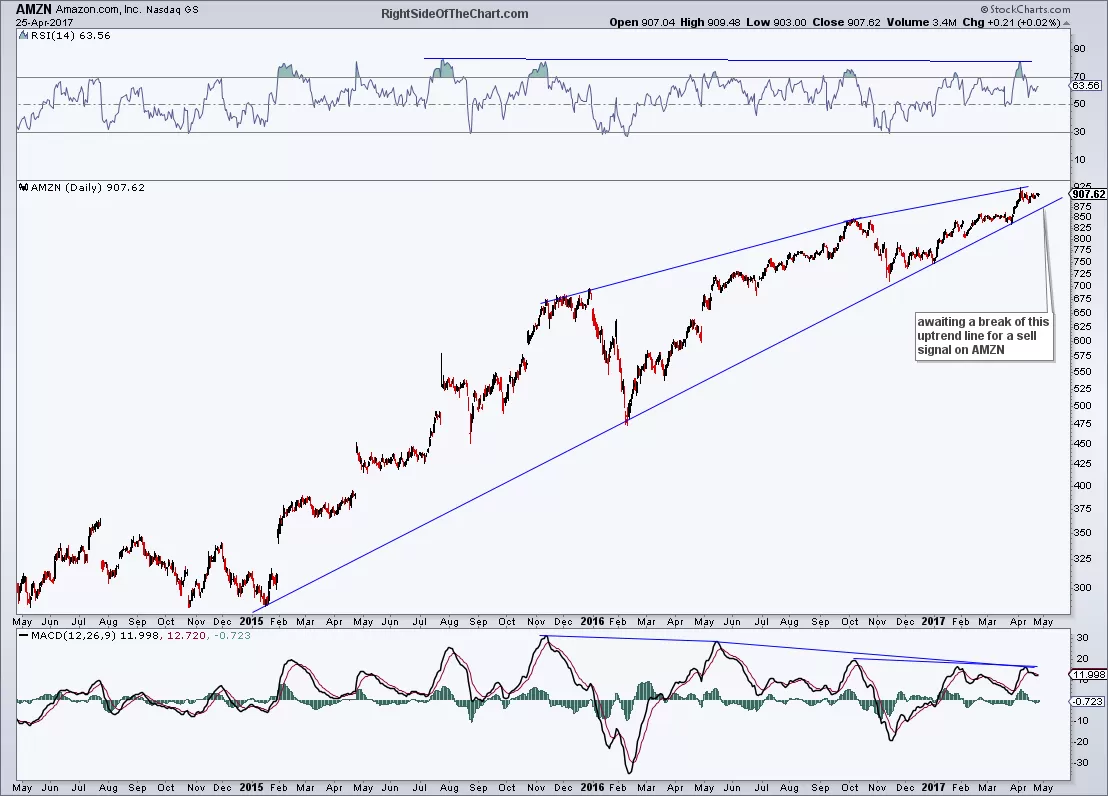
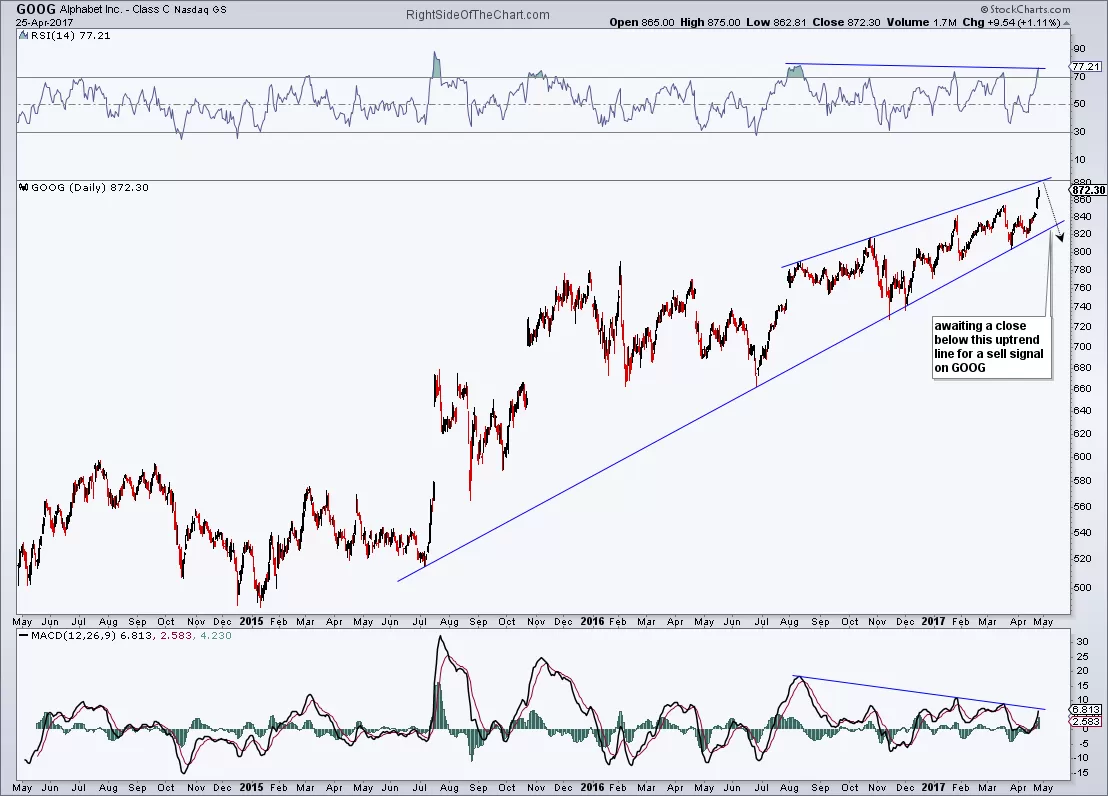
As discussed in the video, divergences are not buy & sell signals, merely an indication that a pending trend change is likely. Below are the daily charts & key support levels that I’m watching on the 5 market leading stocks that I refer to as the FAAMGs: Facebook, Apple, Amazon, Microsoft & Alphabet (GOOG) as they they break, the odds are very good that the market will breakdown along with them. Note how negative divergences have continued to build on both the RSI & MACD while remaining intact on each of these market leading stocks at this time.