
/E7 (Euro futures) broke out above the 1.1629 resistance level, sparking this rally up towards my next target around 1.688 & also sparking the breakout in /SI silver. 60-minute chart below.

E7 60m Oct 19th
As expected, /SI silver broke out above the primary downtrend line on the 120-minute chart followed by an impulsive rally into the next target/resistance of 24. Reaction here first or not, I still favor more upside in the coming weeks+. Should silver pullback, any backtest of the trendline from above would offer another objective long entry while a solid move above 24 would increase the odds of another thrust up to the next target around 24.867.
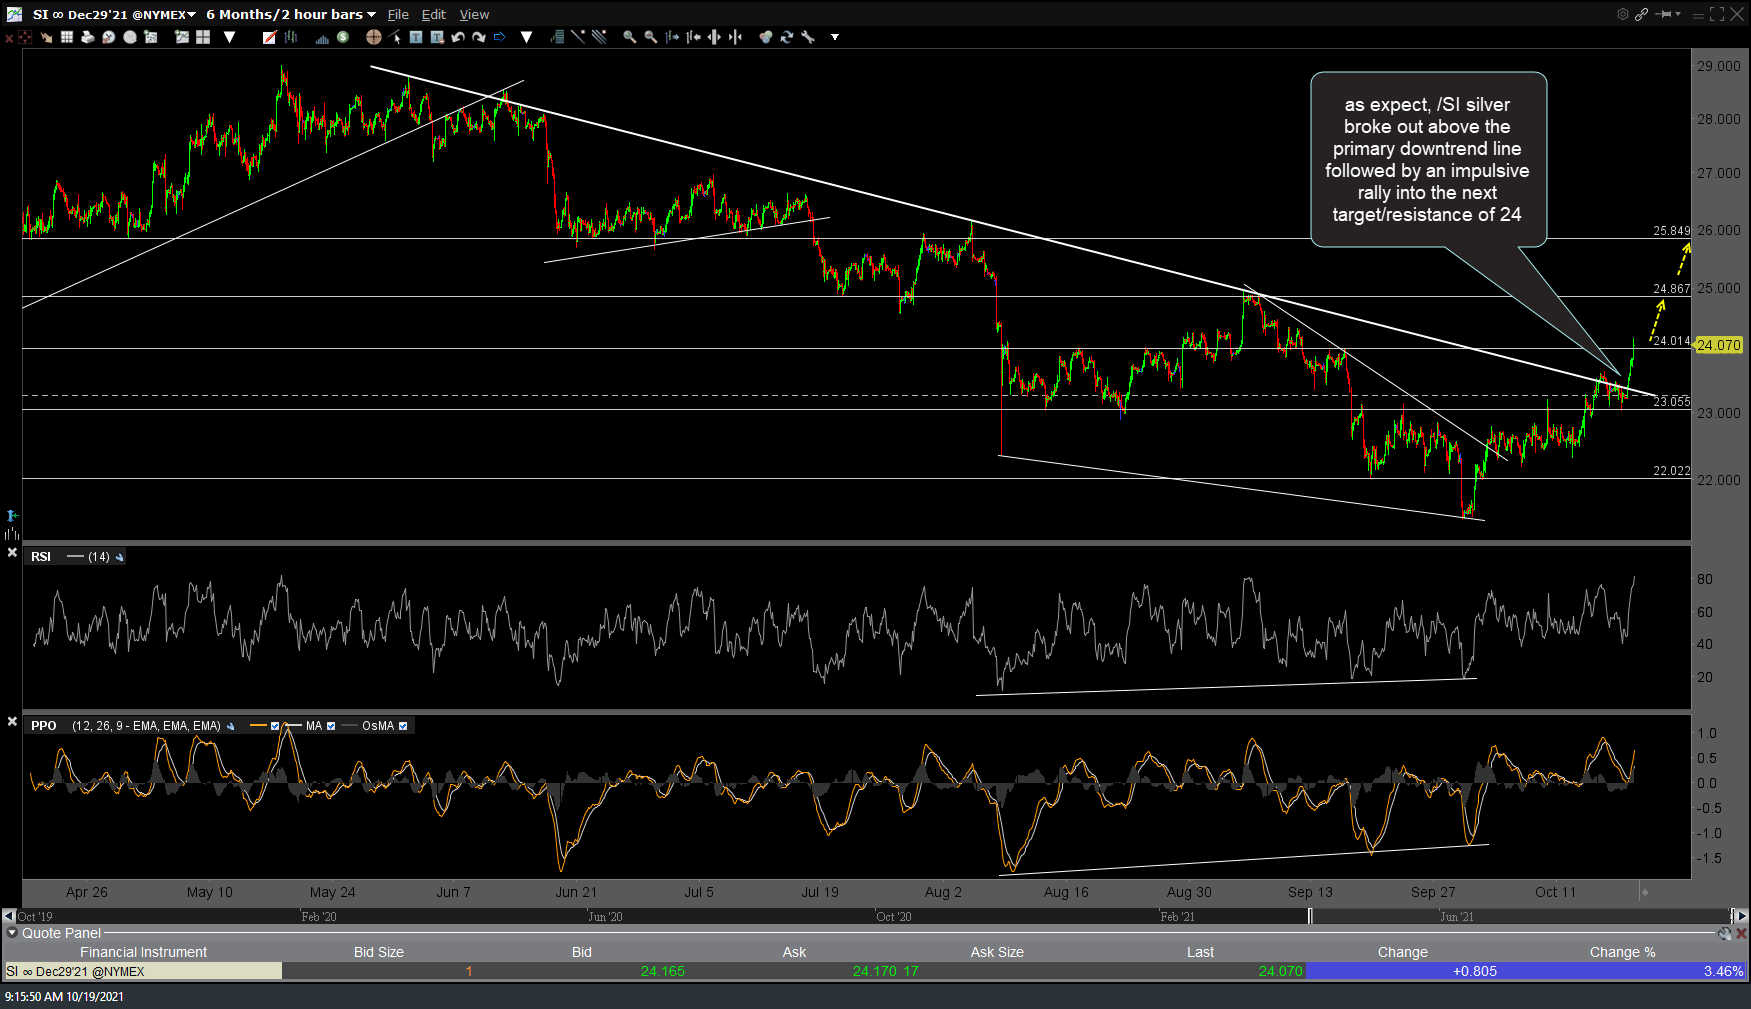
SI 120m Oct 19th
/GC gold remains above the downtrend line & still appears likely to zig-zag its way up towards at least the 1838 target. 120-minute chart below.
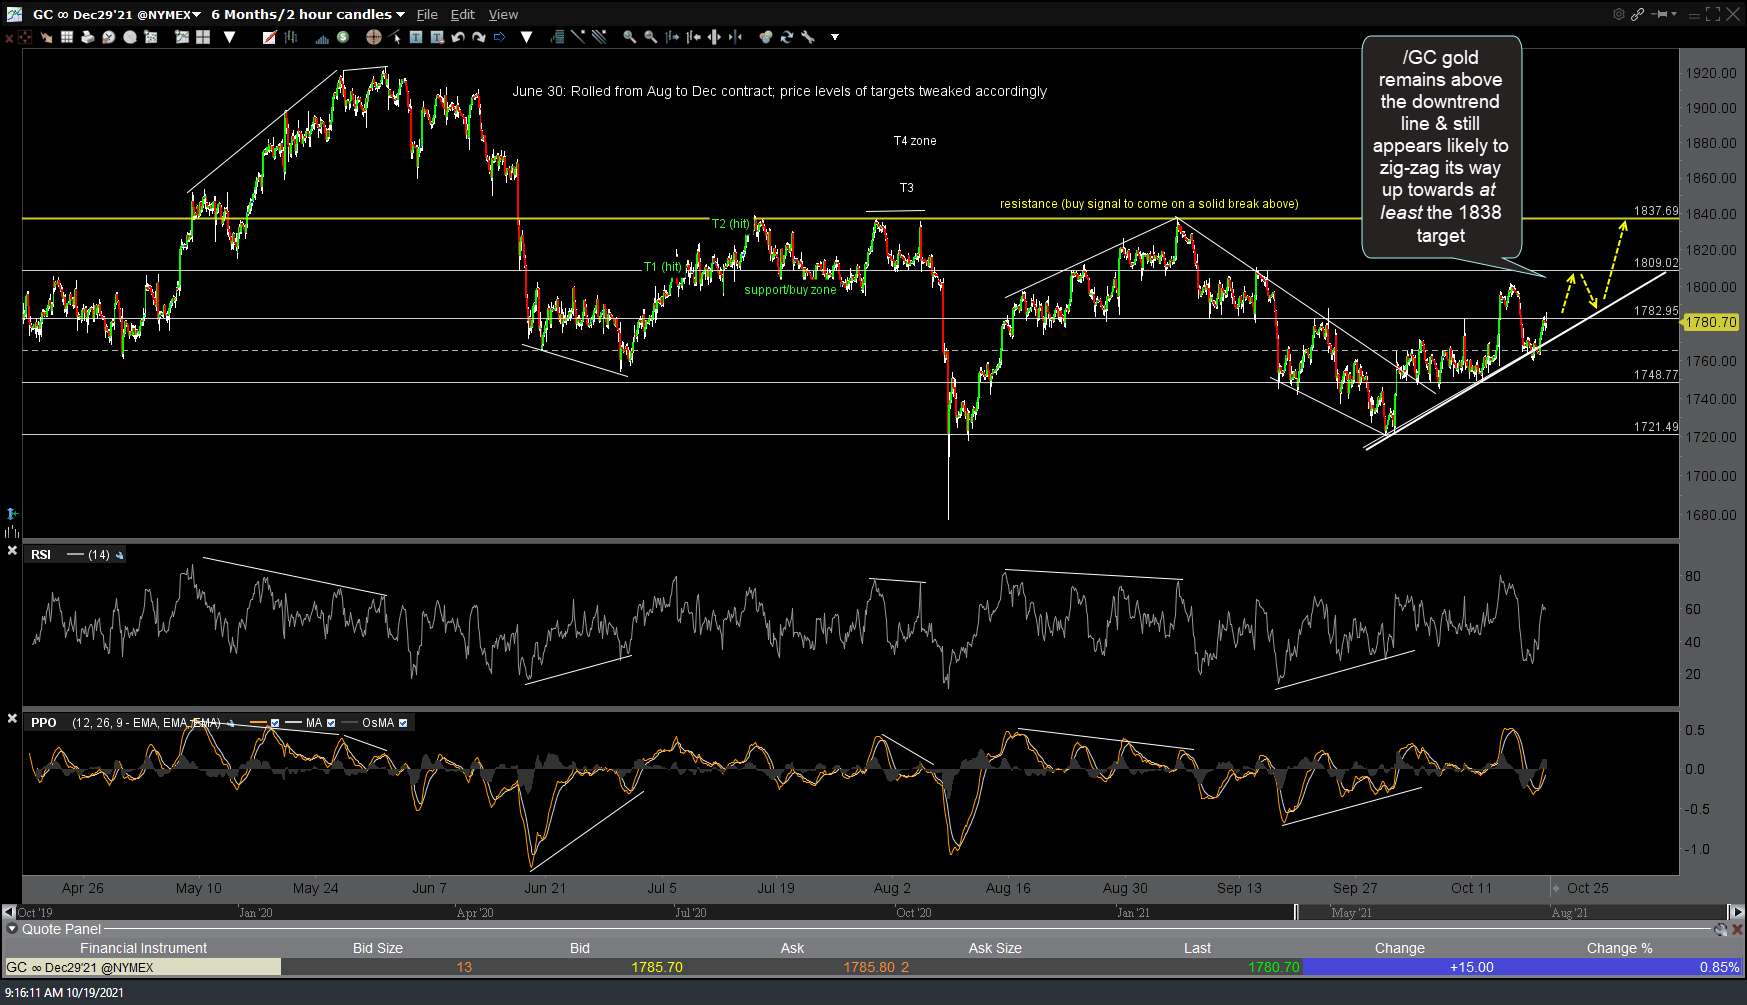
GC 120m Oct 19th
/NG (natural gas futures) has hit the next downside target (support) or 4.822 with the next sell signal to come on a solid break below it. Potential divergences on this 60-minute time frame could cause another counter-trend bounce soon but I still believe a major top was recently put in with more downside in the coming weeks+.

NG 60m Oct 19th
This backtest of the 60-minute bearish rising wedge in /CL crude oil following the recent breakdown offers another objective short entry or add-on. SCO is the -2x (inverse/short) ETN for crude oil.
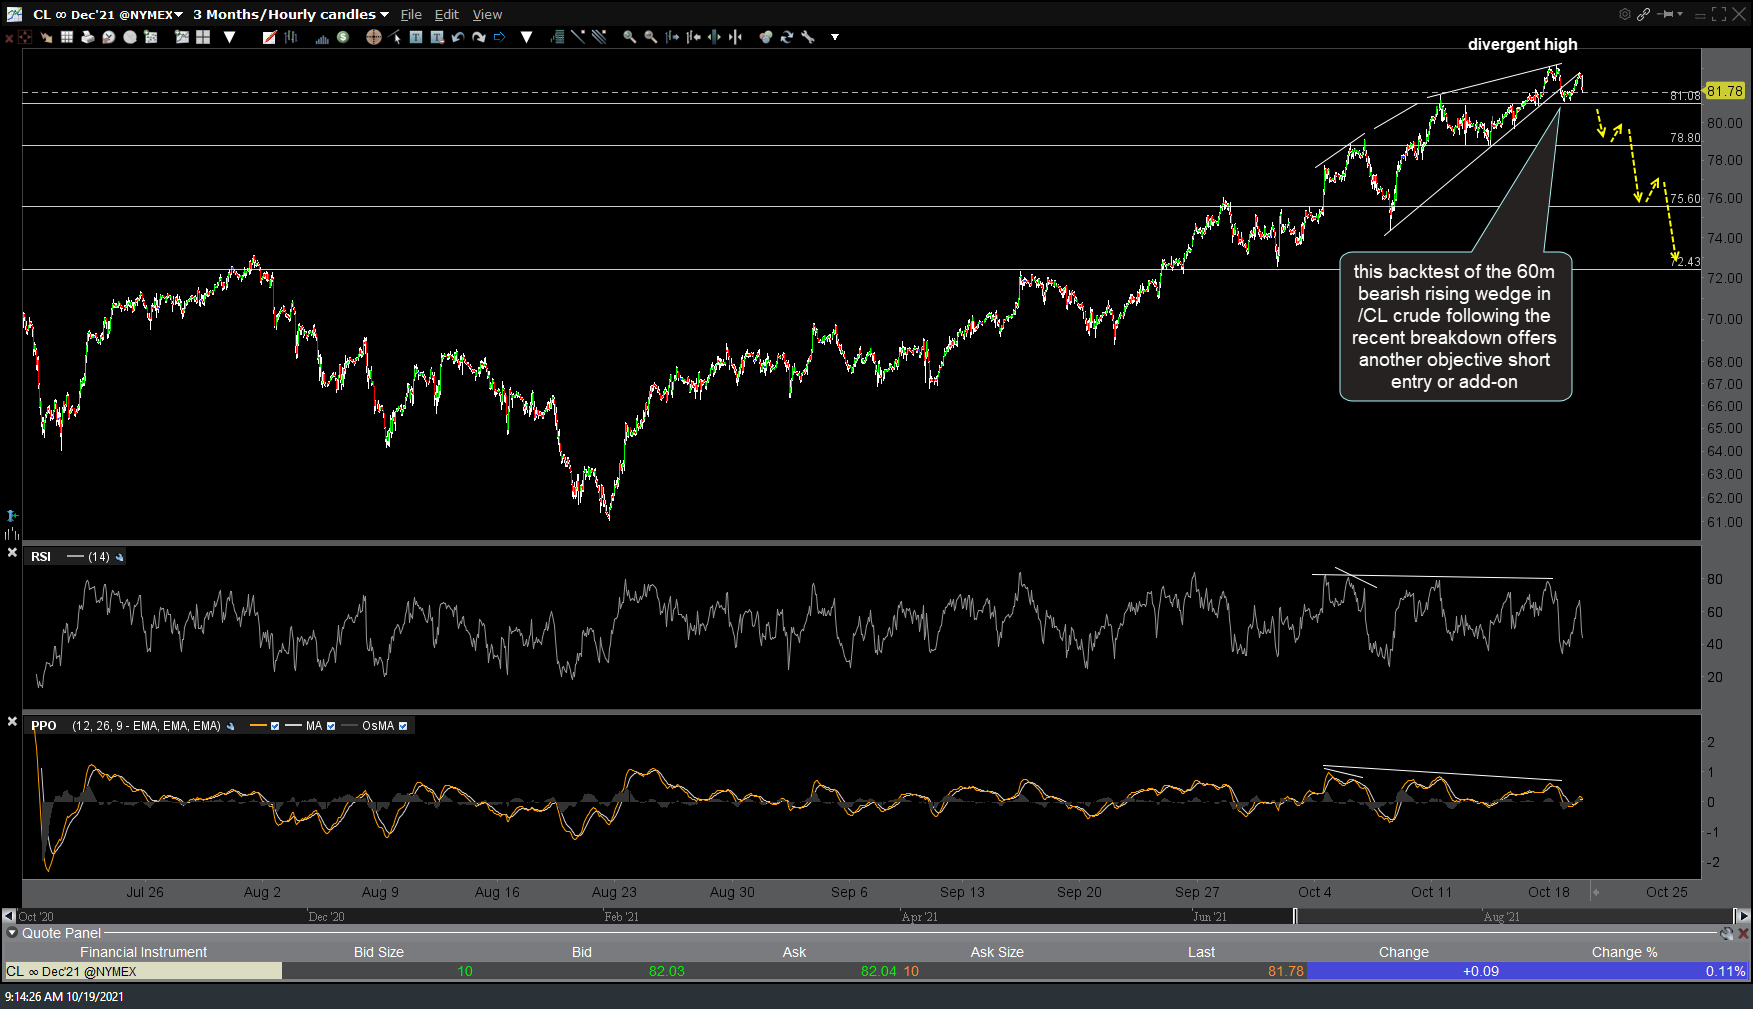
CL 60m Oct 19th