
Following the recent whipsaw/false breakdown, the EUR/USD has made a solid breakdown confirmed by more than just a few candlesticks, as with the previous breakout. This breakout also occurred in the “sweet spot” where most wedge breakdowns typically occur (about 65-80% towards the apex of the wedge).
With the Euro representing a whopping 57.6% of the US Dollar index, should this scenario play out in the coming days, GLD & GDX are likely to move substantially lower as a gold generally moves inversely to the $USD. Also note that the US Dollar & US Equities have shown a strong direct correlation in recent years. Hence, should the $USD rally in the coming days, that would likely lift equity prices, further exacerbating an unwinding of the recent flight-to-safety bid that gold & GDX have benefited from. EUR/USD 60-minute chart:
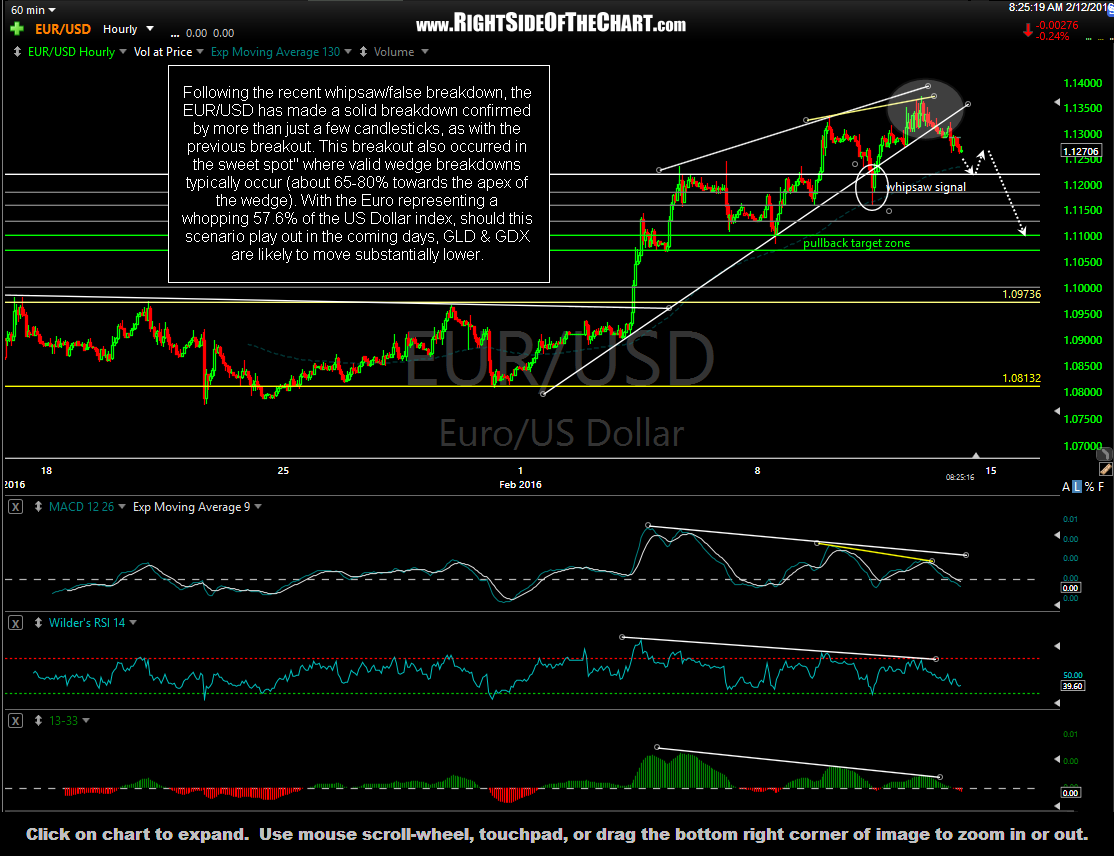
EUR-USD 60-minute Feb 12th