
/CL (crude futures) hit the bottom of my second price target zone (58.85) with a brief momentum-fueled overshoot & reversal with crude ending the regular session exactly on the top of the zone (59.47). Updated 60-minute chart below.

CL 60m 3 March 18th
This 120-minute (2-hour candlesticks) chart shows the impulsive drop following today’s breakdown below both horizontal price support as well as the primary uptrend line with /CL parking on the 2nd price target/support. The marked levels below are potential swing targets should crude take out today’s lows.
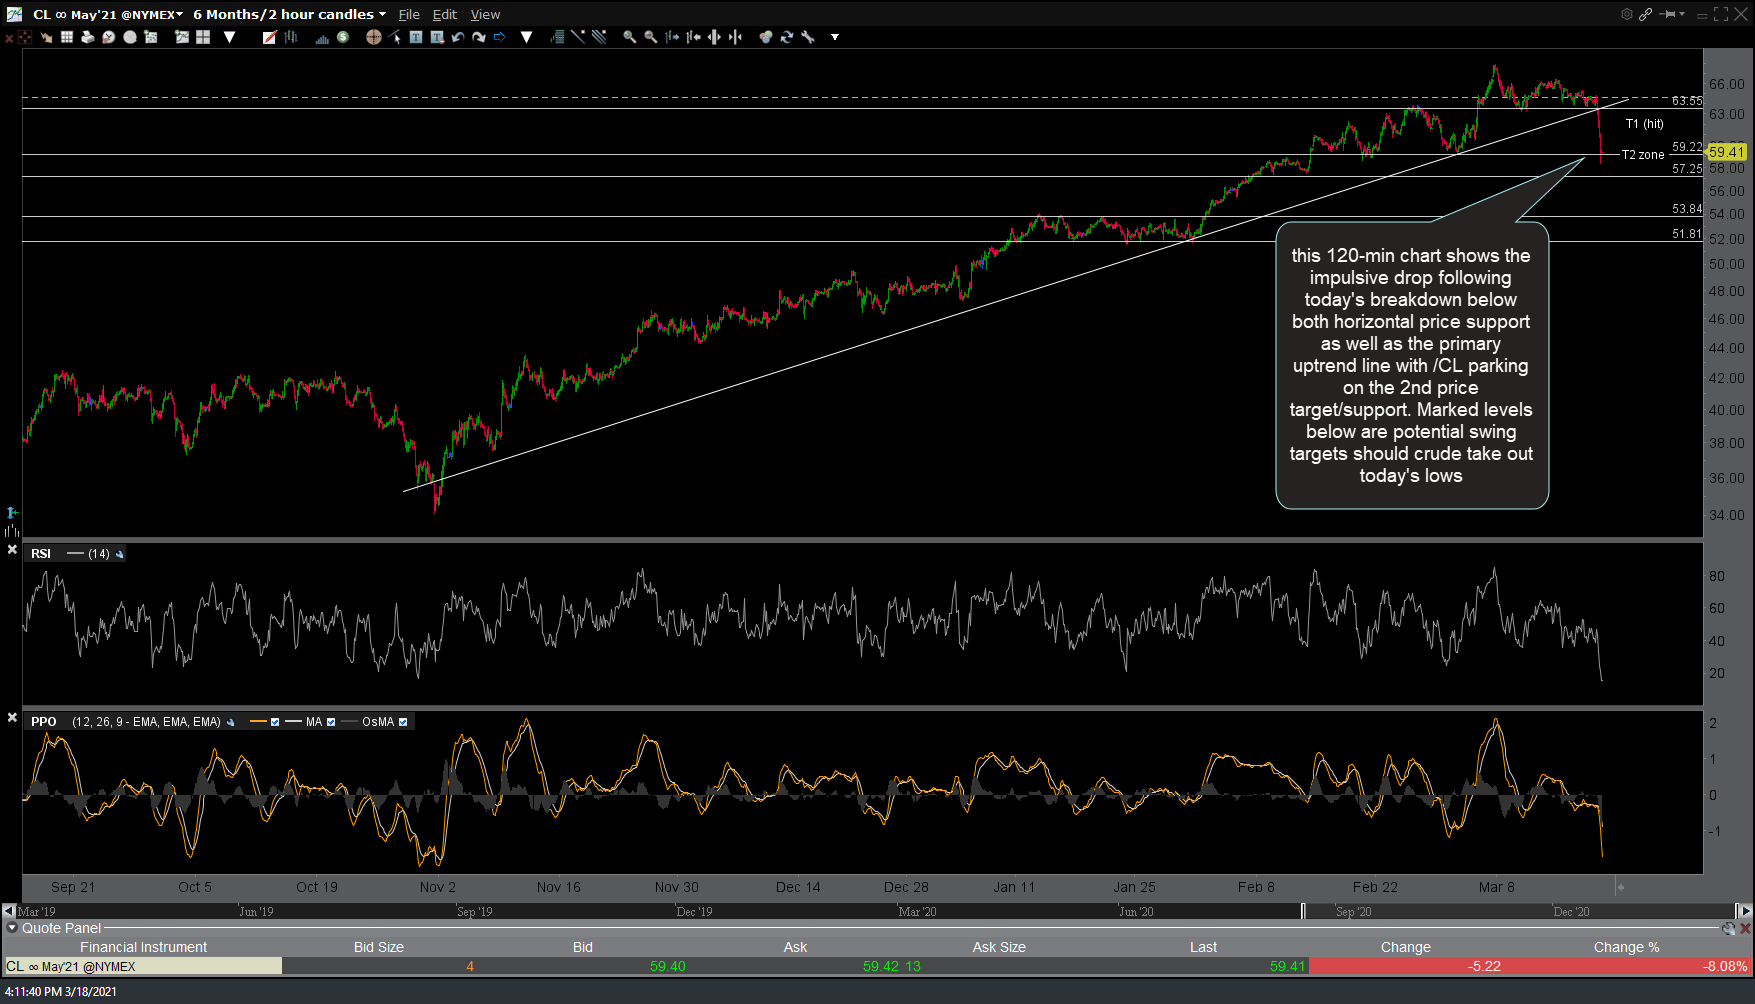
CL 120m March 18th
On a closely related note, today’s impulsive follow-thru to yesterday’s breakdown & close below the primary uptrend line in UGA (gasoline ETP) increases the odds that my 27.20ish minimum target laid out in yesterday’s video will likely be hit in the coming days to weeks.

UGA daily March 18th
As of today, we have the early makings of a potential bear trap/false breakdown in the $VIX (CBOE Volatility Index). Should we get additional downside in the stock market, $VIX is likely to rally up to any of all of these potential price targets.

VIX daily March 18th
If the bearish scenario for the stock market continues to play out in the coming weeks, price targets for VXX (short-term VIX futures ETN) are shown at the arrow breaks on the daily chart below.
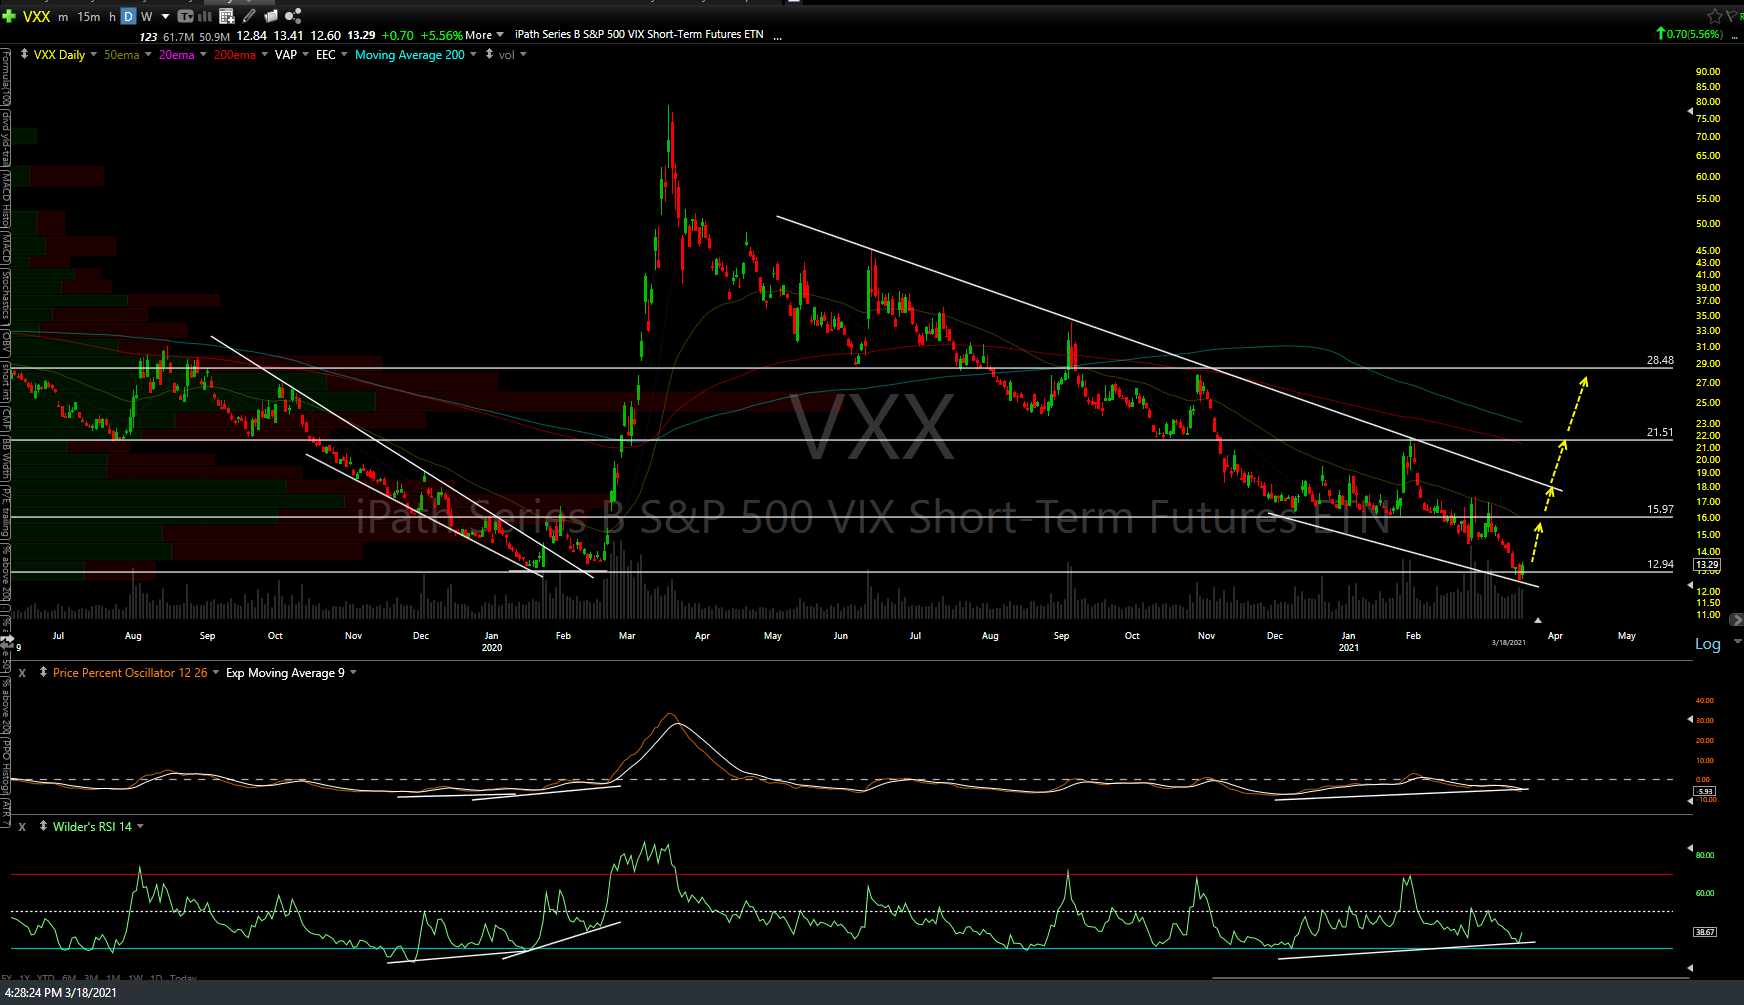
VXX daily March 18th
The semiconductor sector looks poised for more downside in the coming days/weeks following the recent breakdown & backtest of the primary uptrend line on SOXX (semiconductor ETF) after putting in a divergent high.
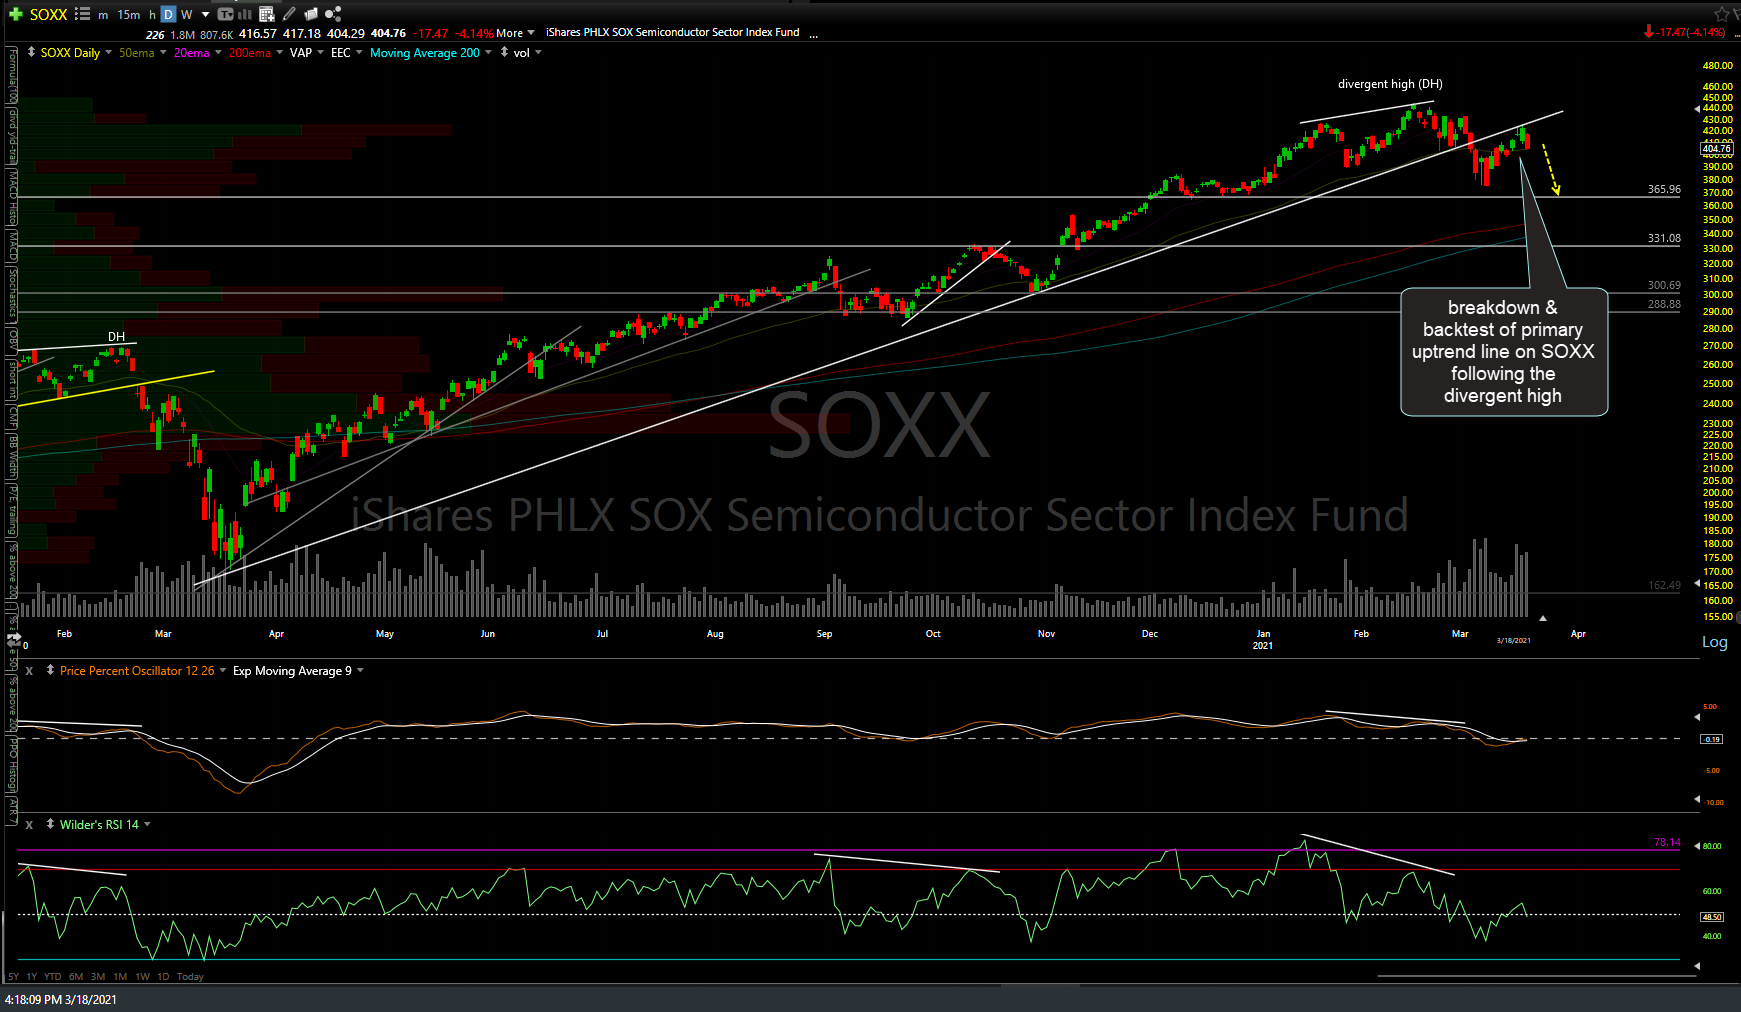
SOXX daily March 18th