End-of-session technical analysis of the major stock indices, semiconductor sector, market-leading stocks, as well as long-term analysis of interest rates & the stock market.
Towards the end of the video I covered the long-term trend in interest rates (via Treasury bond yields) as well as one the more recent explanations for the stock market & economy not responding to the relative sharp increases in the Federal Funds rate over the past 16 months. What I meant to cover but left out of the video was the current technical posture of the 10 & 30-yr Treasury bond yields.
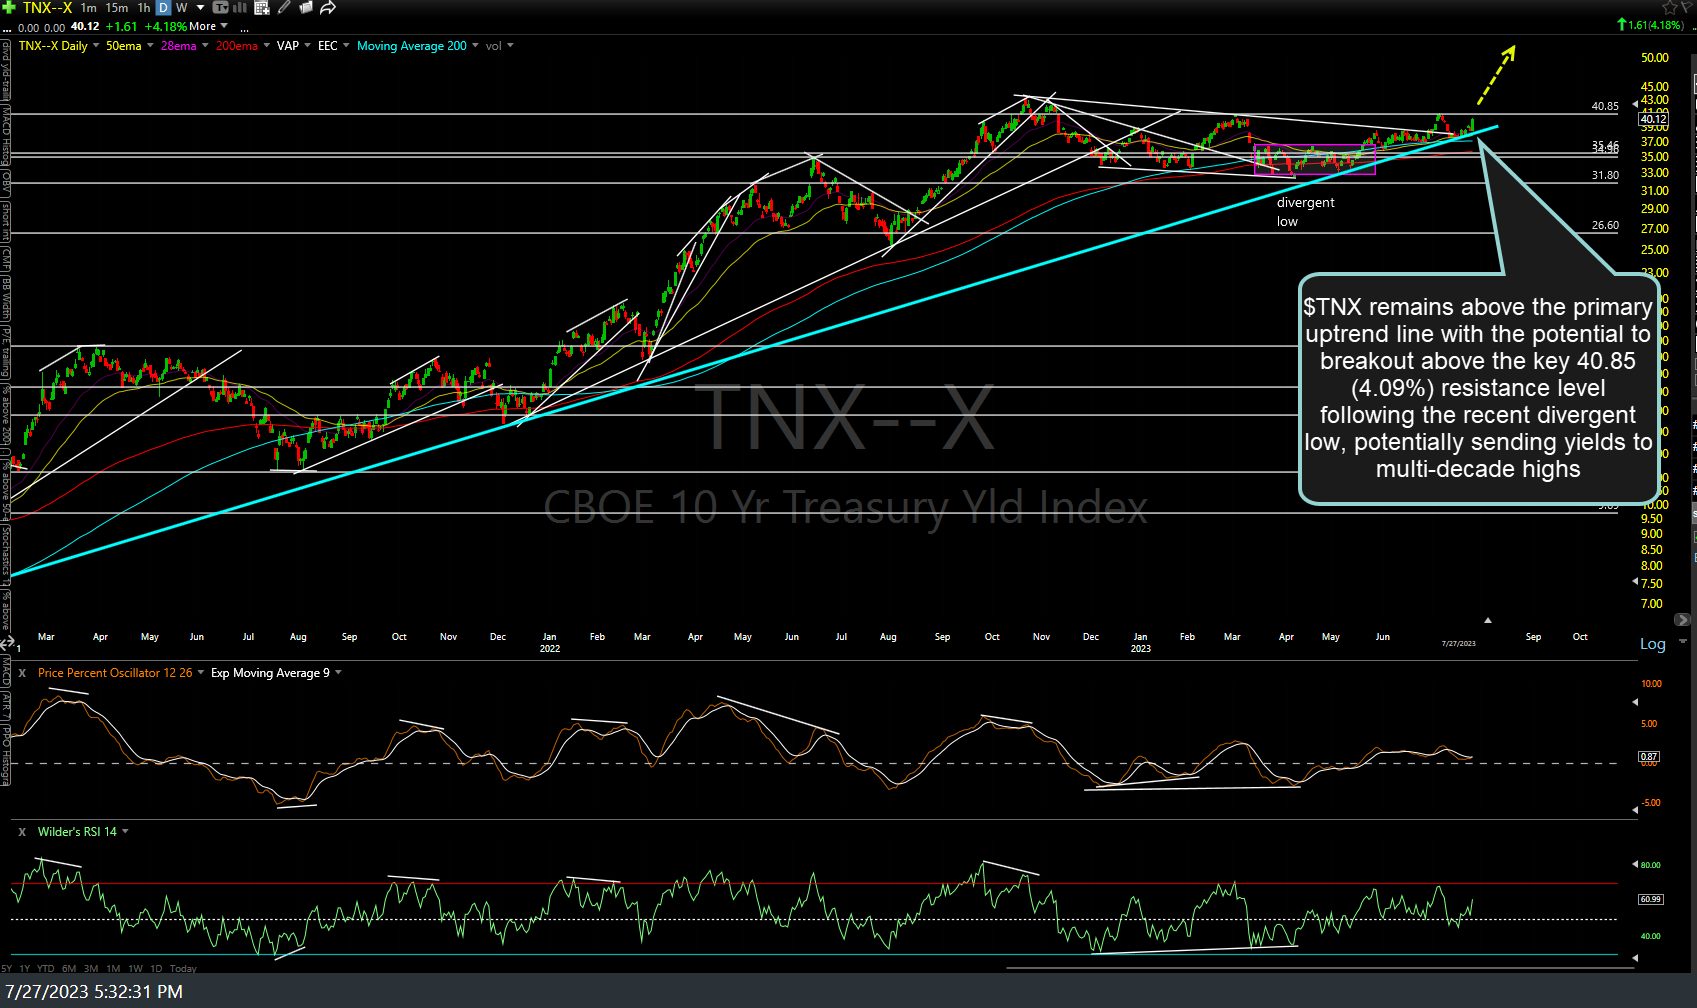
$TNX (10-year Treasury bond yield) remains above the primary uptrend line with the potential to breakout above the key 40.85 (4.09%) resistance level following the recent divergent low, potentially sending yields to multi-decade highs. Daily chart below.
$TYX (30-yr Treasury bond yield) remains above symmetrical triangle (blue lines) with the potential to breakout above the key 40.33 (4.03%) resistance level following the recent divergent low, potentially sending yields to multi-decade highs. New highs in Treasury yield substantially beyond the recent trading ranges over the past year would most likely cause significant real & perceived (psychological/market sentiment) headwinds for the economy & stock market. Daily chart below.
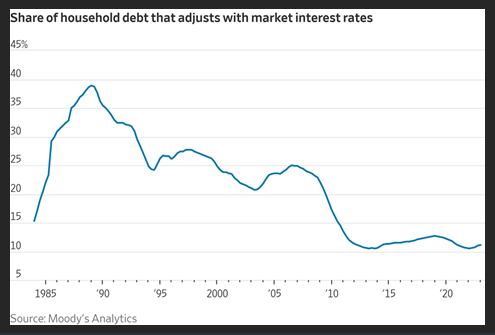
One reason cited for the lack of the economy’s response to rising interest rates this time around is the fact that many consumers & businesses took advantage of the extended period of ultra-low rates to lock in vs. going with adjustable rate loans, as was more common in the past and are not yet feeling the pinch. As such, the Fed may not be factoring in the additional lag time before higher rates kick in this time around, causing them to pump too much medicine into the patient before the effects finally kick in.


