
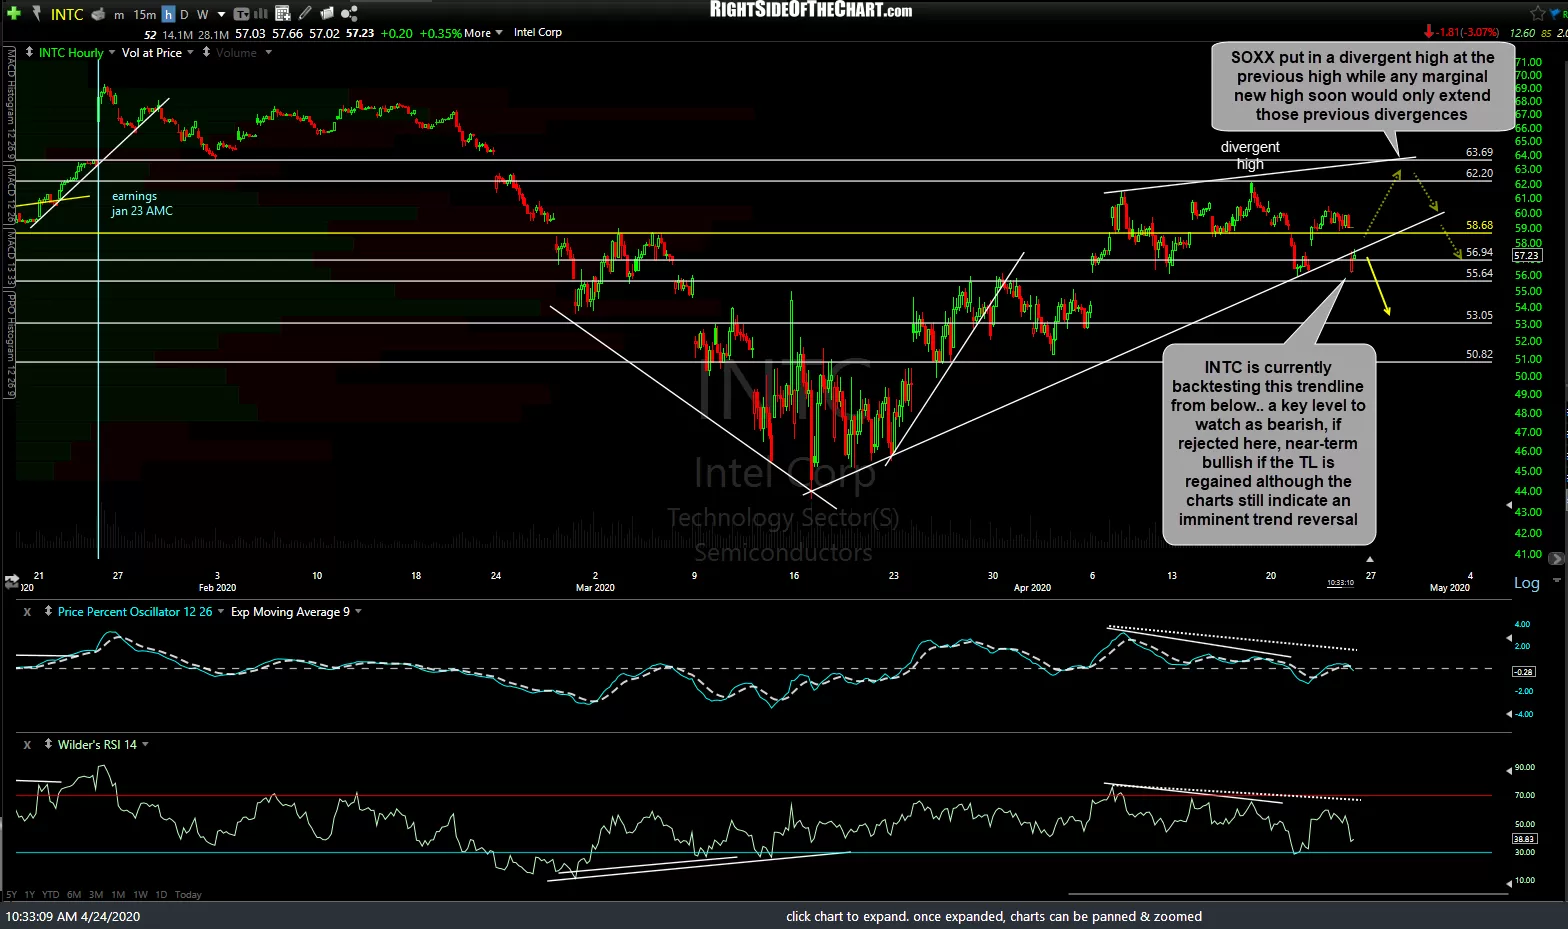
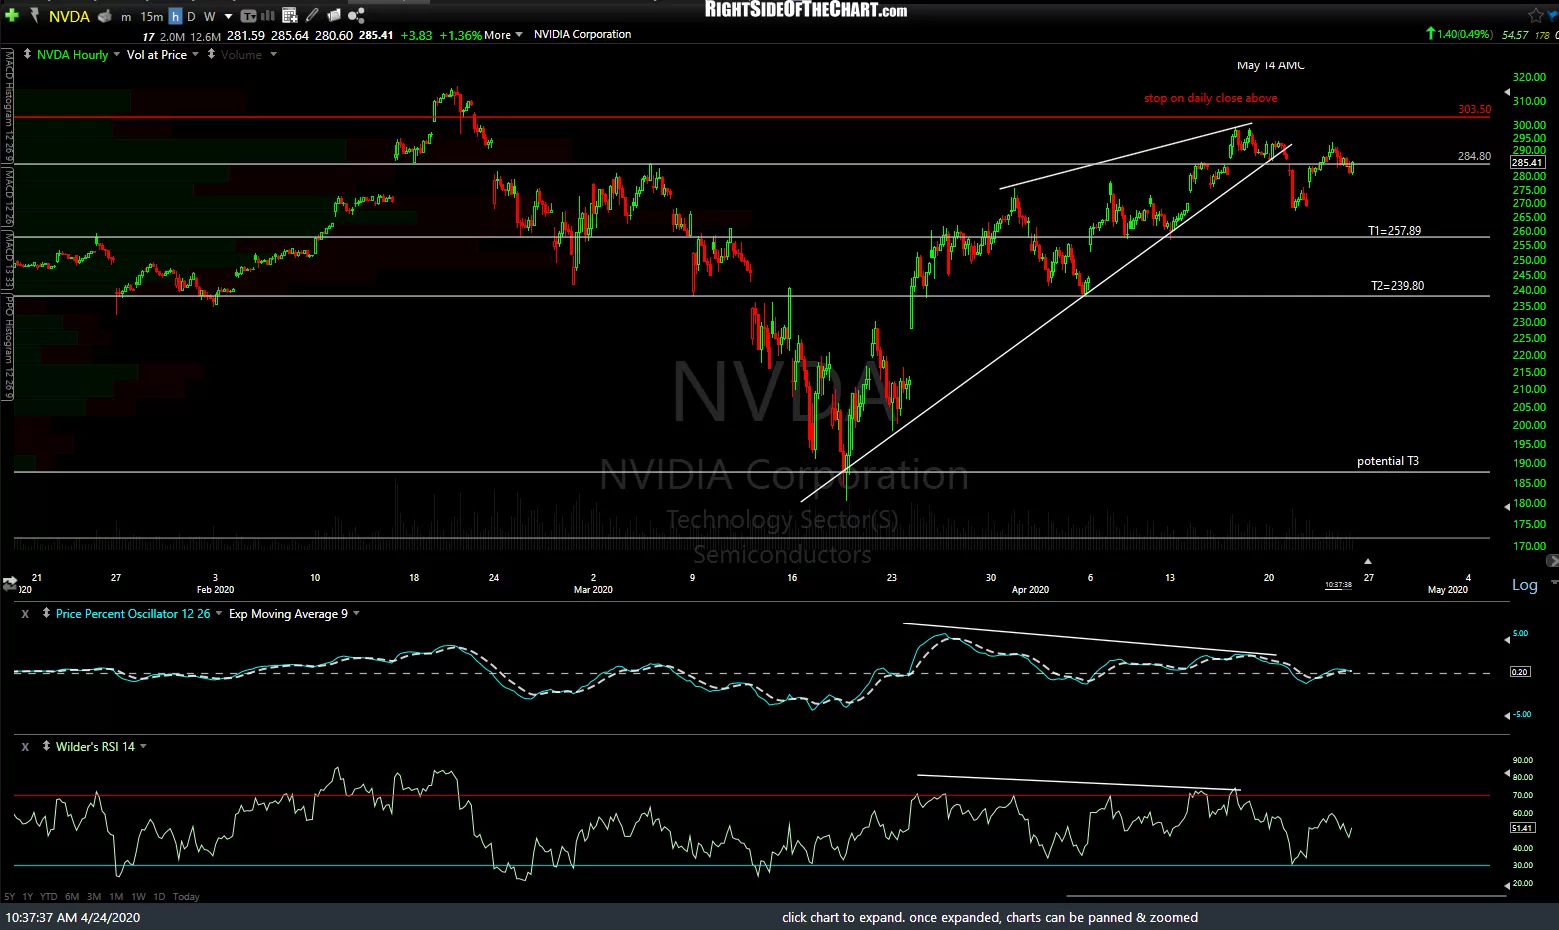
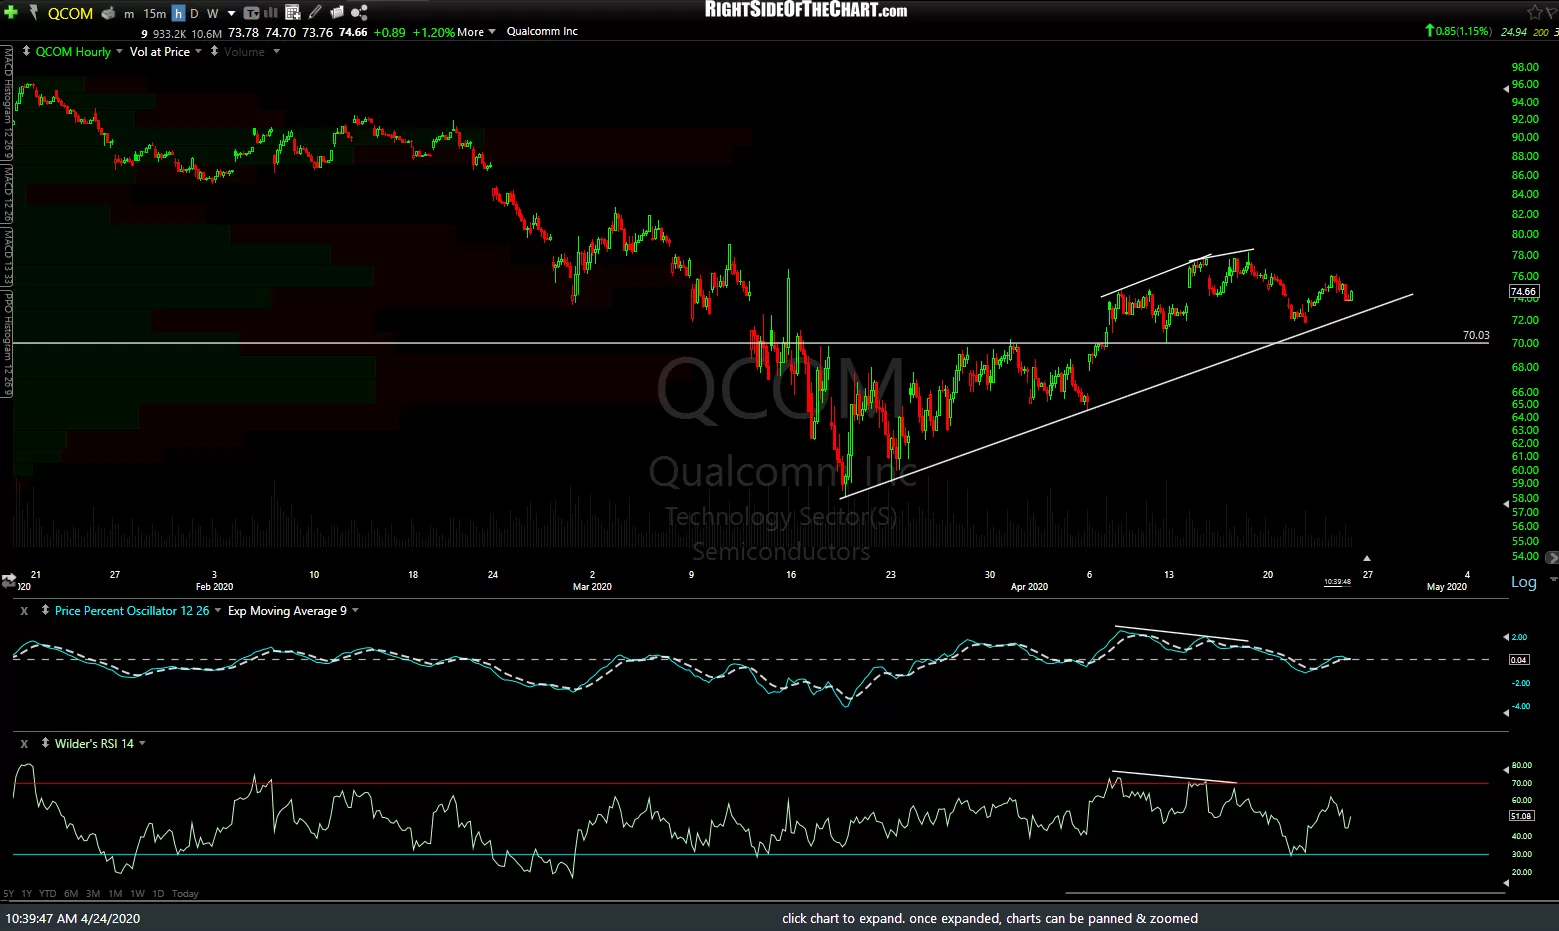
The 60-minute charts of QQQ (Nasdaq 100 ETF), SOXX (PHLX SOX Semiconductor Sector ETF), and several of the largest semiconductor stocks within that sector can be viewed below. Most have nearly identical technical postures: Walking up trendline support with negative divergence in place at the recent highs with those divergences only to be extended, should they continue to rally to put in a marginal new high anytime soon.
-
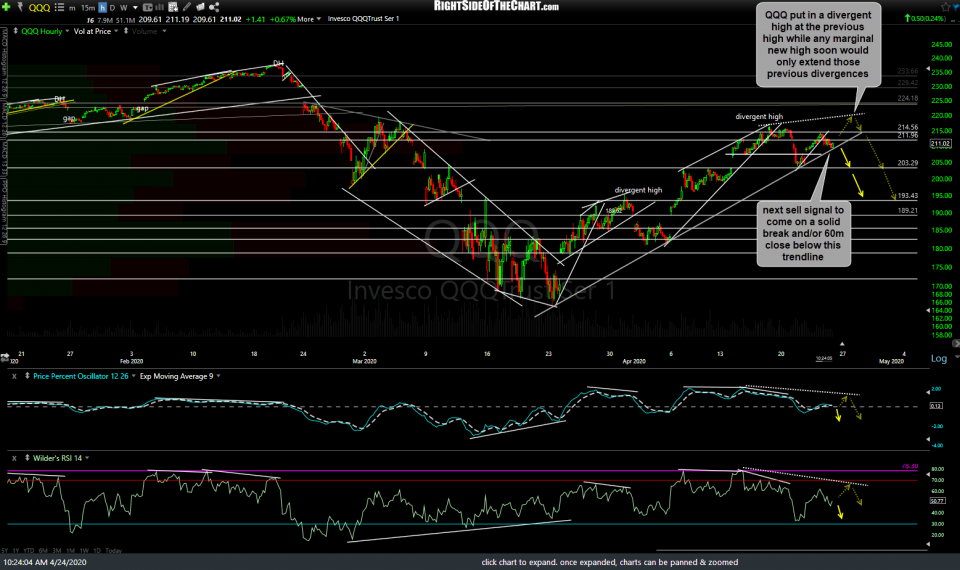
- QQQ 60m April 24th
-
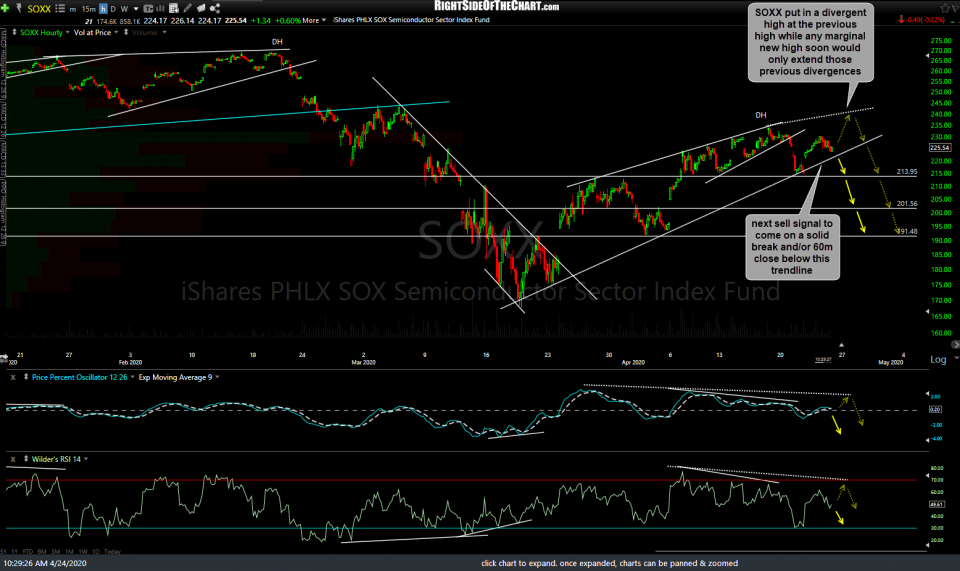
- SOXX 60m April 24th
-
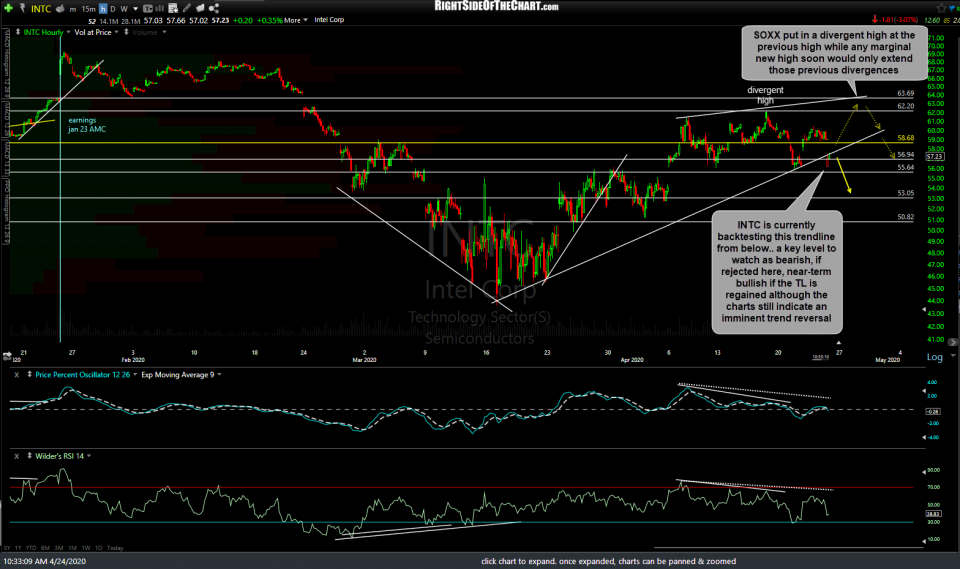
- INTC 60m April 24th
-
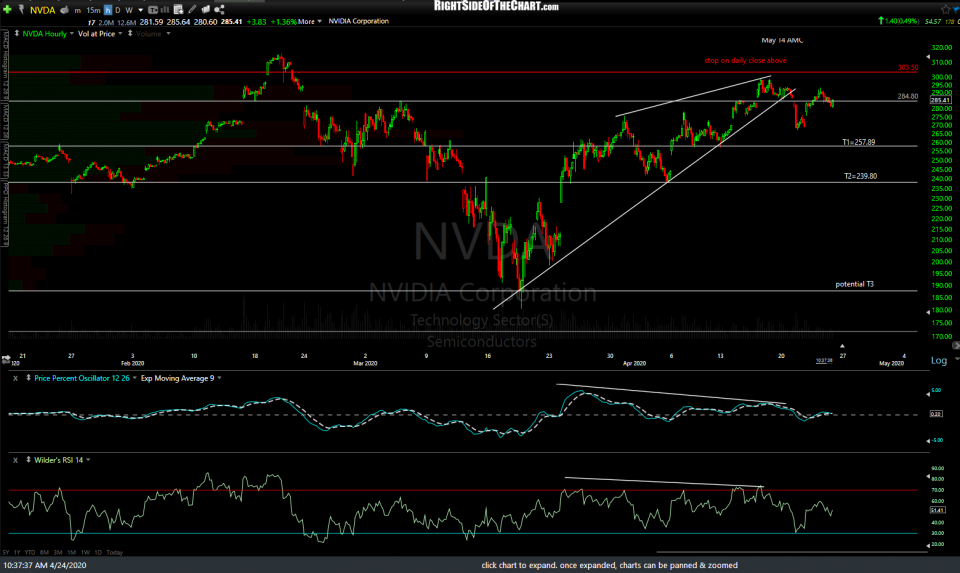
- NVDA 60m April 24th
-
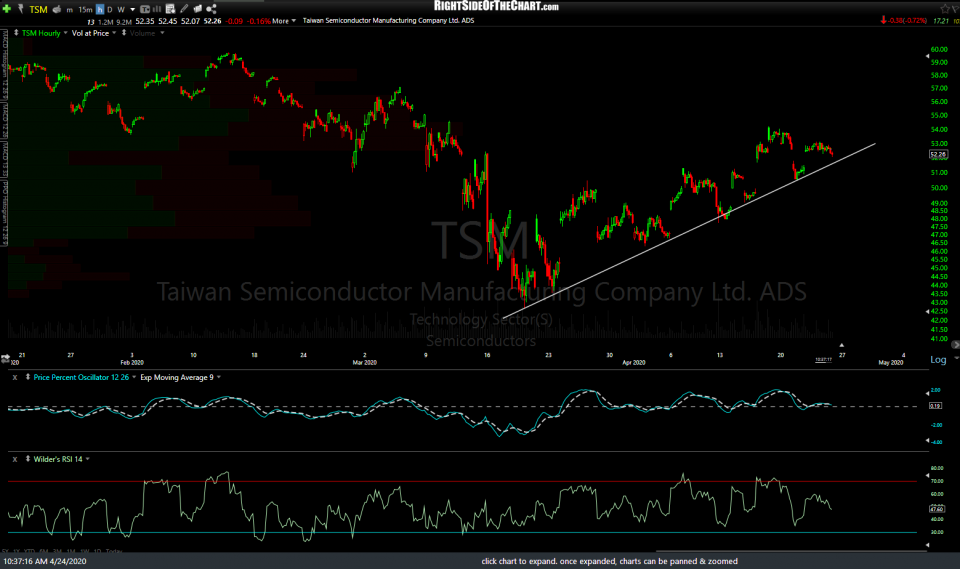
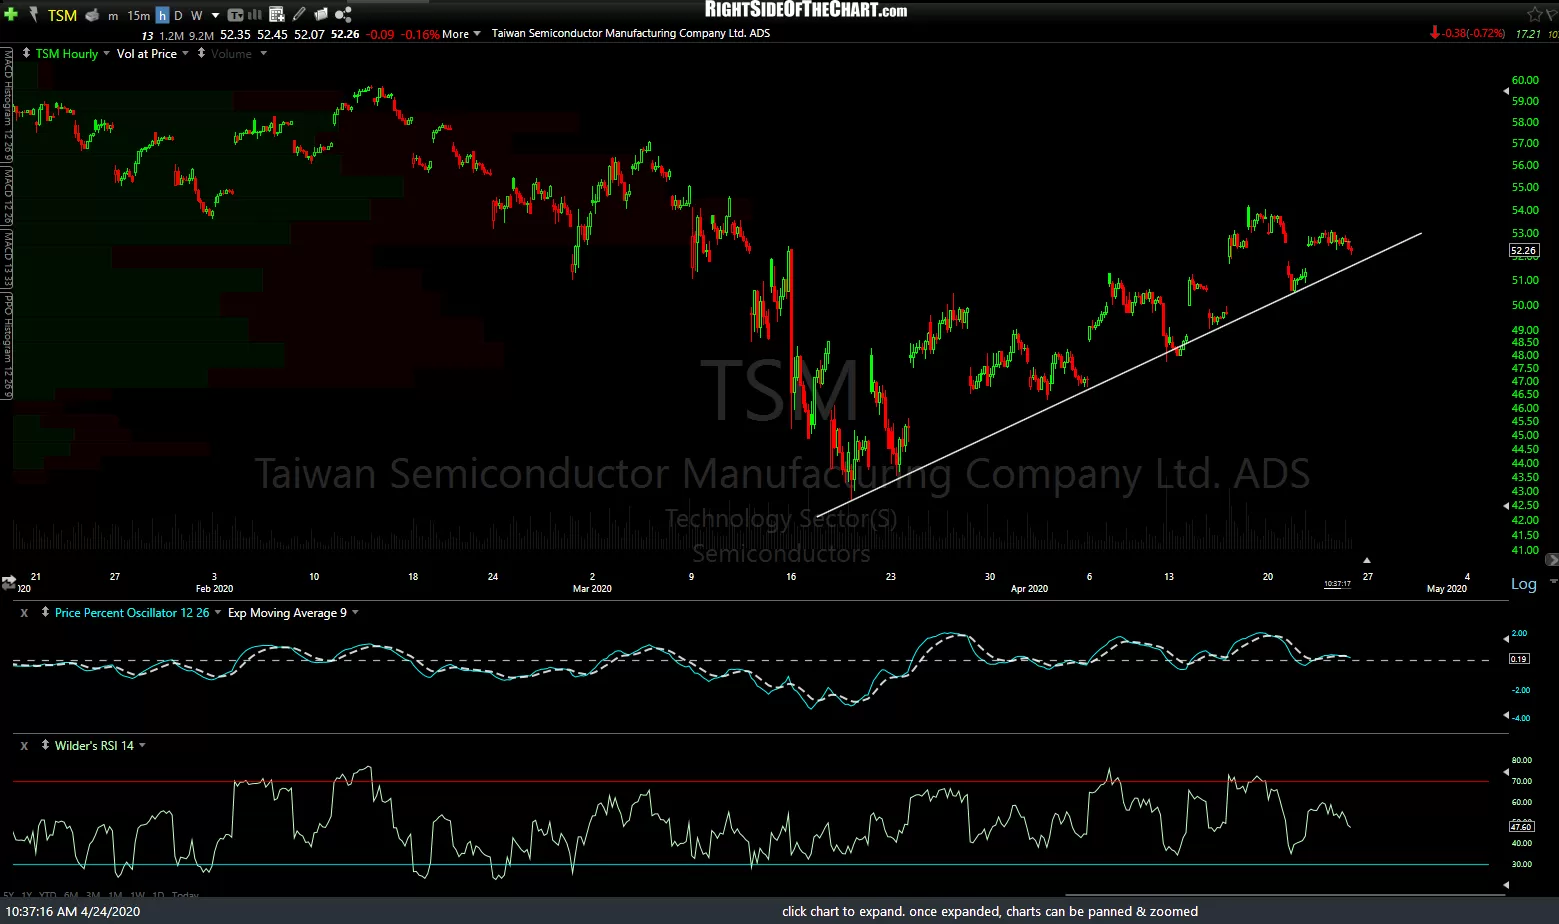
- TSM 60m April 24th
-
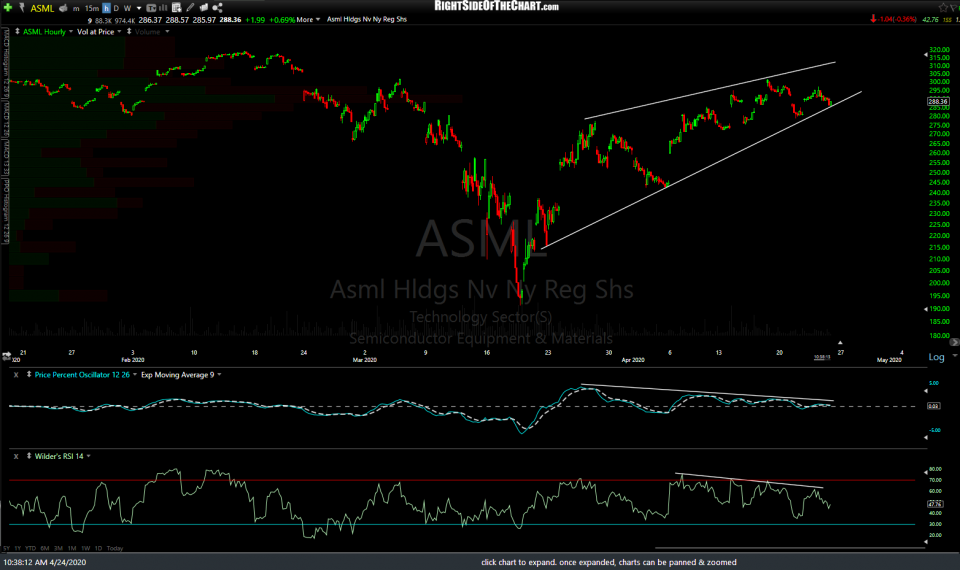
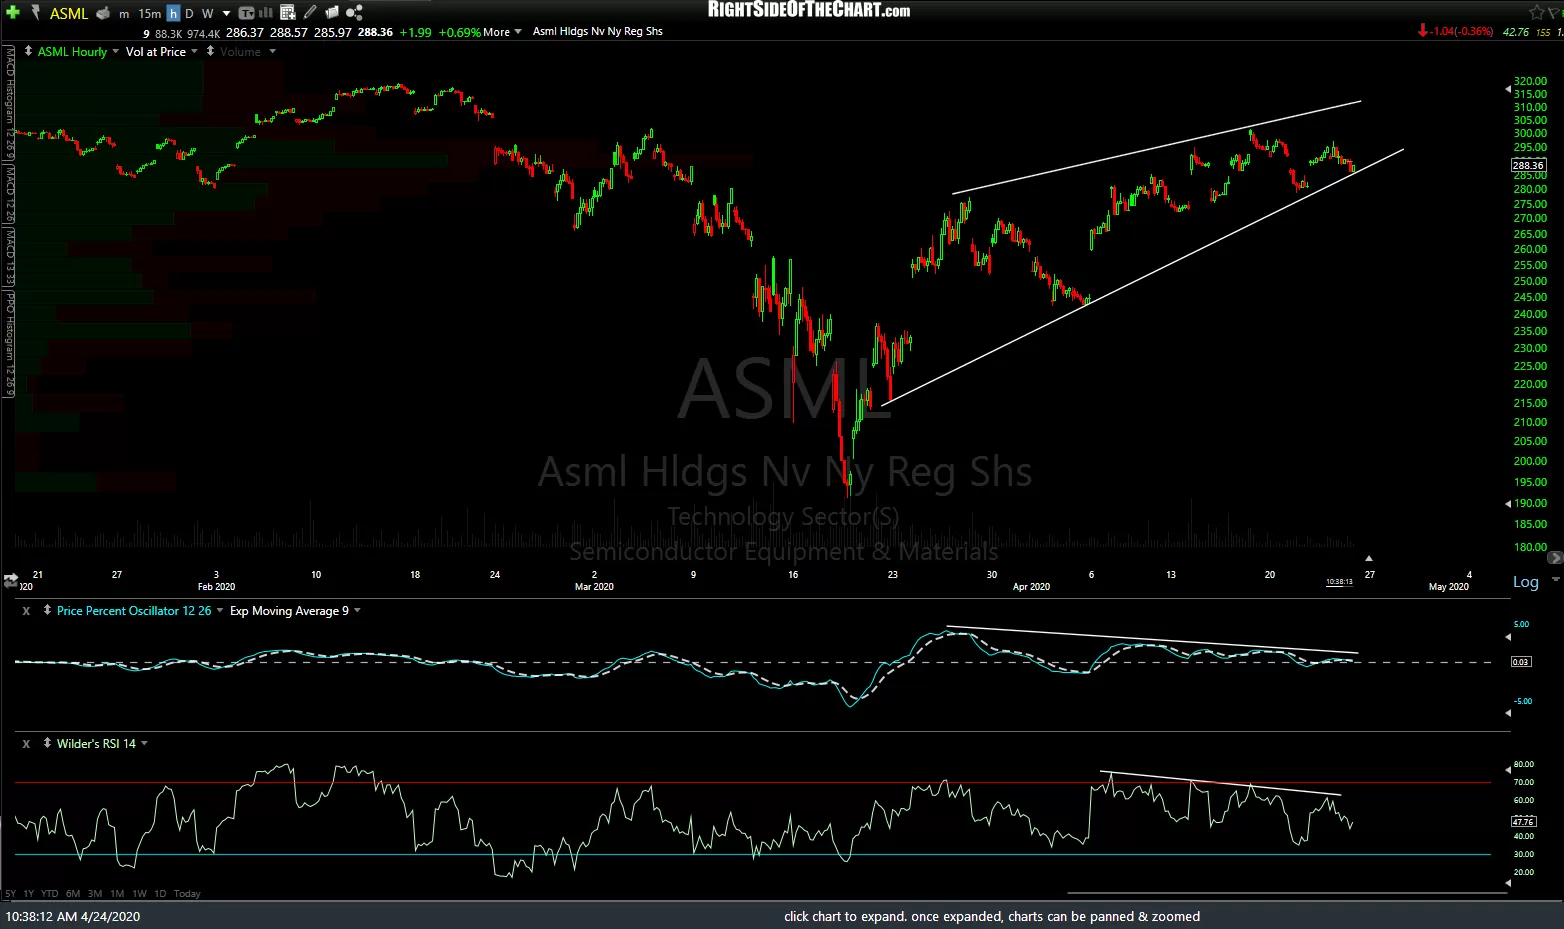
- ASML 60m April 24th
-
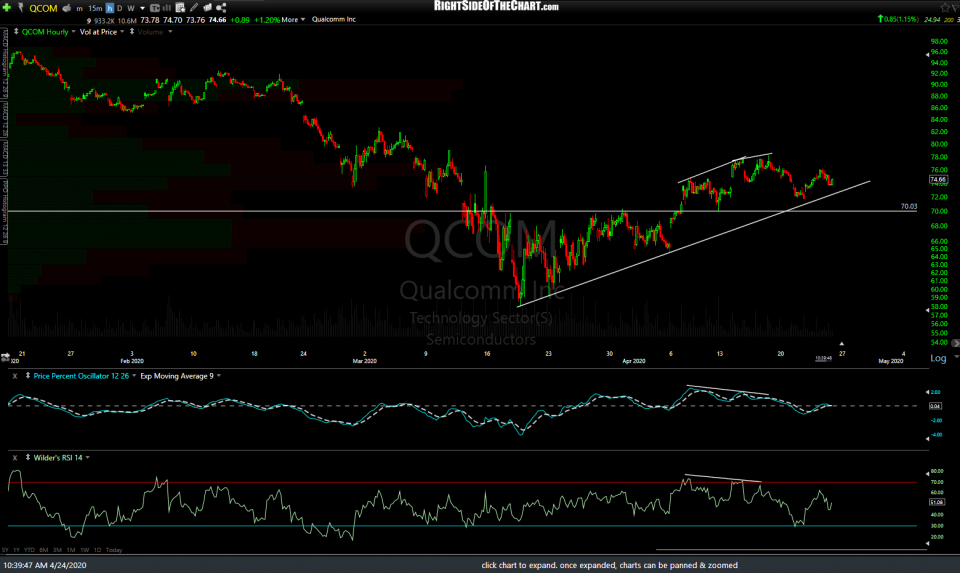
- QCOM 60m April 24th
-
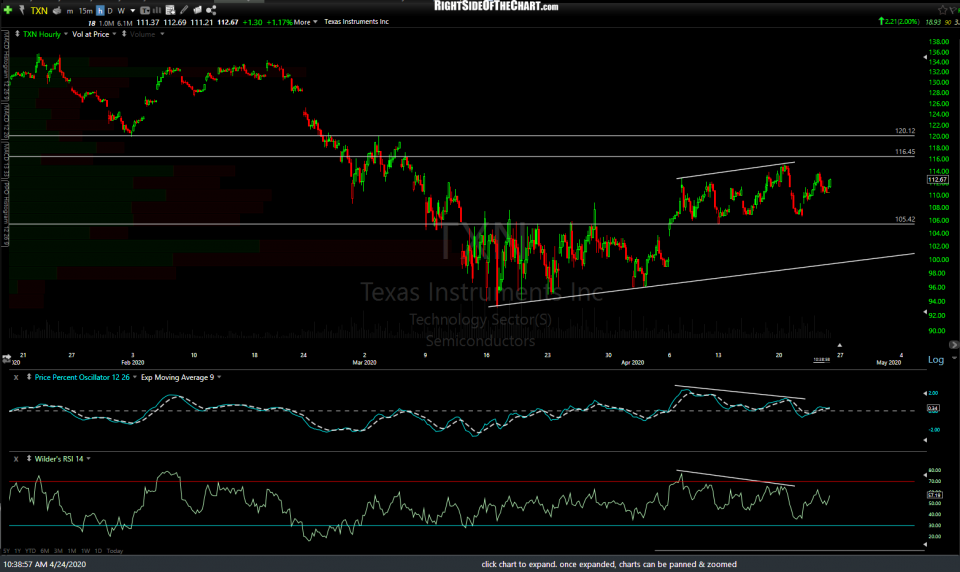
- TXN 60m April 24th
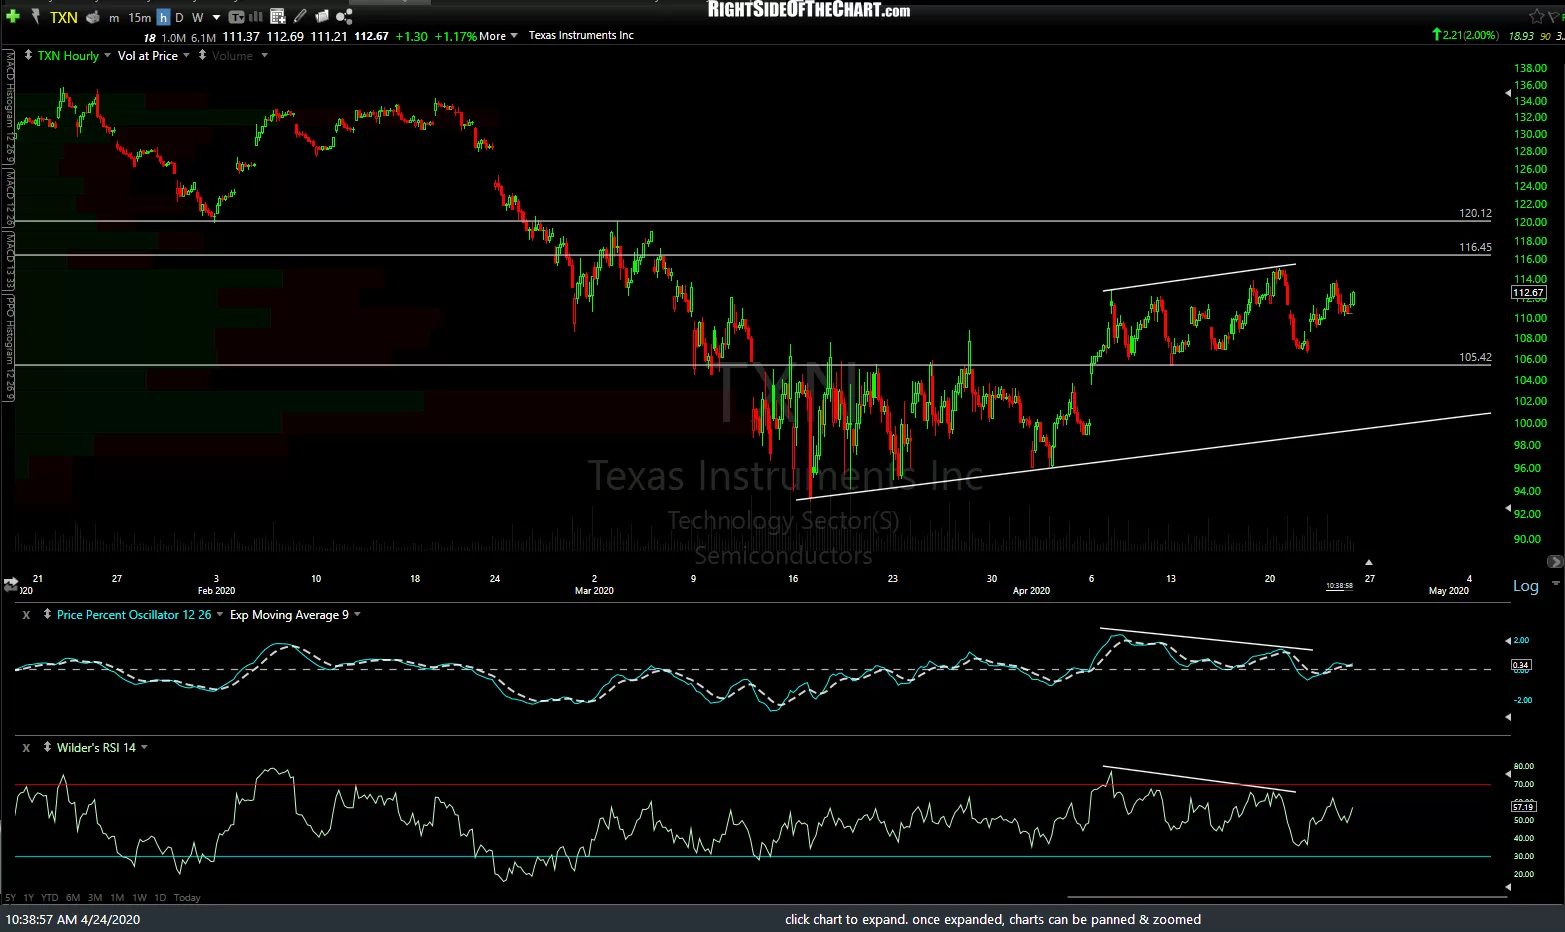
The take-away from these charts is that should most or all break below these trendlines and/or any of the nearby support levels below, especially in close proximity, that would trigger objective short entries on the semiconductor sector, QQQ, as well as the tech-heavy broad market (i.e.- S&P 500). The more of these trendlines broken & the more impulsive the breakdowns, the better the chance that the breakdowns will stick & not prove to be whipsaw signals.
Potential price near-term price targets for SOXX are the support levels shown at the arrow breaks. I may still add SOXX or one of the inverse (short) semiconductor ETFs as an official trade idea soon & if so, longer-term swing targets will be provided. The price targets for NVDA, which is already an Active Short Trade (entered shortly after it broke down below its 60-minute bearish rising wedge pattern), are the official targets for that trade with a potential 3rd target around the 188 level that may be added depending on how the semiconductor sector & the broad market trade going forward. While NVDA still offers an objective short entry here, as the stock is still trading below the wedge pattern, at this point I believe it would be best to wait for the aforementioned sell signals on the semiconductor sector & QQQ before initiating or adding to a position.
Note: Multiple charts in a gallery format, as above, will not appear on the subscriber email notifications but may be viewed on rsotc.com by clicking on the title of the post within the email. Click on the first chart to expand it, then click on the arrow to the right to advance to the next expanded chart. Once expanded, the charts can be zoomed using a mouse scroll wheel or touchpad, clicking on the magnifying glass icon at the top right of the chart, or use the pinch zoom feature on mobile devices. Once a chart is zoomed on a computer, it can be panned (moved around) by clicking & holding the left mouse button down & moving your mouse.