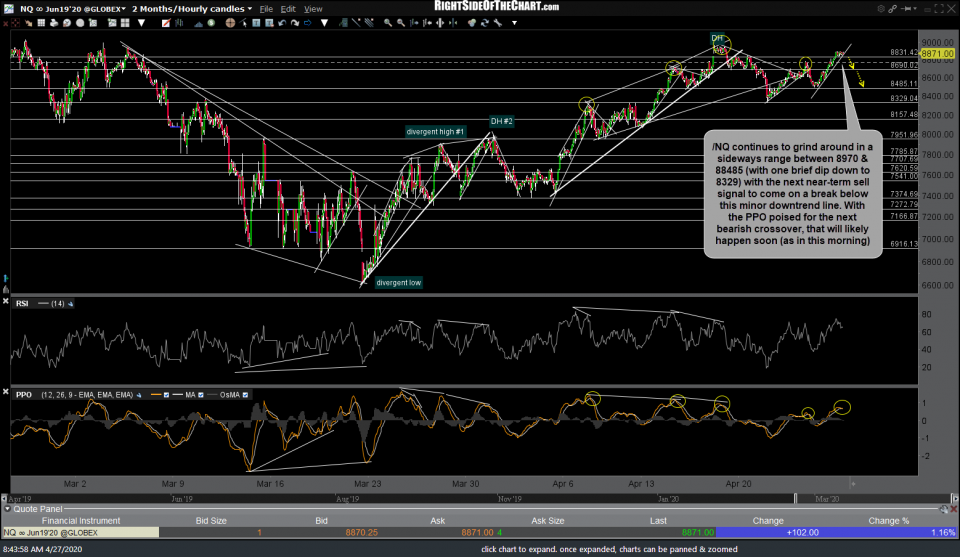
/NQ continues to grind around in a sideways range between 8970 & 88485 (with one brief dip down to 8329) with the next near-term sell signal to come on a break below this minor downtrend line. With the PPO poised for the next bearish crossover, that will likely happen soon (as in this morning). 60-minute chart below.
8960ish is a very significant & well-defined resistance level on /NQ with any relatively minor & brief pop above that level soon to put in a large divergent high & set the stage for a major bull trap, should the breakout fail, as I would suspect. Fake-out (false breakout) or not, a solid break below this uptrend line would trigger a major sell signal on /NQ. 120-minute chart below.
/ES has a comparable minor uptrend line as /NQ, with the next near-term sell signal on the stock market to come on a solid break below both. 60-minute chart below.
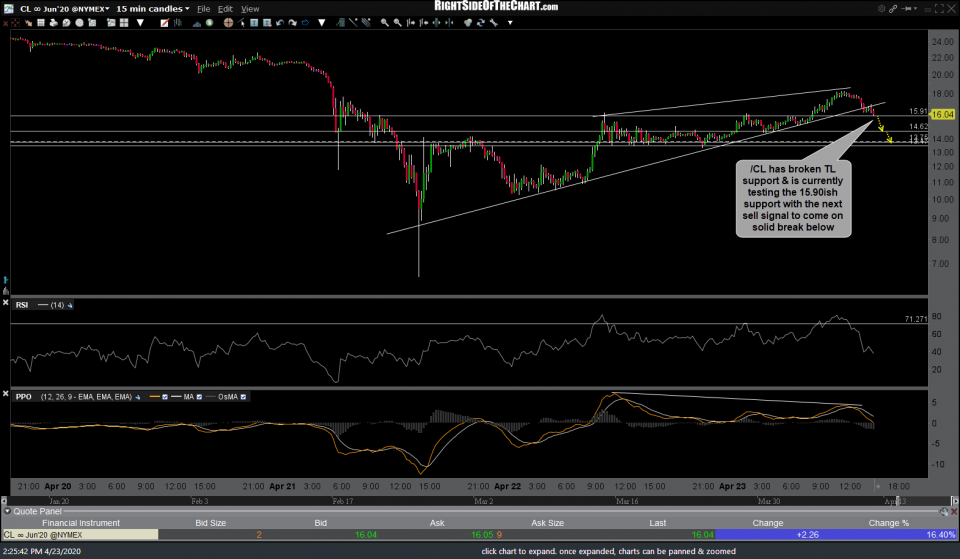
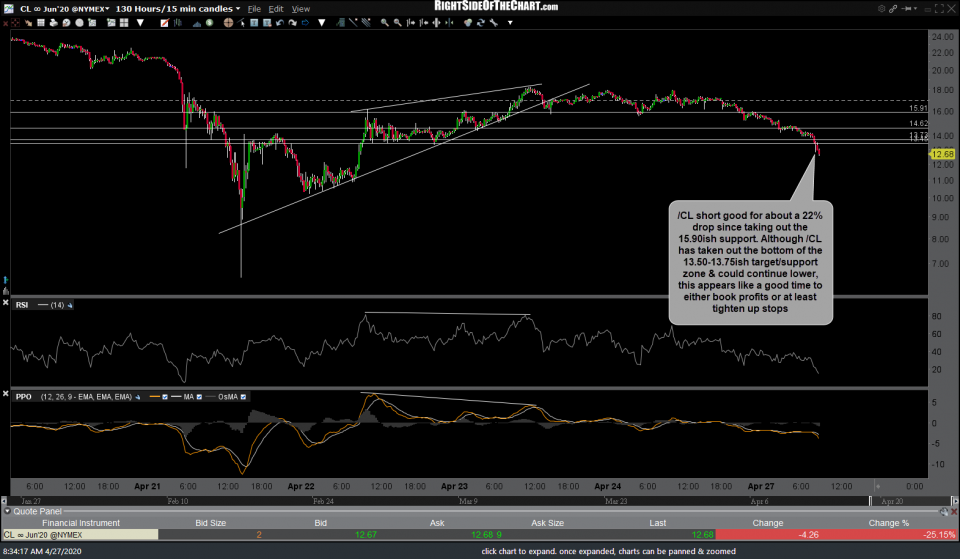
The /CL (crude futures) unofficial short trade idea posted in the trading room on Thursday (& mentioned on of the videos last week) is good for about a 22% drop so far since taking out the 15.90ish support. Although /CL has taken out the bottom of the 13.50-13.75ish target/support zone & could continue lower, this appears like a good time to either book profits or at least tighten up stops.
I suspect that the masses are expecting a repeat of last month’s crash into the May contract expiration due to the forced selling as speculators were unable to take delivery but I’d bet this time around, they don’t make the same mistake, closing out those contracts earlier this time around (as in the past few session). Either way, the chances of a short-squeeze and/or sharp snapback rally are elevated at this time, especially if the 13.50ish support is regained soon (bear trap/false breakdown). Previous & updated 15-minute charts below. (multiple charts in a gallery format, as below, will not appear on the email notifications but may be view on the site.)
- CL 15m April 23rd
- CL 15m April 27th
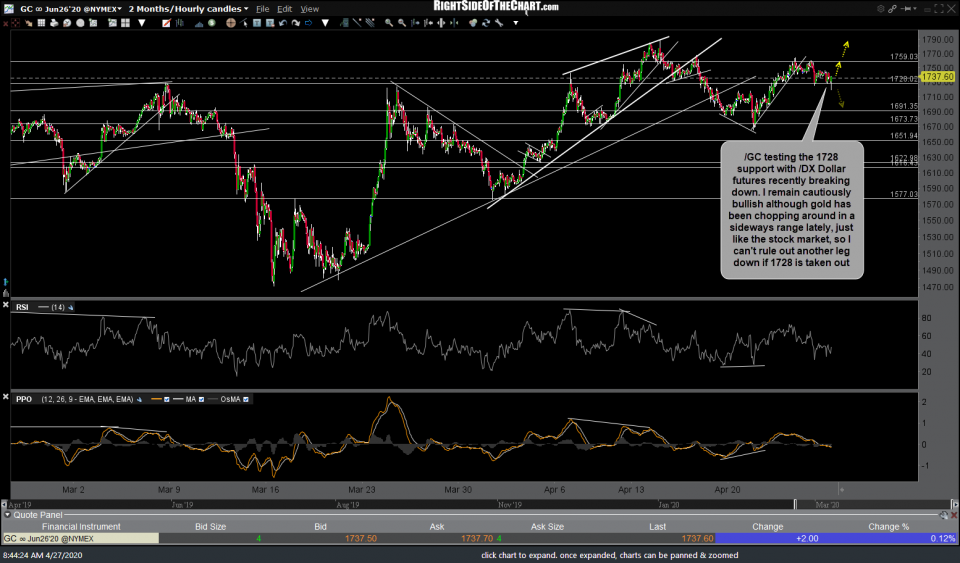
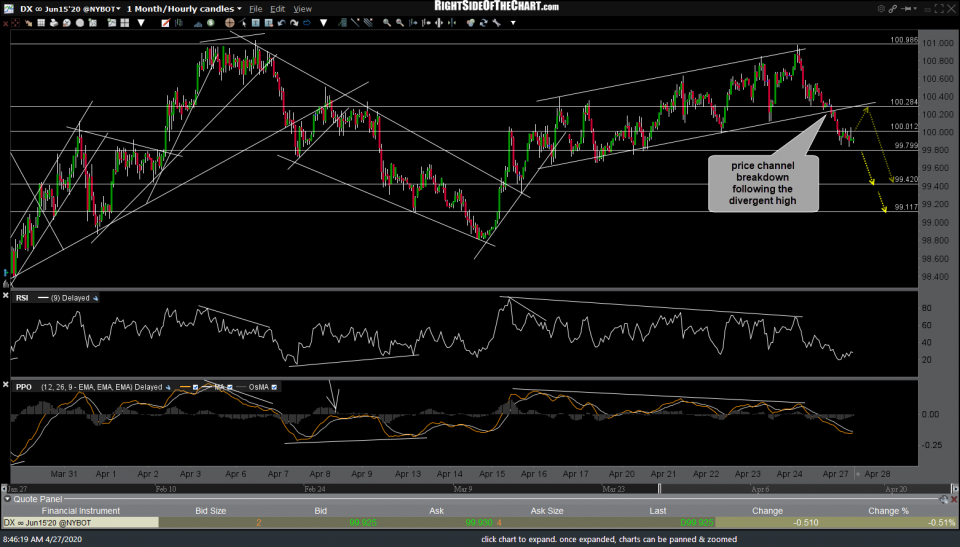
/GC (gold futures) are testing the 1728 support with /DX Dollar futures recently breaking down. I remain cautiously bullish although gold has been chopping around in a sideways range lately, just like the stock market, so I can’t rule out another leg down if 1728 is taken out. /GC & /DX 60-minute charts below.
- GC 60m April 27th
- DX 60m April 27th
On a related note, the next near-term trend in /SI (silver) could be determined by which way this symmetrical triangle pattern breaks. 60-minute chart below.


