
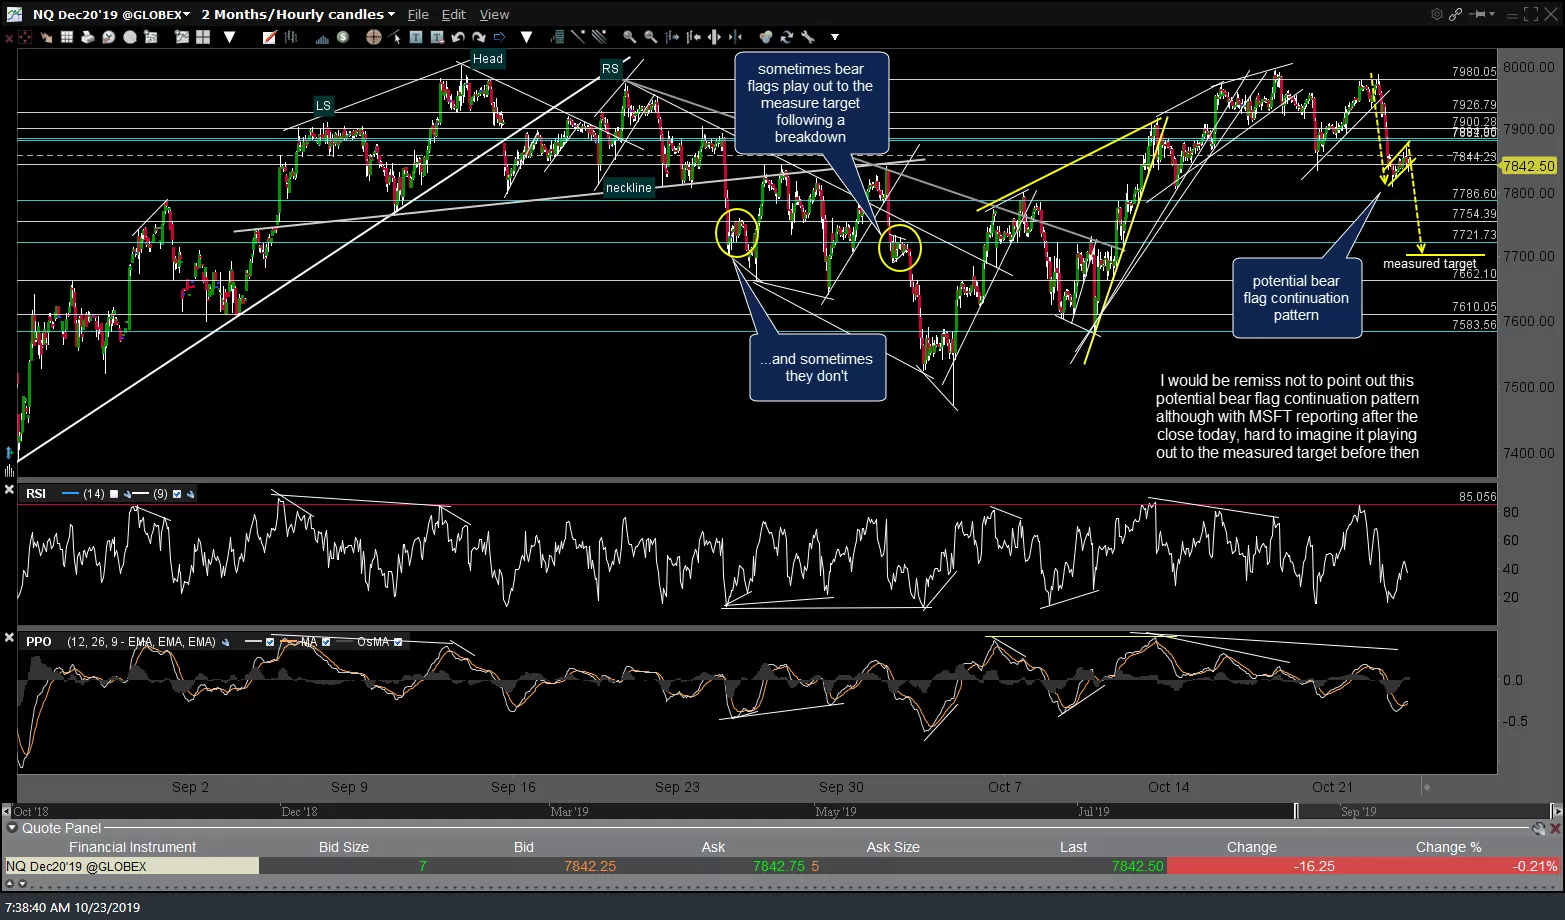
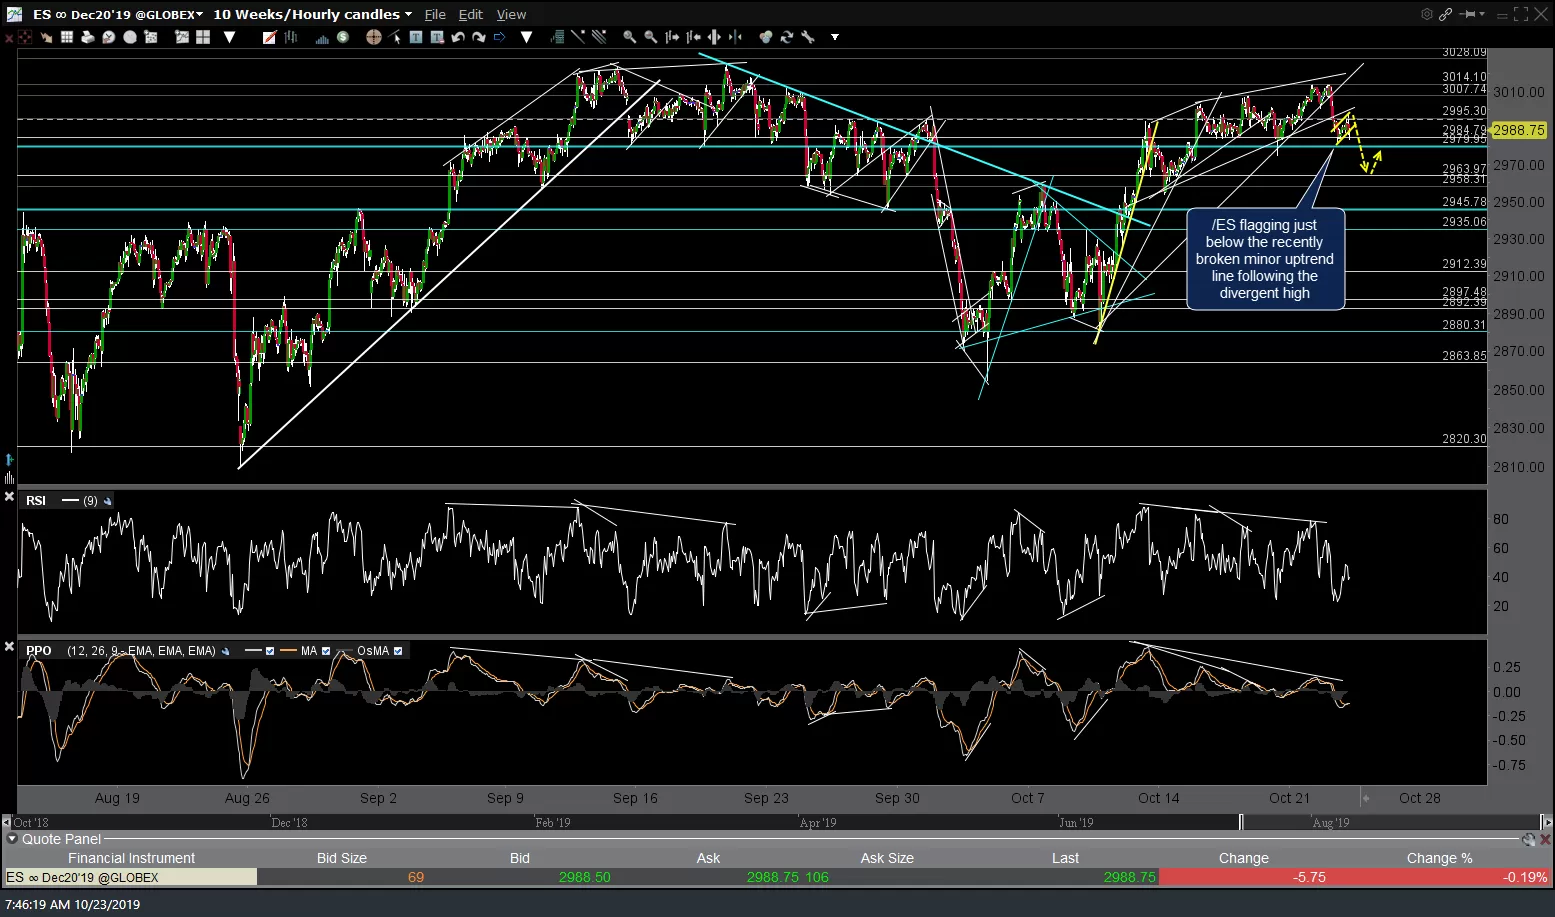
I would be remiss not to point out these potential bear flag continuation patterns on /ES & /NQ (S&P 500 & Nasdaq 100 futures) although with MSFT reporting after the close today, it would be hard to imagine these flags playing out to the measured target before then, that’s assuming they even trigger a sell signal which would come on an impulsive break down below the flags.
-
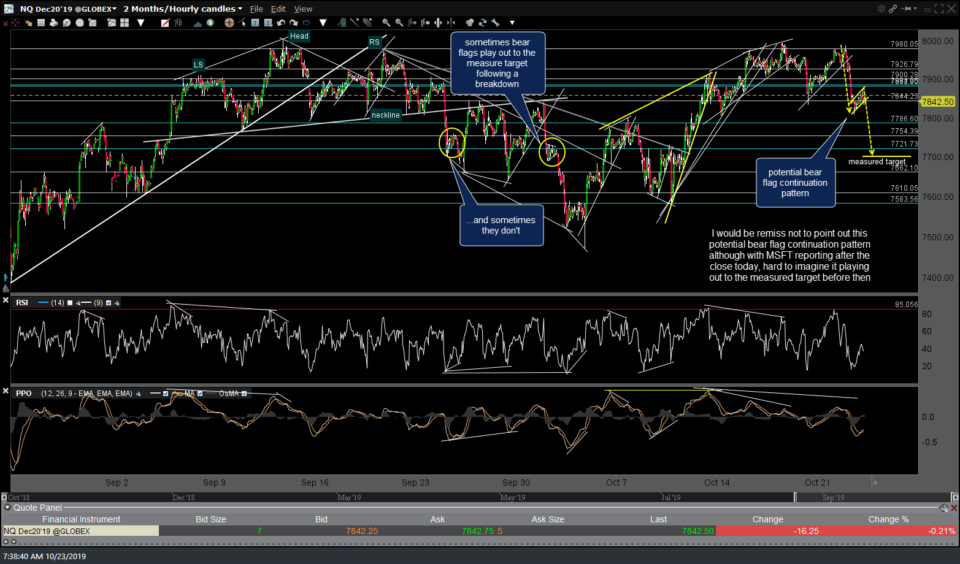
- NQ 60m Oct 23rd
-
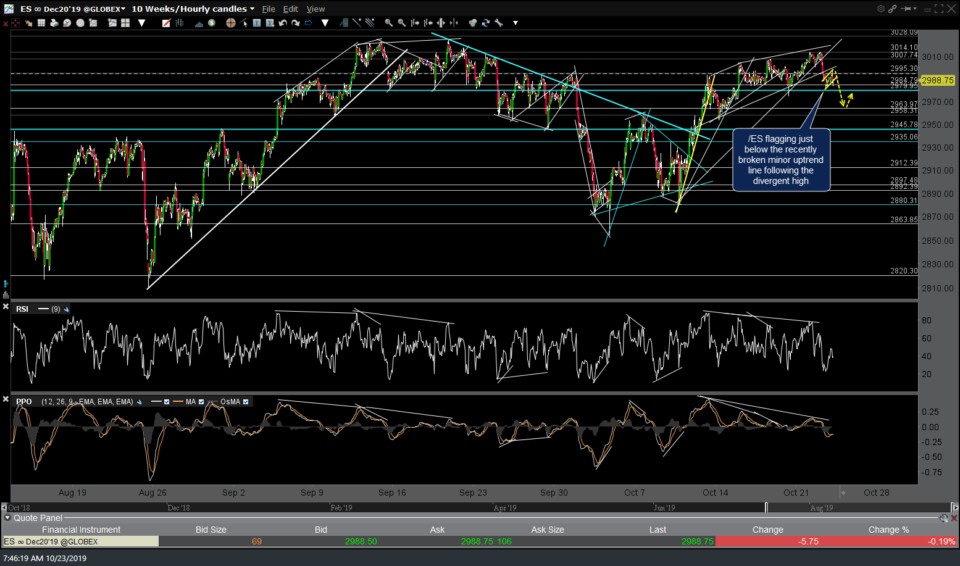
- ES 60m Oct 23rd
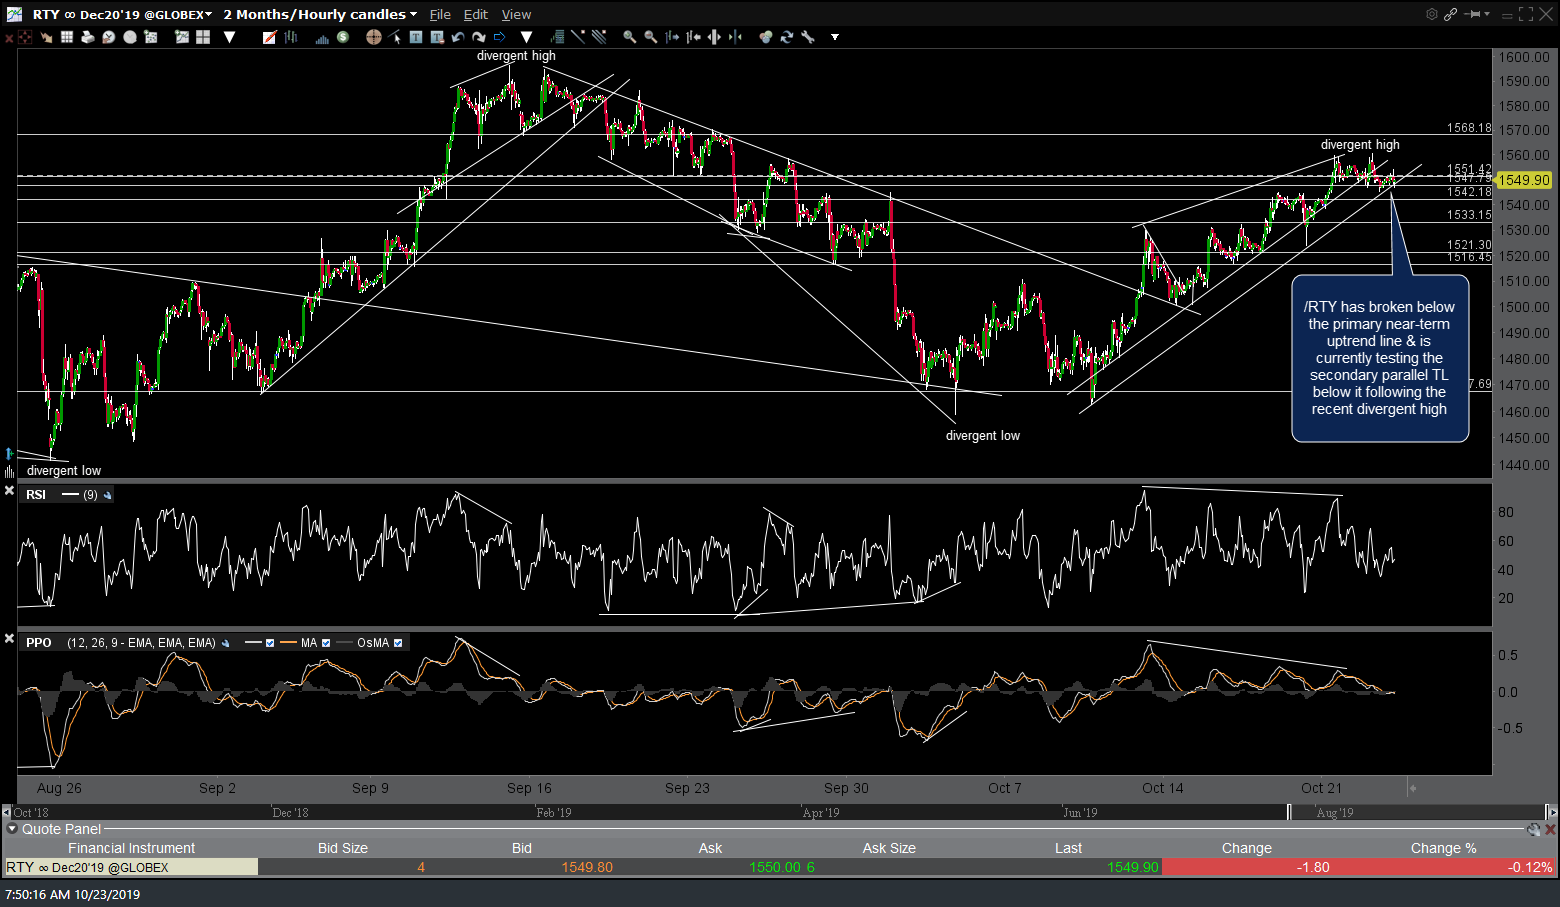
/RTY (Russell 2000 Small-Cap Index futures) has broken below the primary near-term uptrend line & is currently testing the secondary parallel trendline (support) below it following the recent divergent high.
RTY 60m Oct 23rd
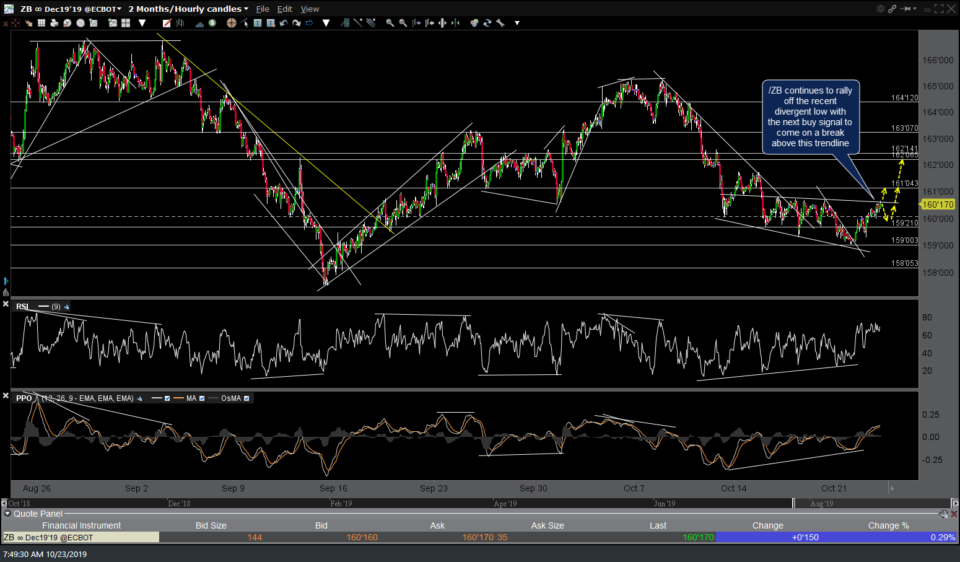
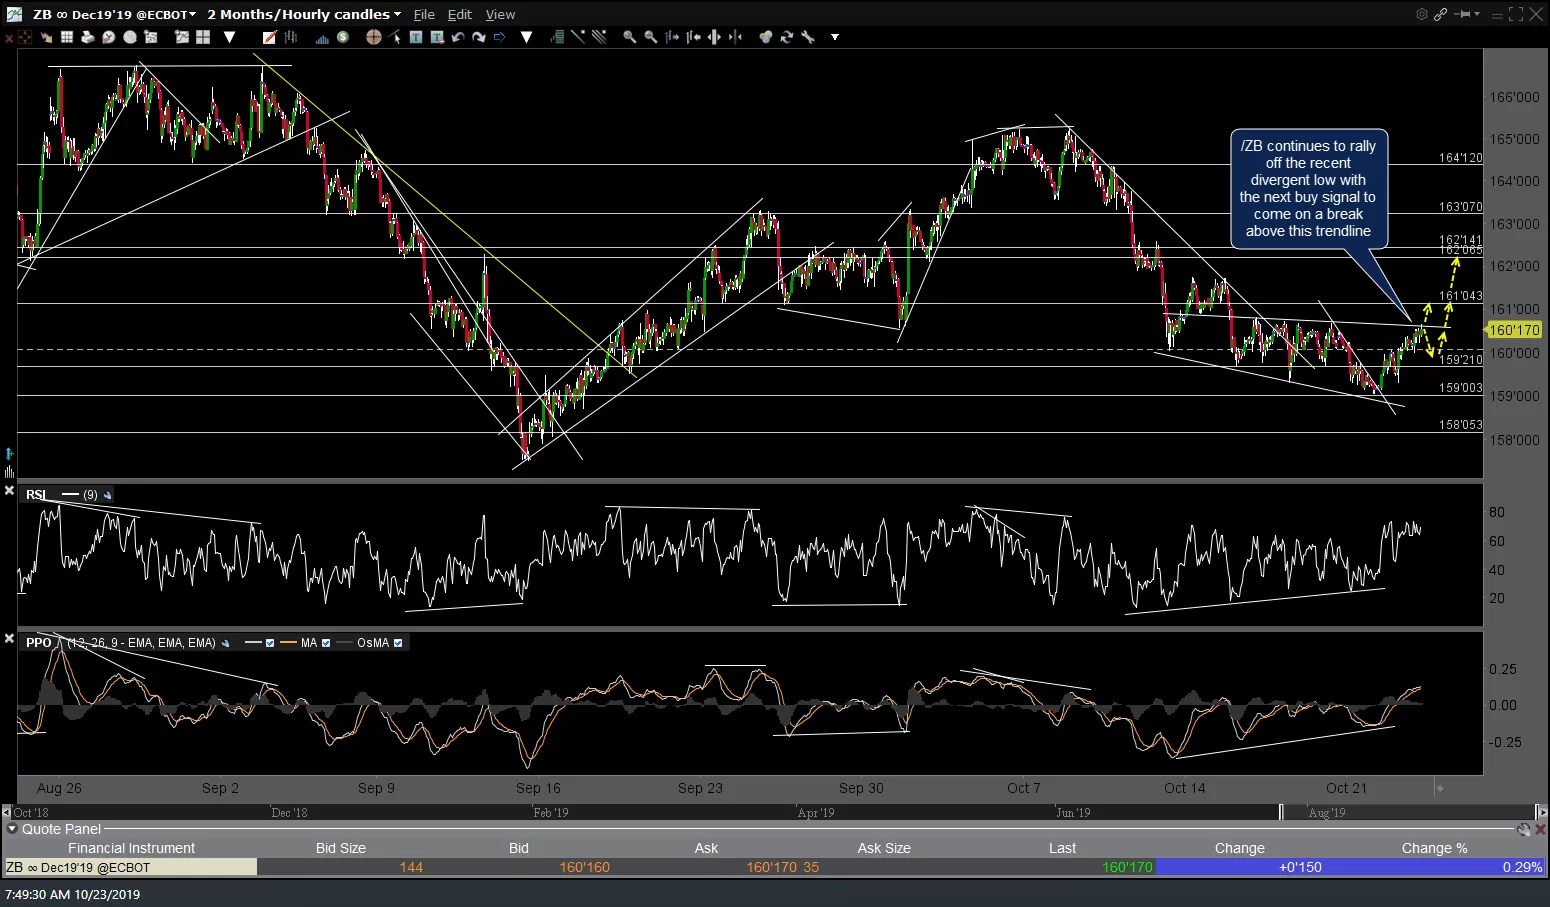
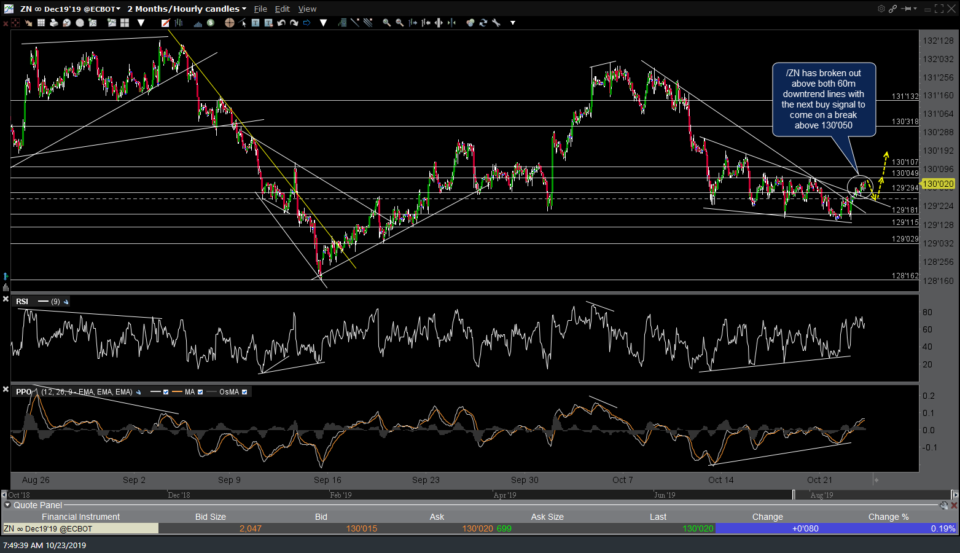
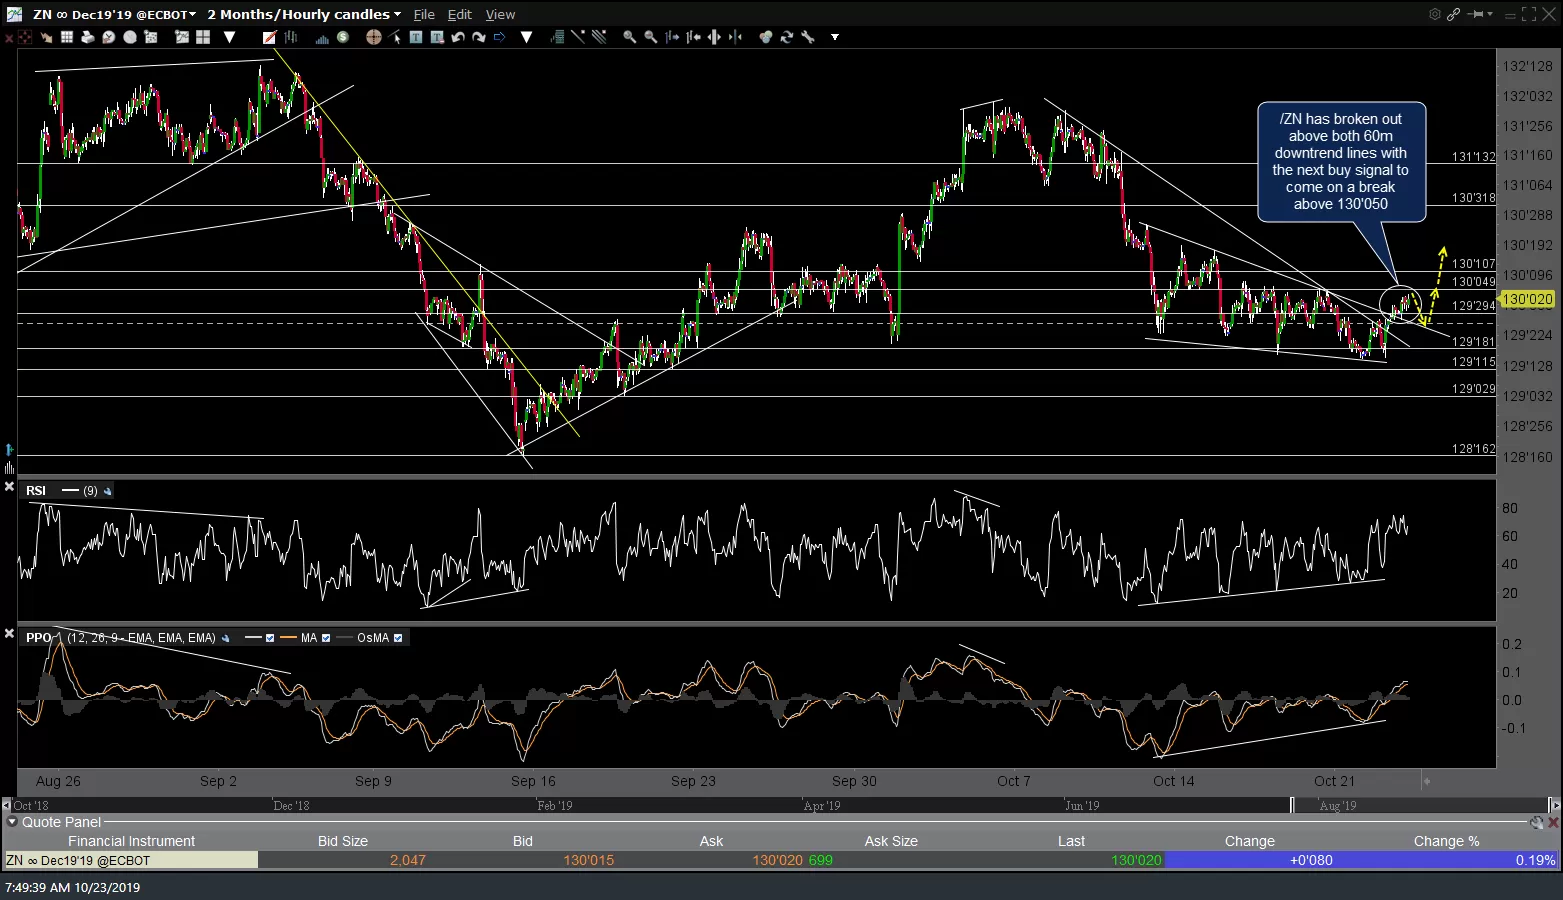
/ZB (30-yr Treasury bond futures) continues to rally off the recent divergent low with the next buy signal to come on a break above this trendline while /ZN (10-yr T-bond futures) has broken out above both 60m downtrend lines with the next buy signal to come on a break above 130’050. The fact that the ‘risk-off/flight-to-safety’ Treasury bonds just put in divergent lows with potentially bullish technical postures adds to the case for a correction in the stock indices, which have just put in divergent highs on the 60-minute charts with increasingly bearish technical postures.
-
- ZB 60m Oct 23rd
-
- ZN 60m Oct 23rd
While the near-term direction of gold remains unclear as /GC pinches towards the apex of this 60-minute triangle pattern, an upside resolution (breakout) of the pattern appears to be the most likely scenario at this time as that would mesh with the outlook for equities & Treasuries above.
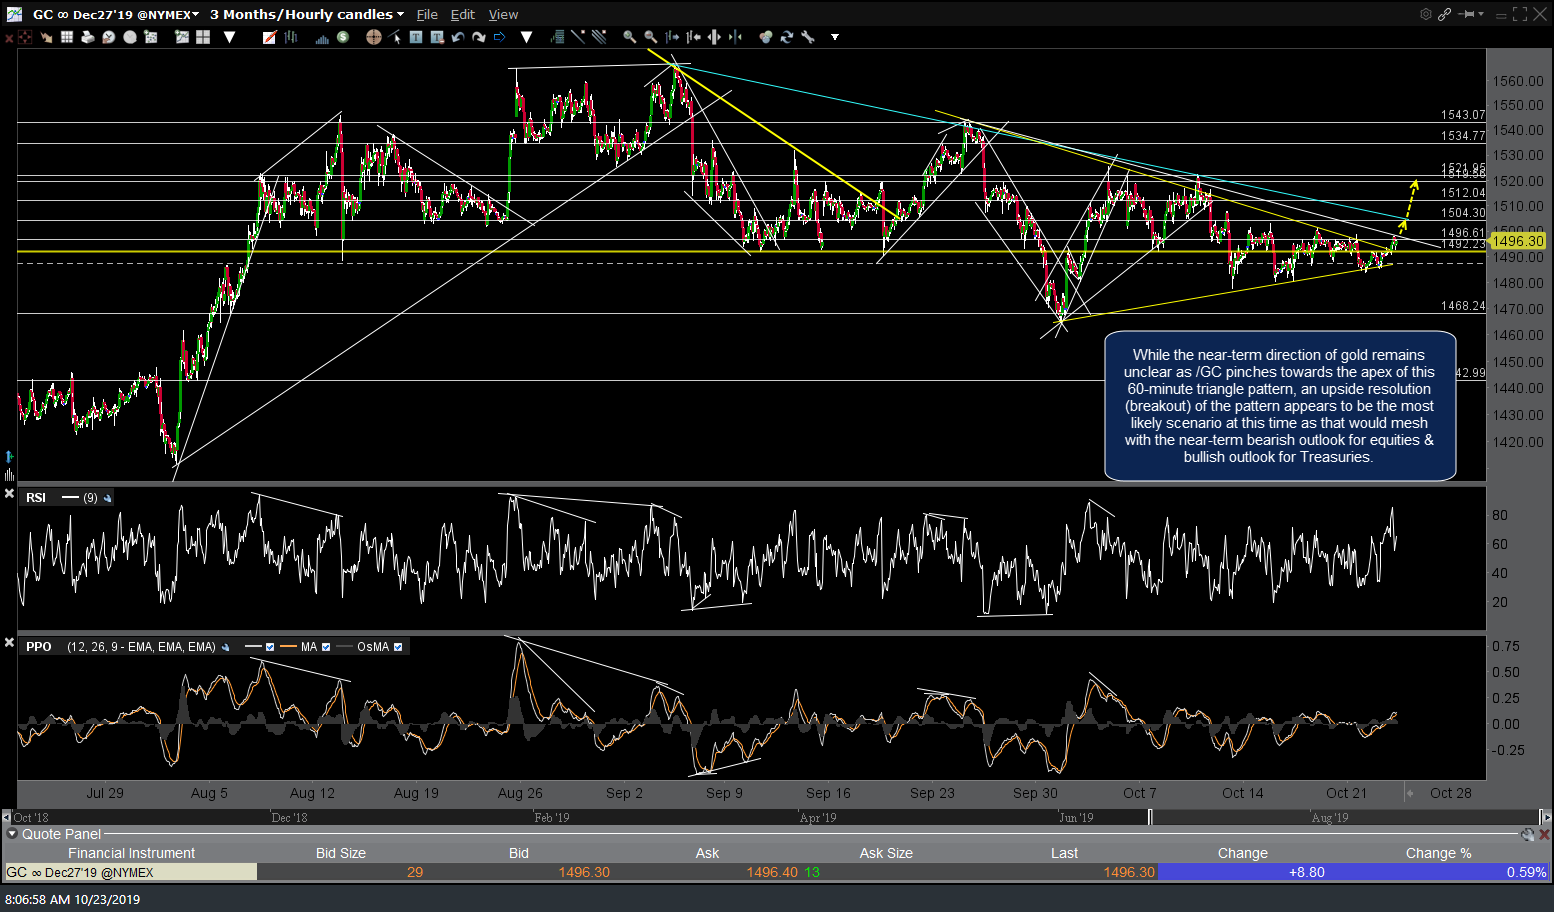
GC 60m Oct 23rd
While this scenario doesn’t exactly mesh with the preferred scenario for gold above, /PA (palladium futures) would trigger a sell signal on a solid break below the 1718ish support while any new high soon would most likely be a divergent high on this 60-minute chart.
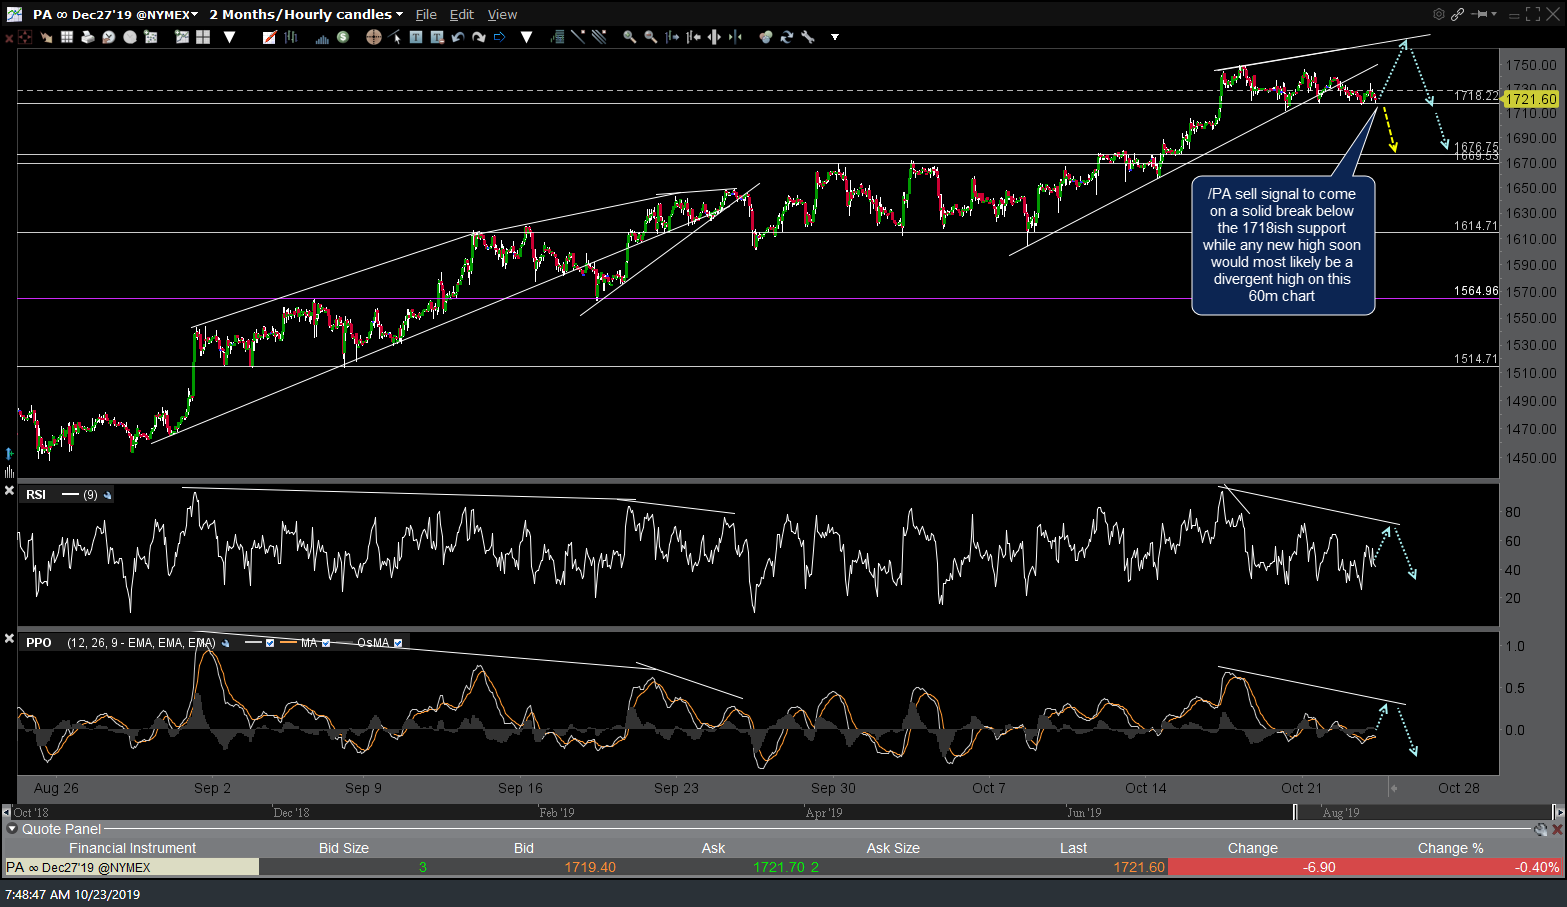
PA 60m Oct 23rd
My best guess would be that the stock market, along with the risk-off assets, mostly grind around today without making any large moves as traders & investors await MSFT earnings after the close today as well as the big reports from AMZN & INTC after the close tomorrow. As such, the odds for whipsaw signals (i.e.- false breakouts) remains elevated at this time and with the big earnings reports over the next two days, the chance for sizeable opening gaps in the market over the next few trading sessions is pretty decent so one should factor that into their swing trade positioning & total net long or short exposure.