
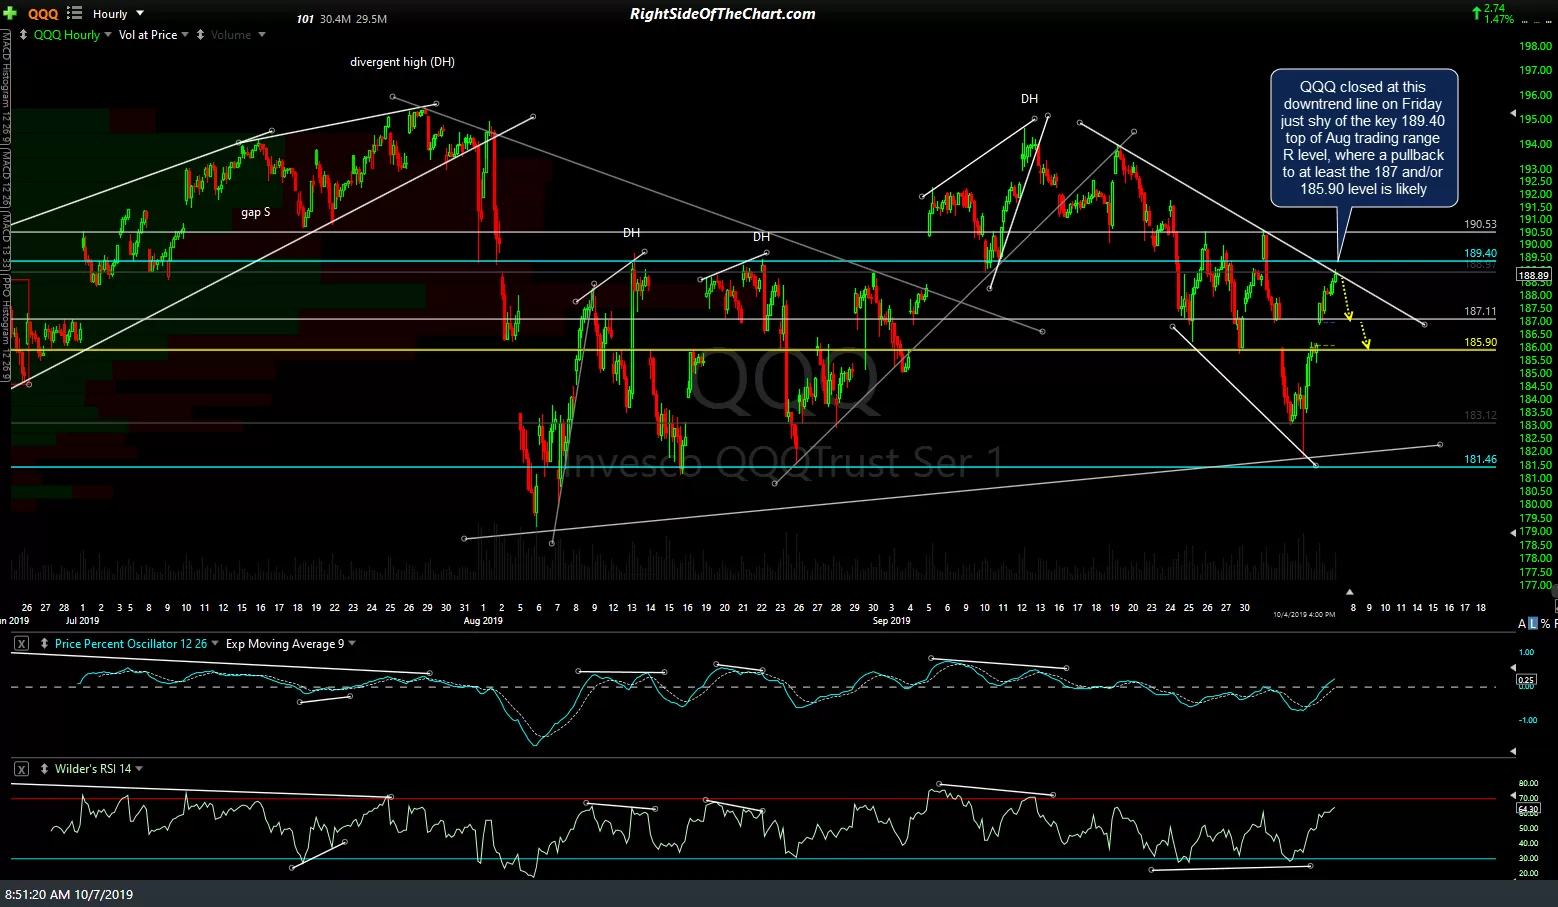
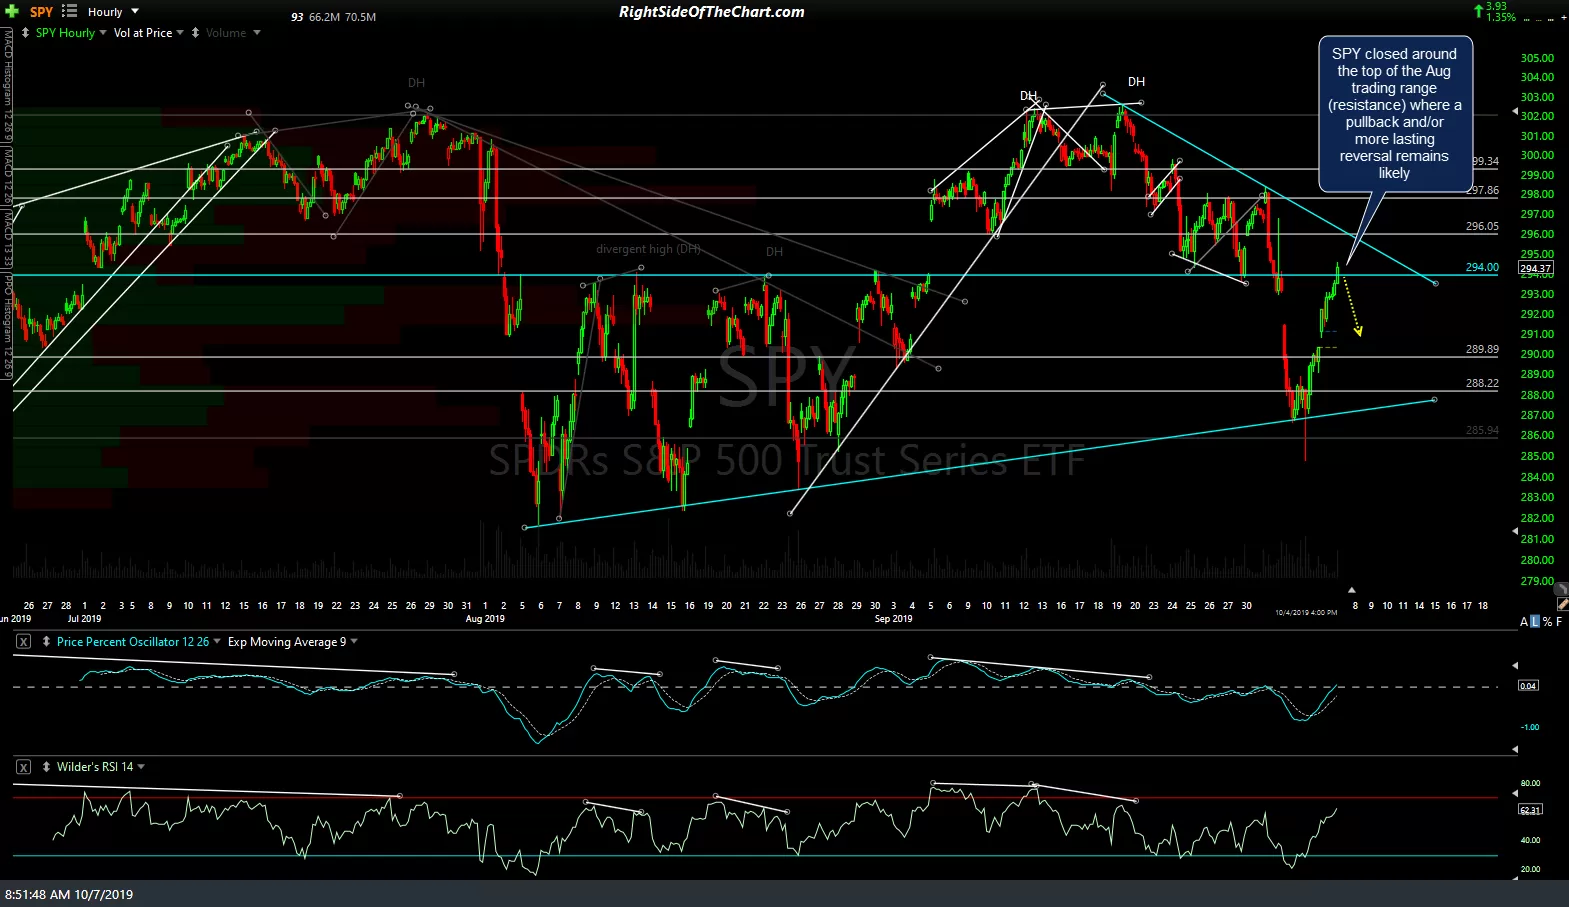
QQQ closed at this downtrend line on Friday just shy of the key 189.40 top of August trading range resistance level, where a pullback to at least the 187 and/or 185.90 level is likely while SPY also closed around the top of the Aug trading range (resistance) where a pullback and/or more lasting reversal remains likely. Likewise, solid breakouts & rallies well above those resistance levels would be near-term bullish. 60-minute charts below.
-

- QQQ 60m 2 Oct 5th close
-

- SPY 60m Oct 5th close
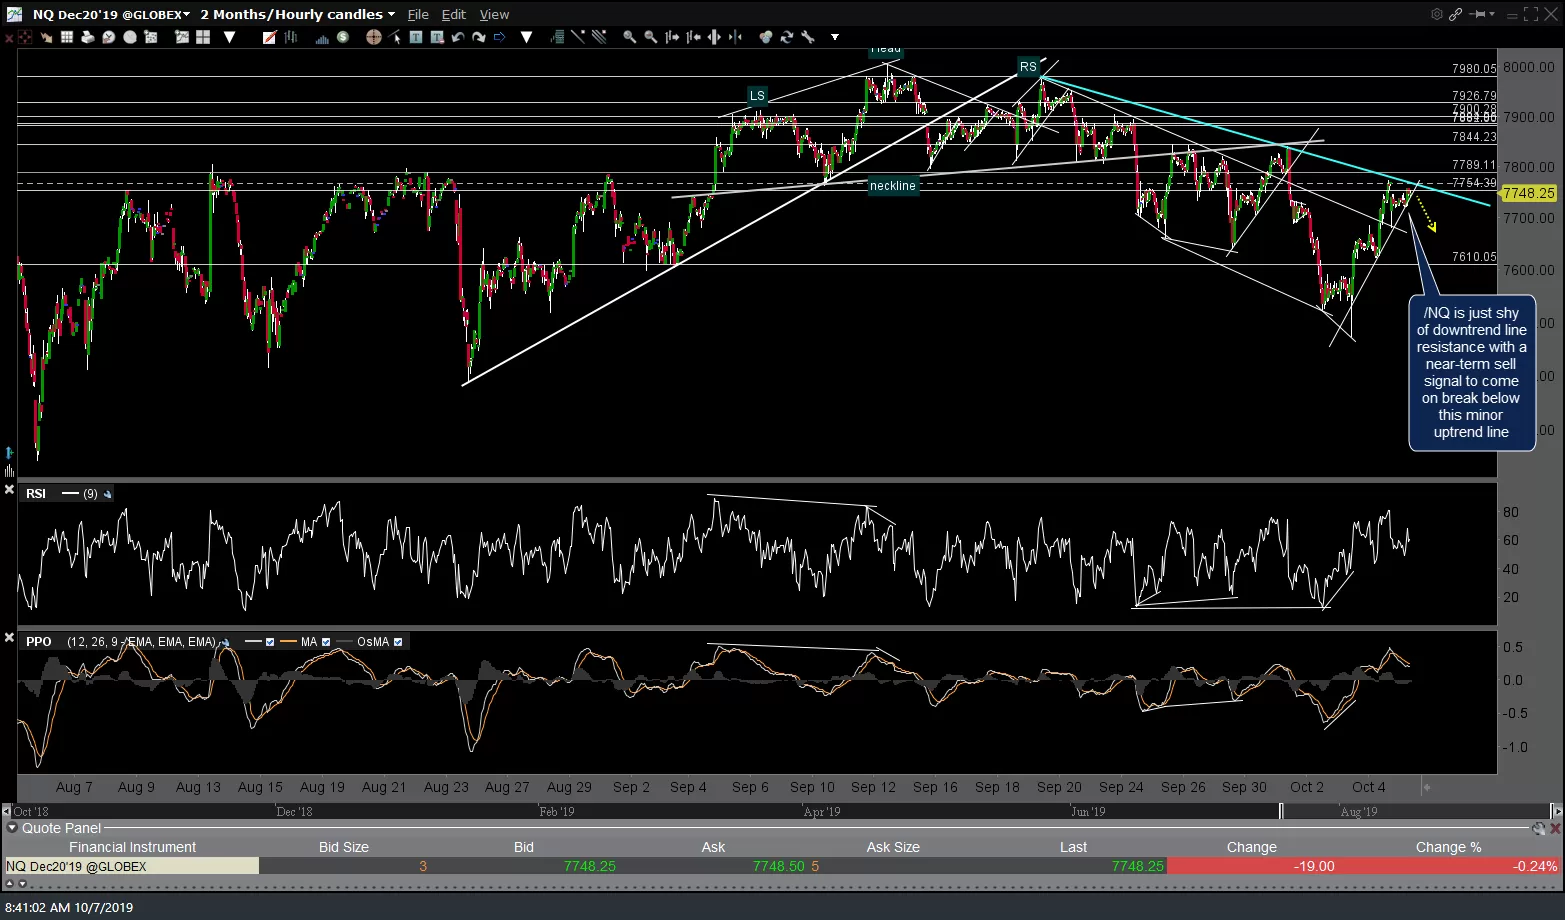
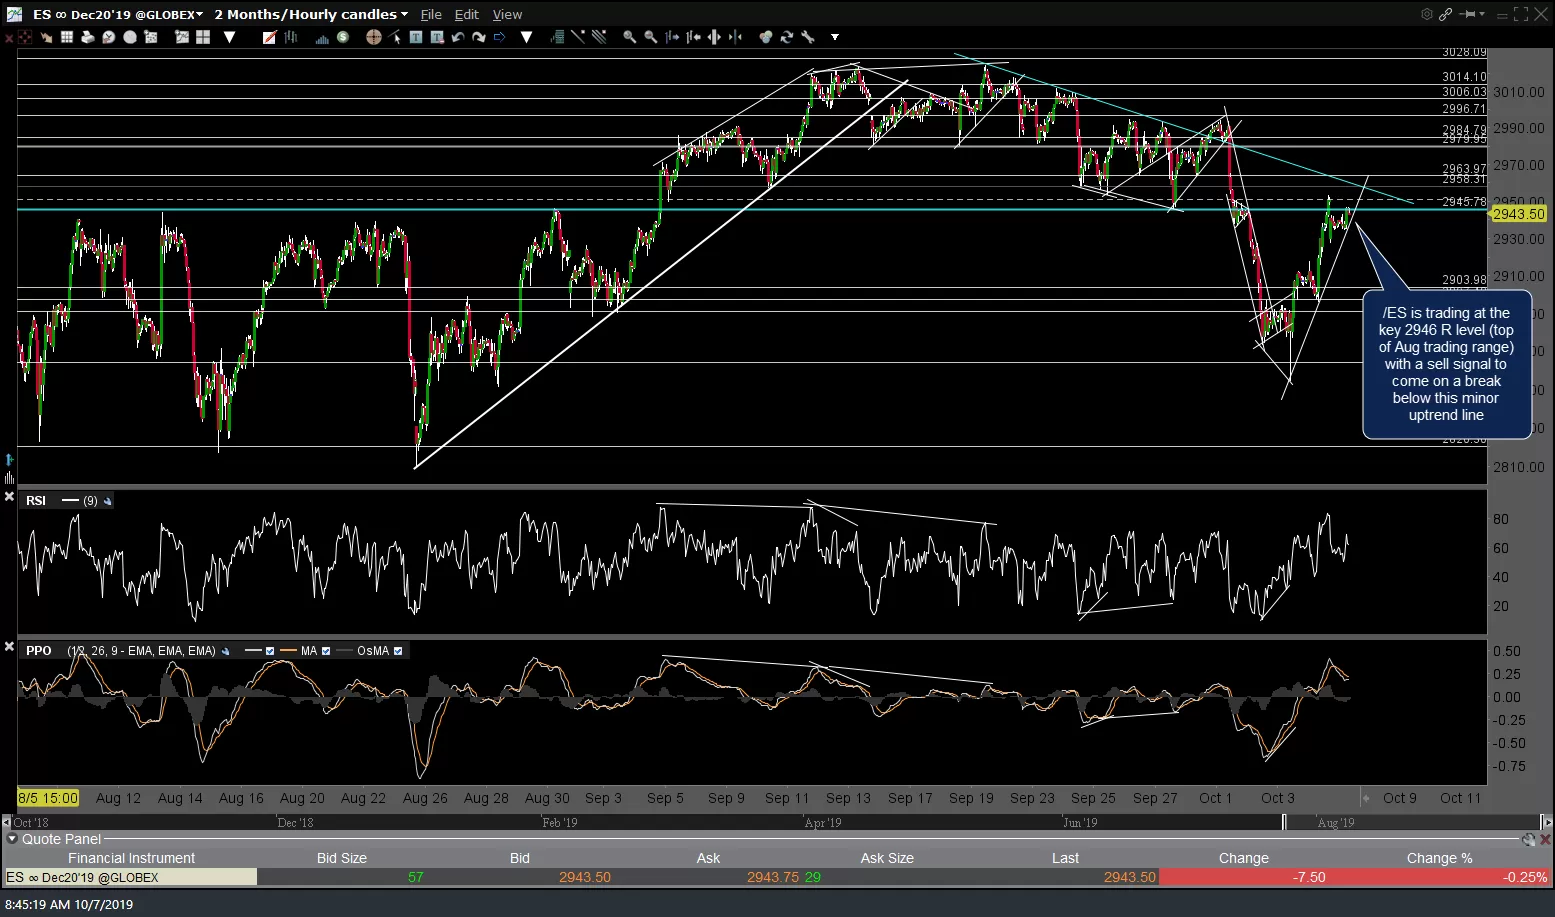
In the pre-market trading session, /NQ is just shy of downtrend line resistance with a near-term sell signal to come on break below this minor uptrend line while /ES is trading at the key 2946 resistance level (top of Aug trading range) with a sell signal also to come on a break below this minor uptrend line (both minor uptrend lines on /ES & /NQ need to break to confirm the sell signals). 60-minute charts below.
-
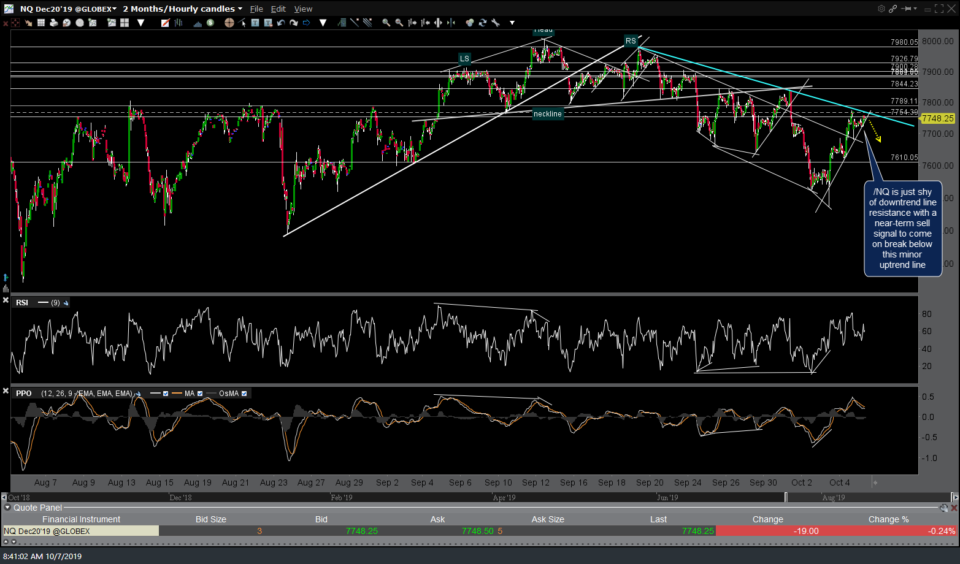
- NQ 60m Oct 7th
-

- ES 60m Oct 7th
/E7 Euro futures has been backtesting the 1.1010 first target (former resistance which became support once taken out) and still appears headed to my next target of the downtrend line with a more powerful buy signal to come on a solid breakout above it.
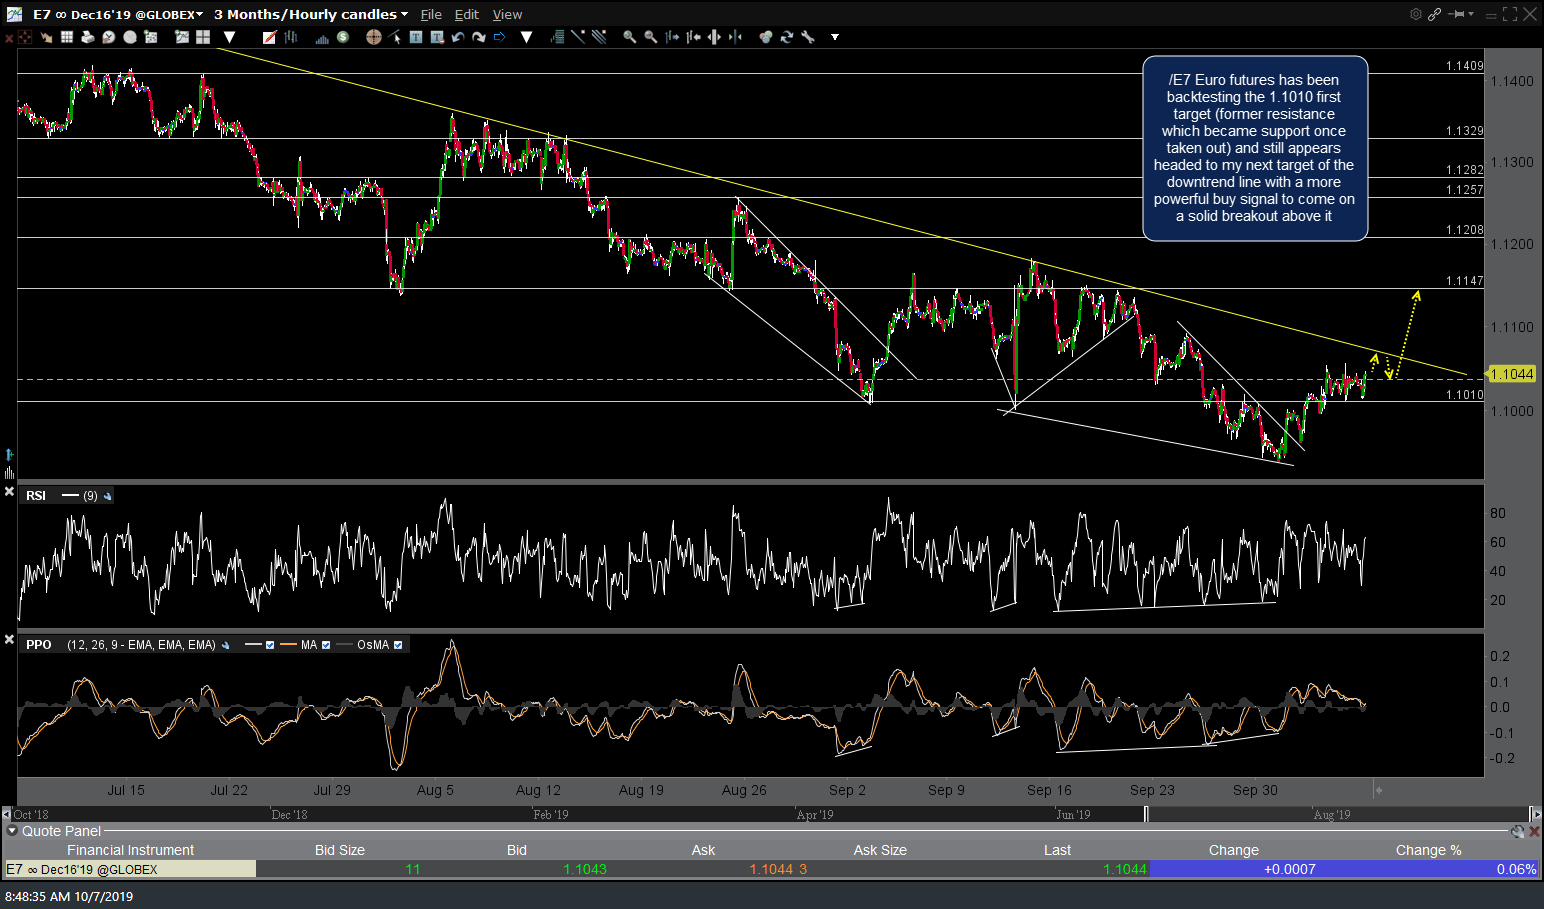
E7 60m Oct 7th
On a closely related note, /DX $USD futures sell signal to come on an impulsive break and/or 120-minute close below uptrend line.

DX 120m Oct 7th
/CL broke out above both downtrend lines following the recent divergent low (both bullish) & is approaching the 53.80ish resistance level now. My preference is to wait & see how the stock market trades during the regular session today, in particular, whether it is rejected off the aforementioned resistance levels (bearish) or breaks out & continues higher as the former would likely provide a headwind for a long trade on crude & the latter a tailwind.
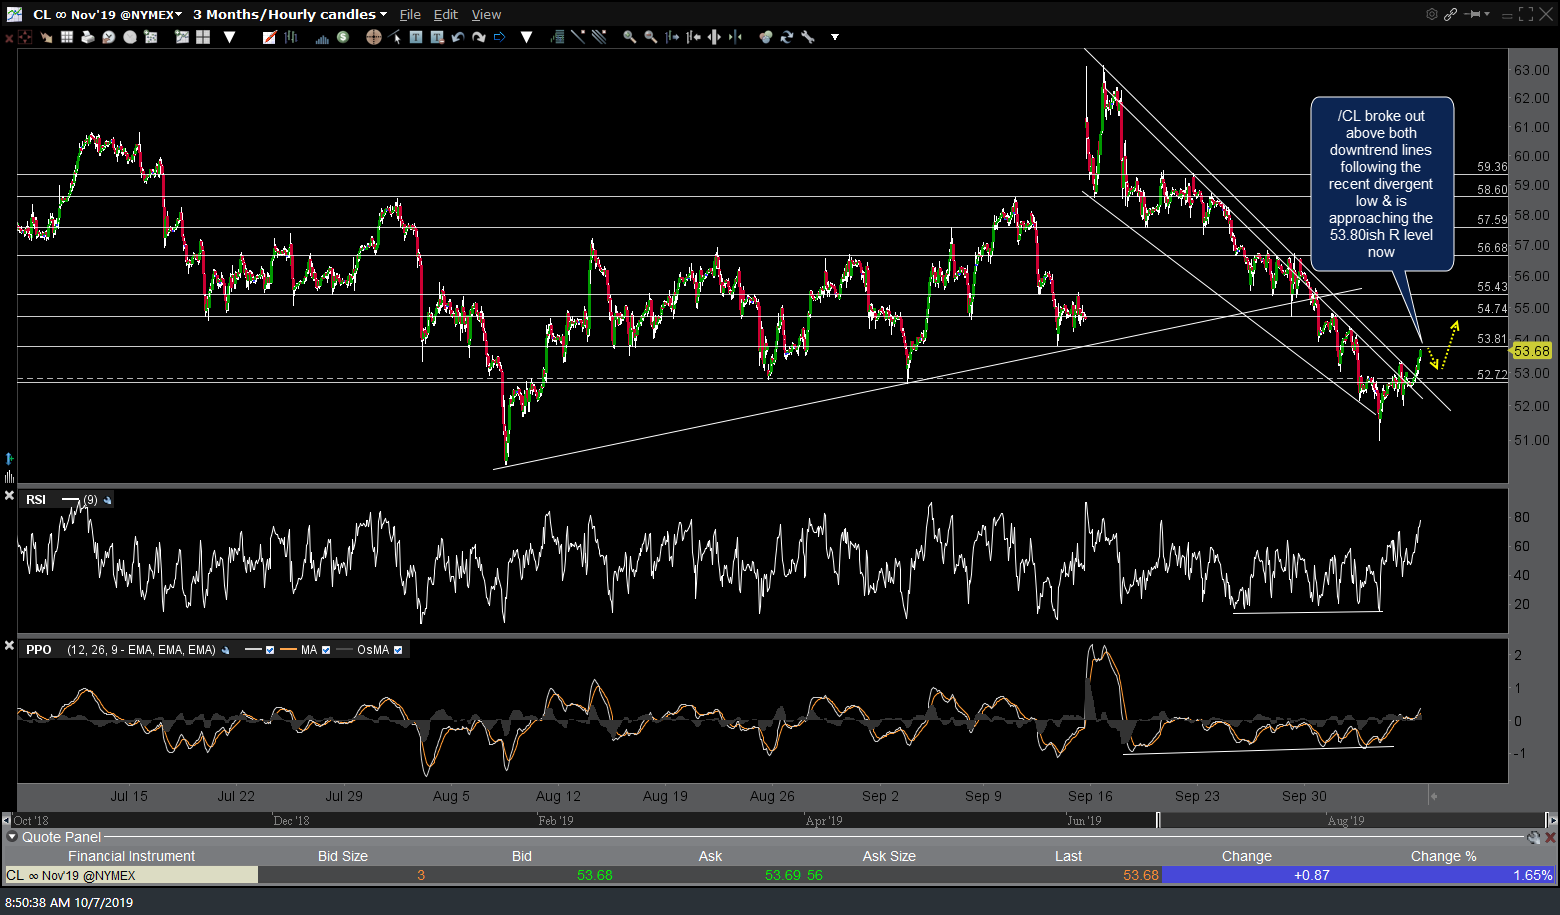
CL 60m Oct 7th