
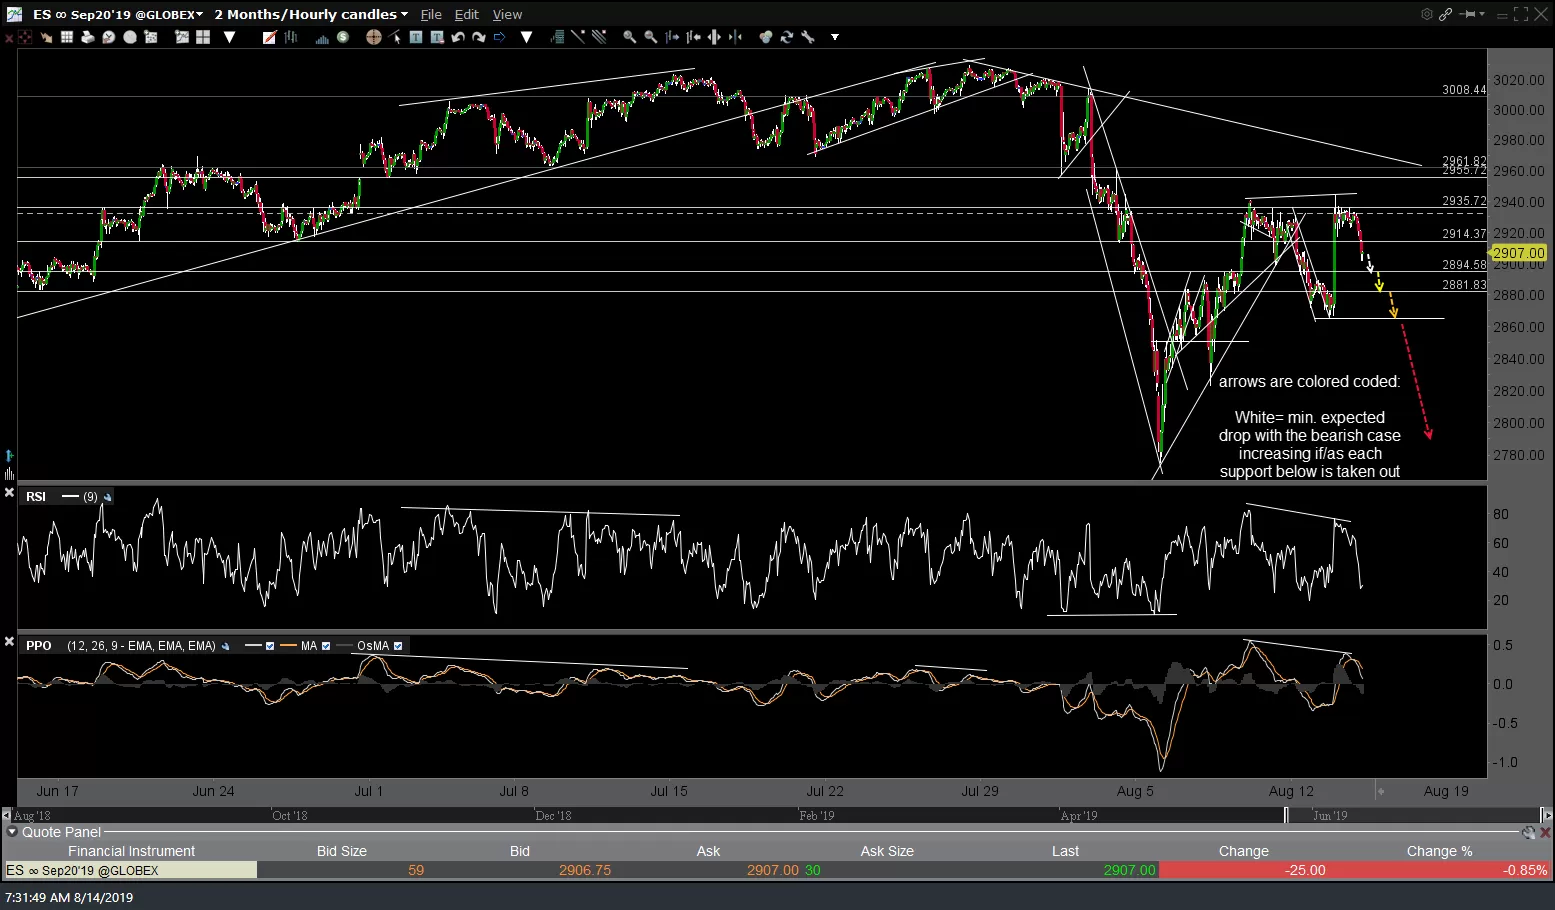
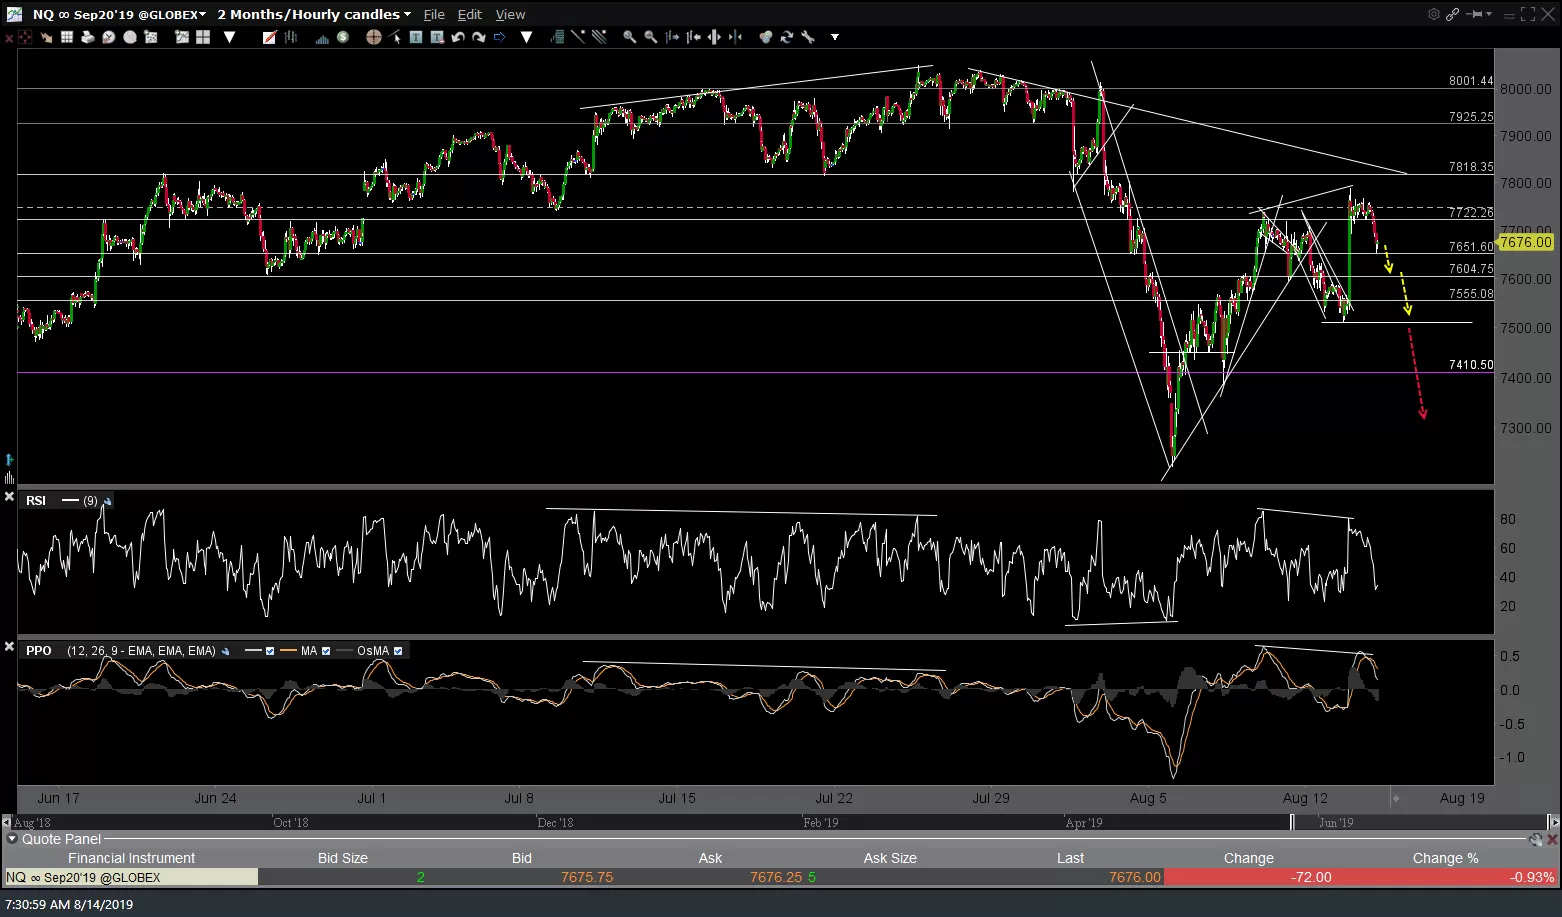
Here are a few of the charts on various asset classes that I’m watching today, all of which were covered in the two videos posted yesterday after the market closed. Starting with the major stock index futures, I’ve colored coded the support levels on /ES (S&P 500) futures, each of which would increasingly firm up the intermediate-term (weeks+) bearish case for the stock market if & when taken out. I’ve also listed some nearby support levels to watch on the /NQ (Nasdaq 100) 60-minute chart below as well. Essentially, a solid break below yesterday’s/Monday’s lows would be quite bearish.
-
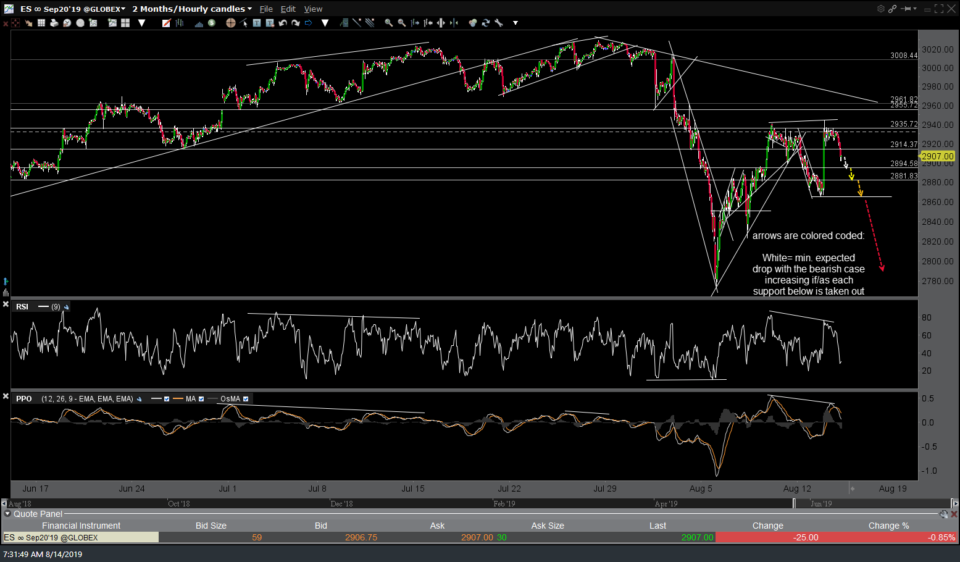
- ES 60-min Aug 14th
-

- NQ 60-min Aug 14th
(gallery chart images in this post will not appear on the email notifications but may be viewed on the site).
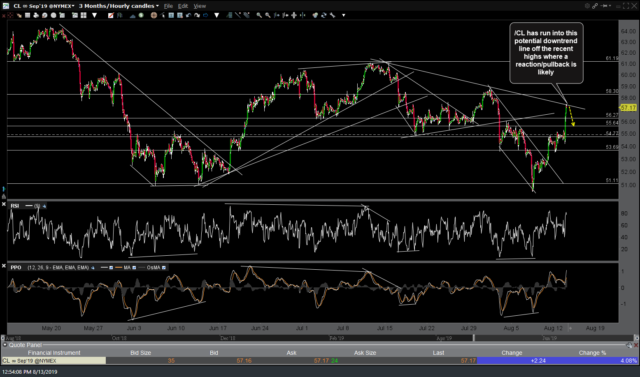
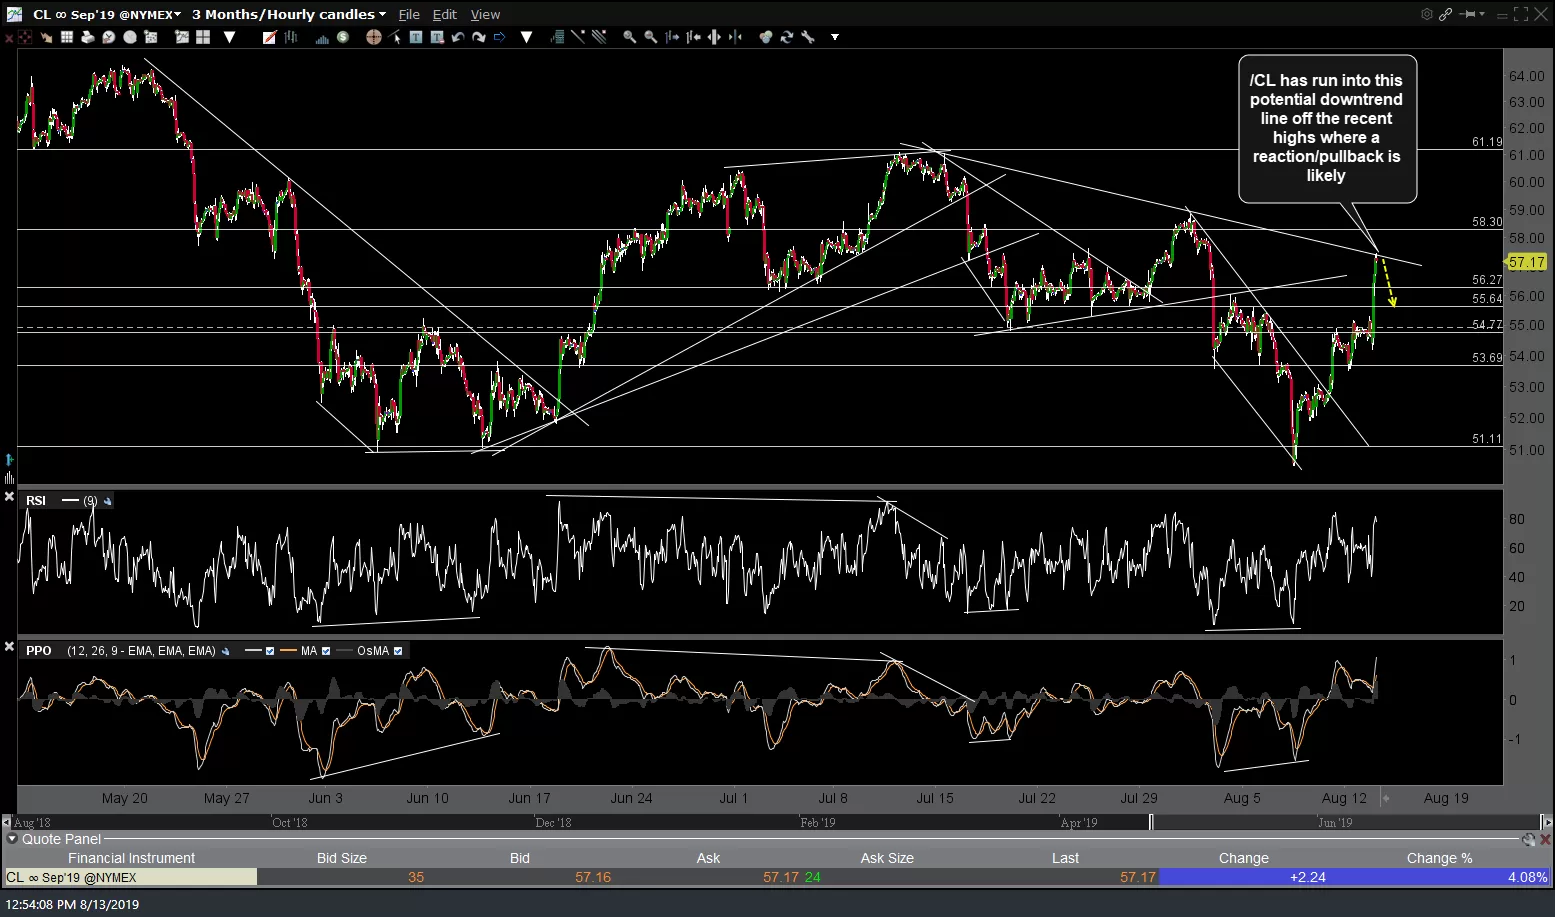
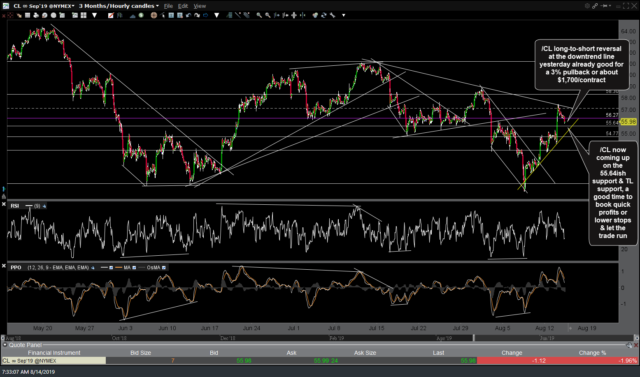
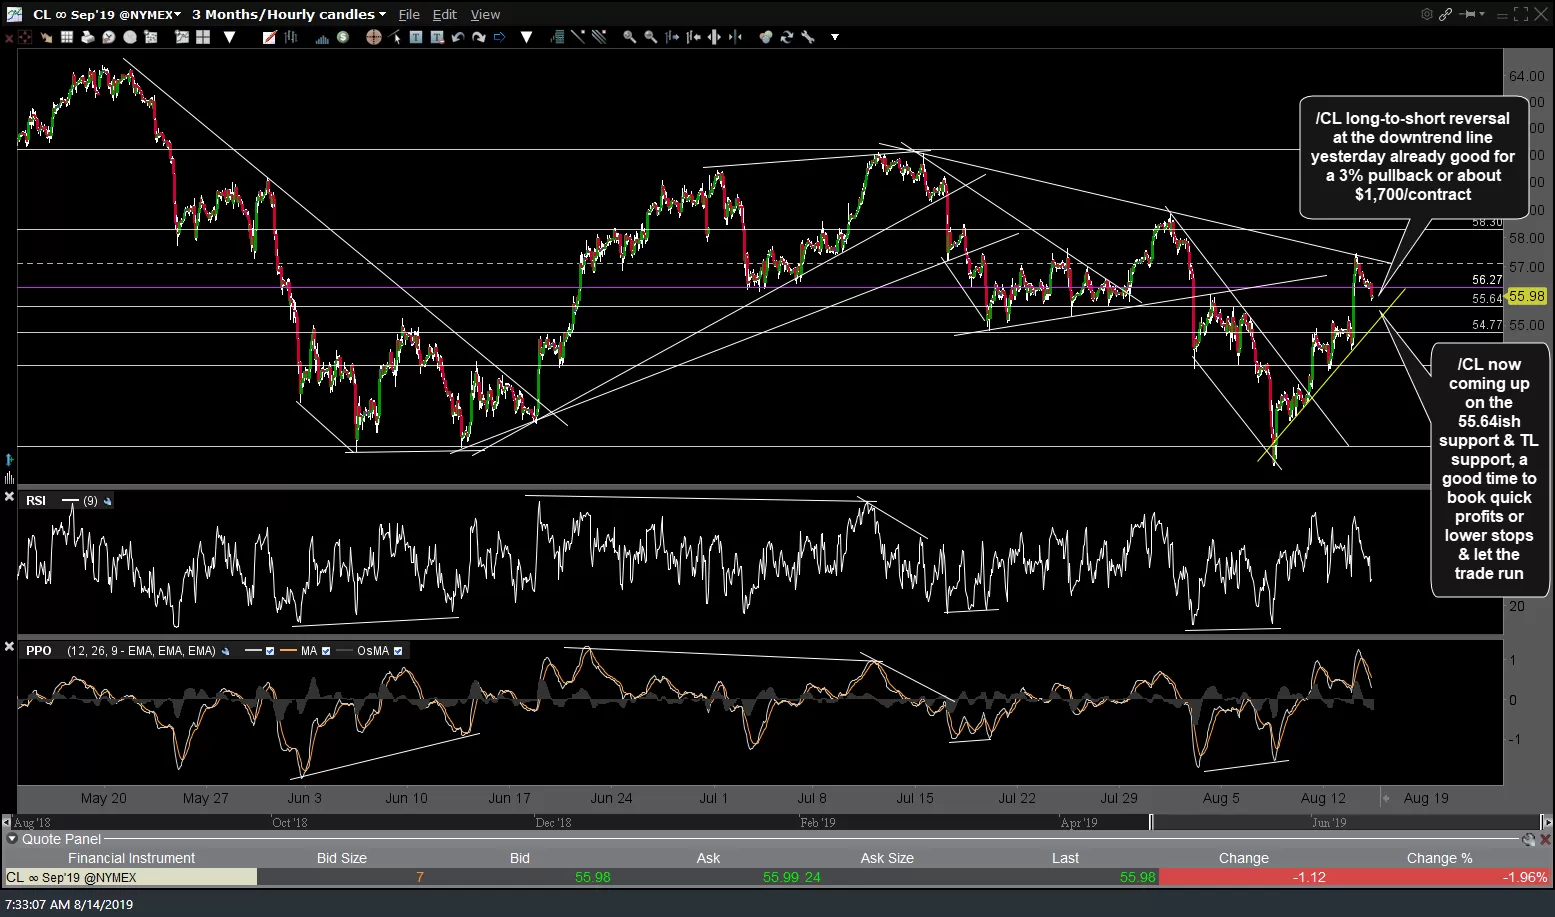
The /CL (crude oil futures) long-to-short reversal at the downtrend line that was posted in the Trading Room yesterday is already good for a 3% pullback or about $1,700/contract in addition to the 4.8% gain from the long trade entry above 54.80 on Monday (first chart below). /CL is now coming up on the 55.64ish support & TL support, a good time to book quick profits or lower stops & let the trade run. As stated in yesterday’s video, crude typically has a positive correlation to the stock market (hence the concurrent drop in both since yesterday’s highs & throughout the overnight & early morning trading so far). As such, whether or not crude futures continue to fall from here, taking out those nearby supports will likely depend on how the stock futures trade today & going forward.
-
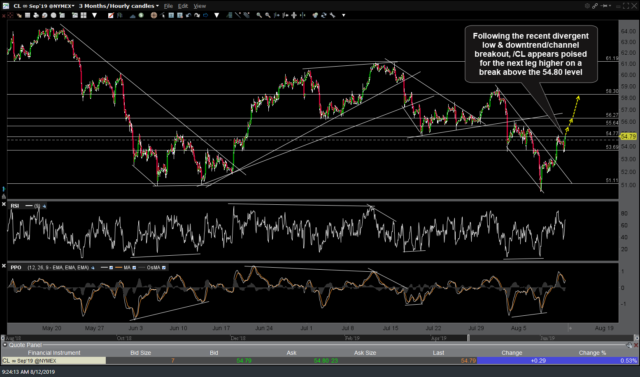
- CL 60-min Aug 12th

-
- CL 60-min Aug 13th
-
- CL 60-min Aug 14th
So far, /ZW (wheat futures) has snapped back above the 471 support following yesterday’s brief momo-fueled overshoot below. Another break above the downtrend line & especially Friday’s highs would be bullish.
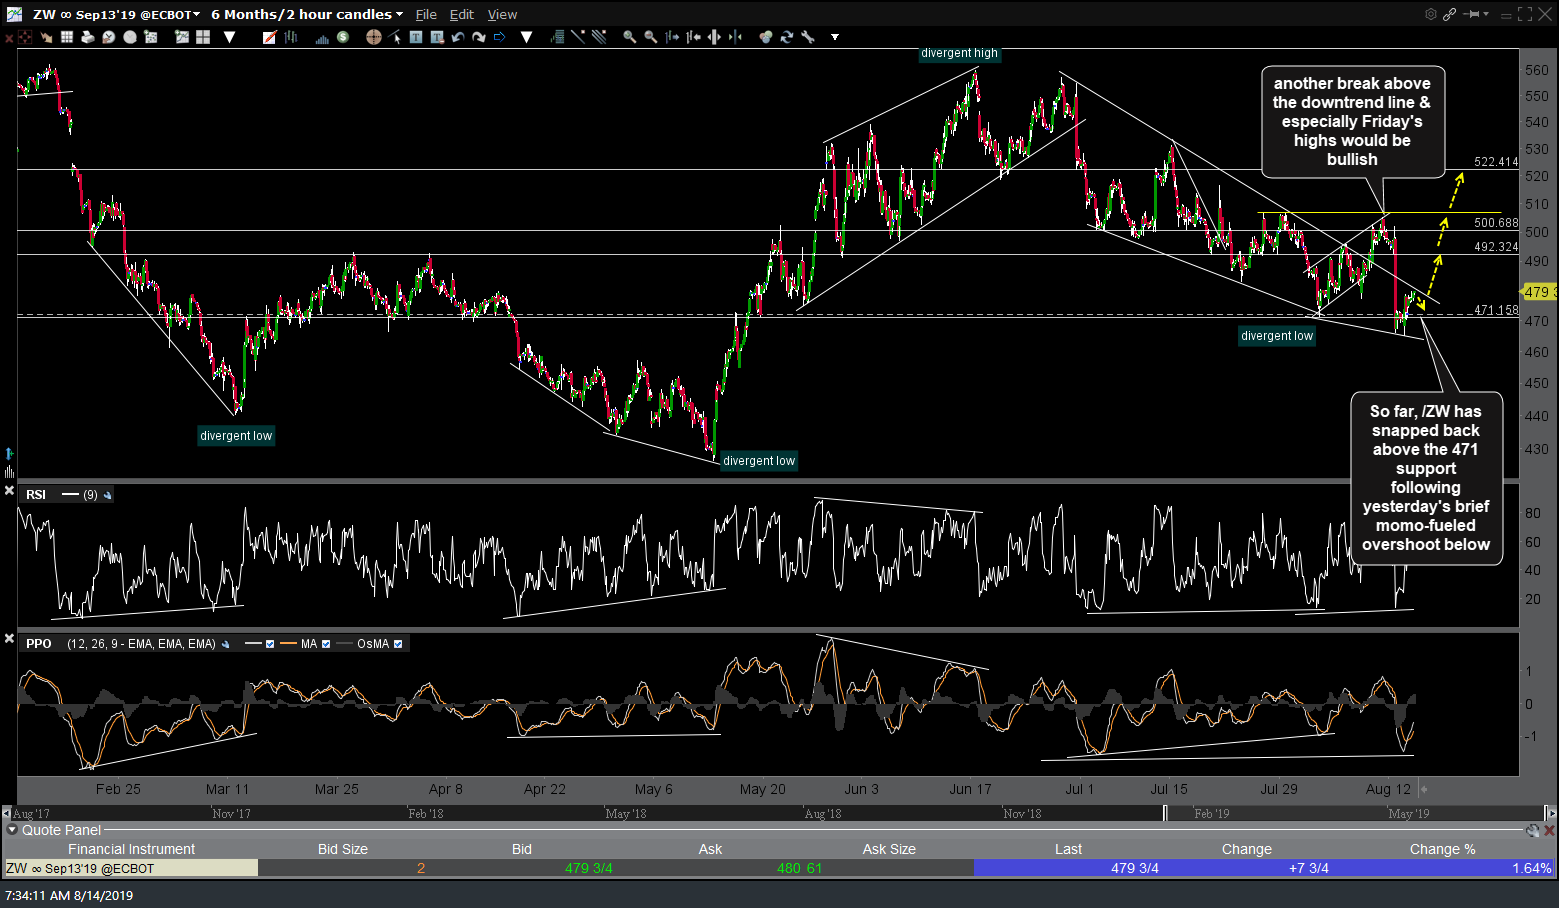
ZW 60-min Aug 14th
/ZB (30 year Treasury Bond futures) continues to wedge higher without any sell signal, including a trendline line, as of now & will likely continue to do so as long as equities fall.

ZB 60-min Aug 14th