
Here are a few of the charts I’m watching today on various stock indices, commodities & precious metals via 60-minute futures. Please note that I will be away from my desk from approximately 8:30 – 11:00 am today for a dentist appointment & will reply to any questions or comments that I can’t get to before I leave after I return.
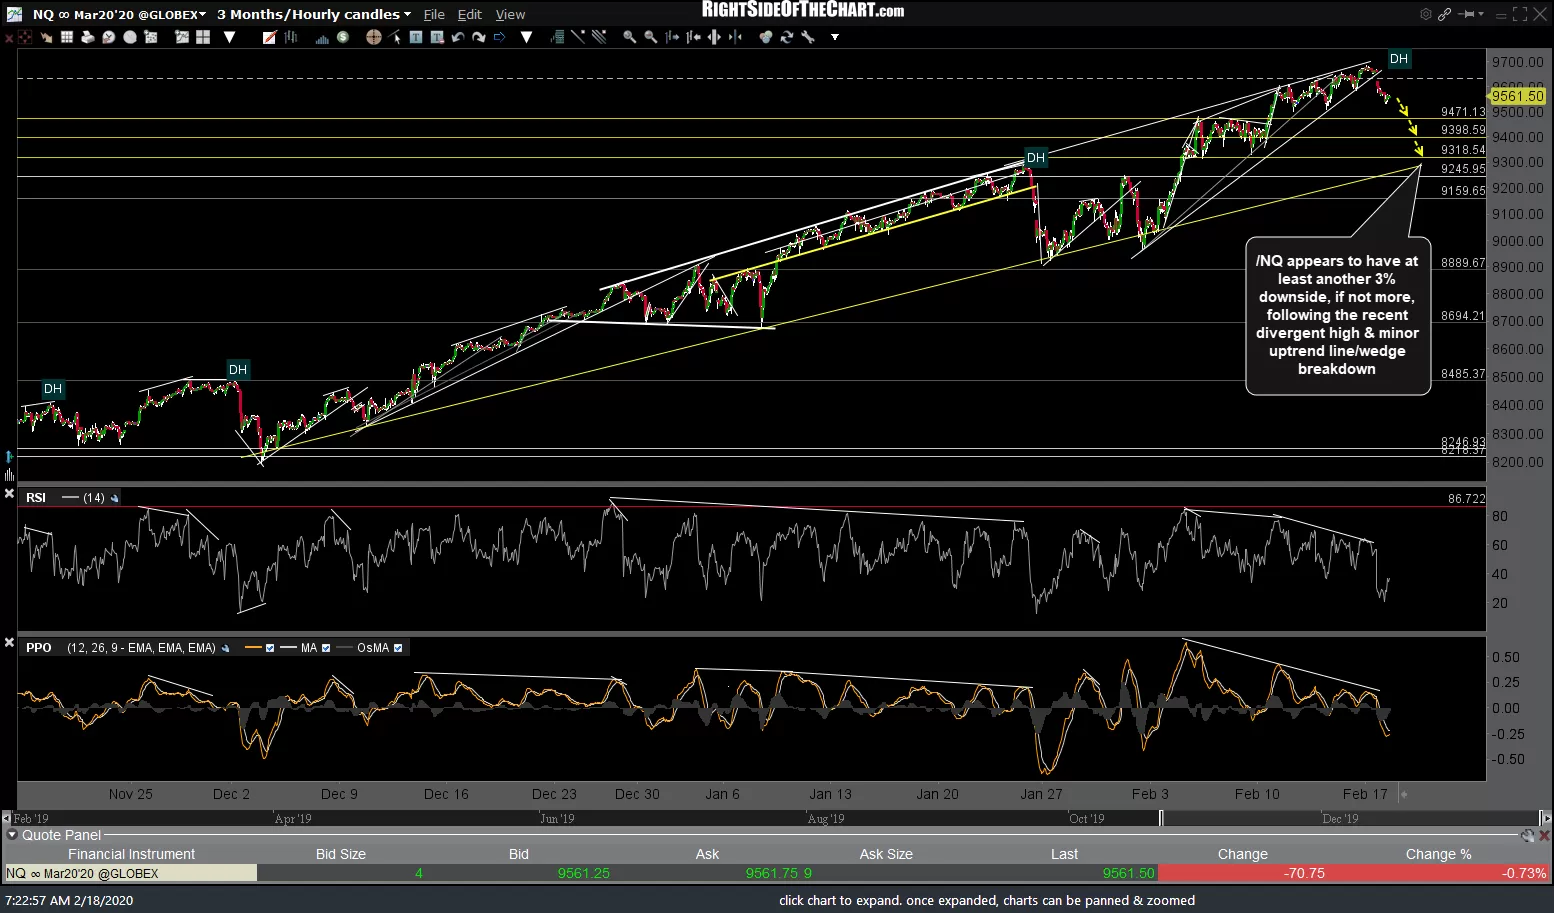
We’ll start out with the major stock indexes which have continued to defy divergences, overbought conditions, & even several short-term sell signals via minor uptrend line & price support level breaks for quite some time now. However, sooner or later, one of those sell signals & other potentially bearish developments will play out for the next tradable pullback so here are some nearby support levels on /ES & /NQ that could serve as potential pullback targets, should these most recent breakdowns stick.
-

- NQ 60m Feb 18th
-
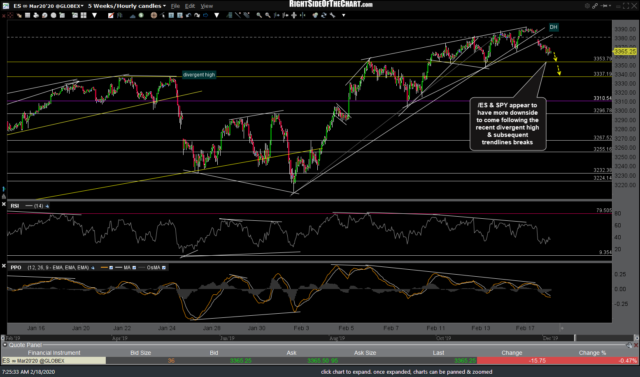
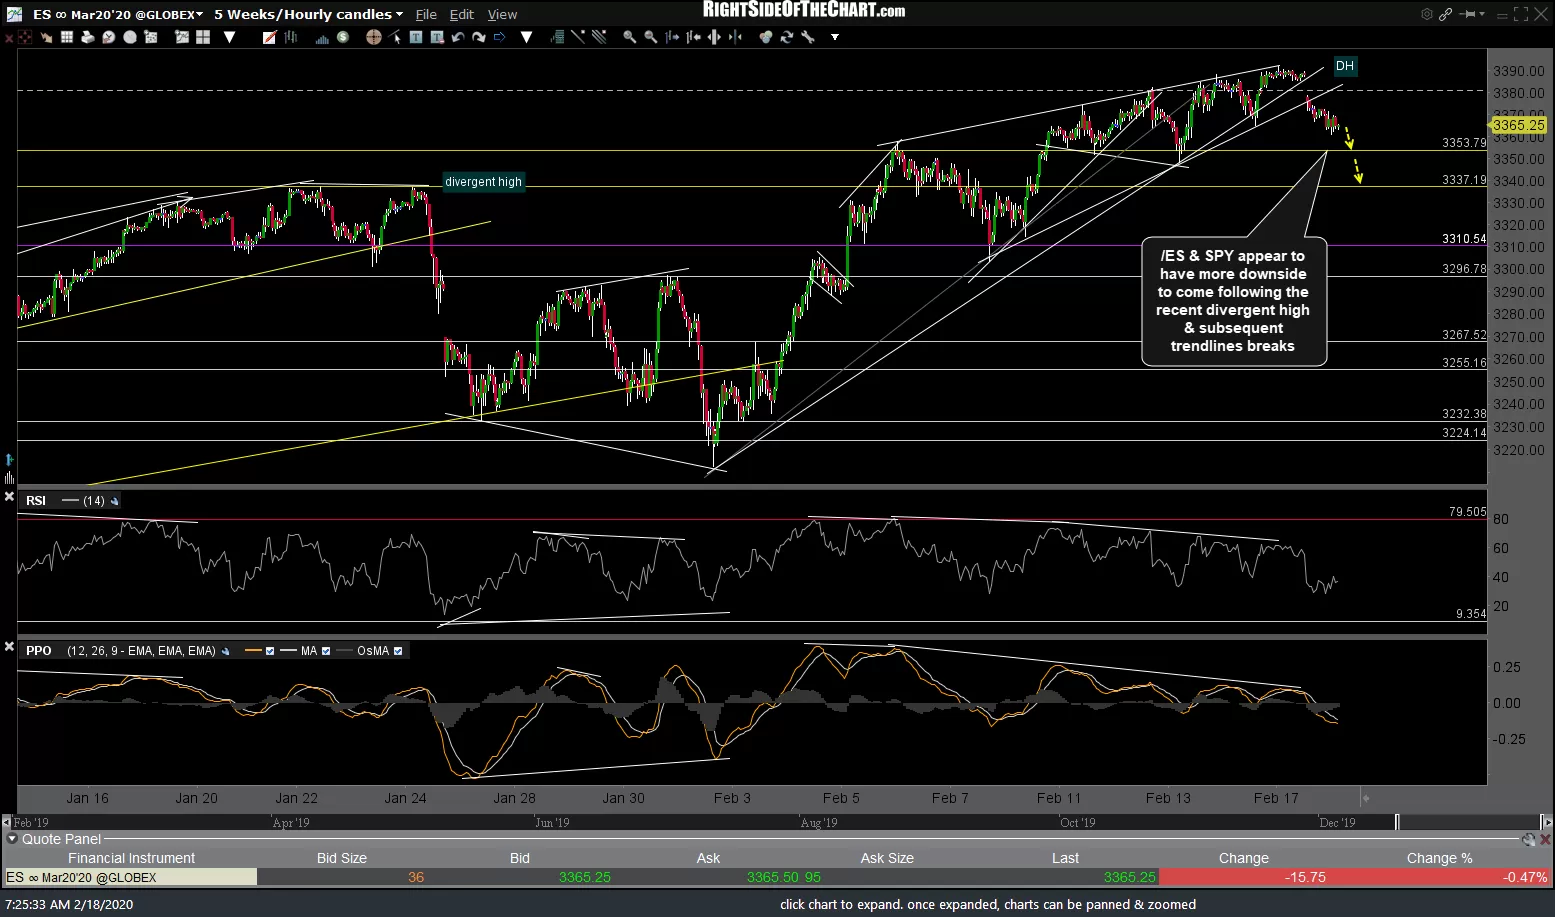
- ES 60m Feb 18th
/GC gold went on to make a breakout & successful backtest of the 1580 resistance level highlighted last week to trigger an objective entry (actually two objective entries, one on the breakout & another on the subsequent backtest) and has been moving higher since.
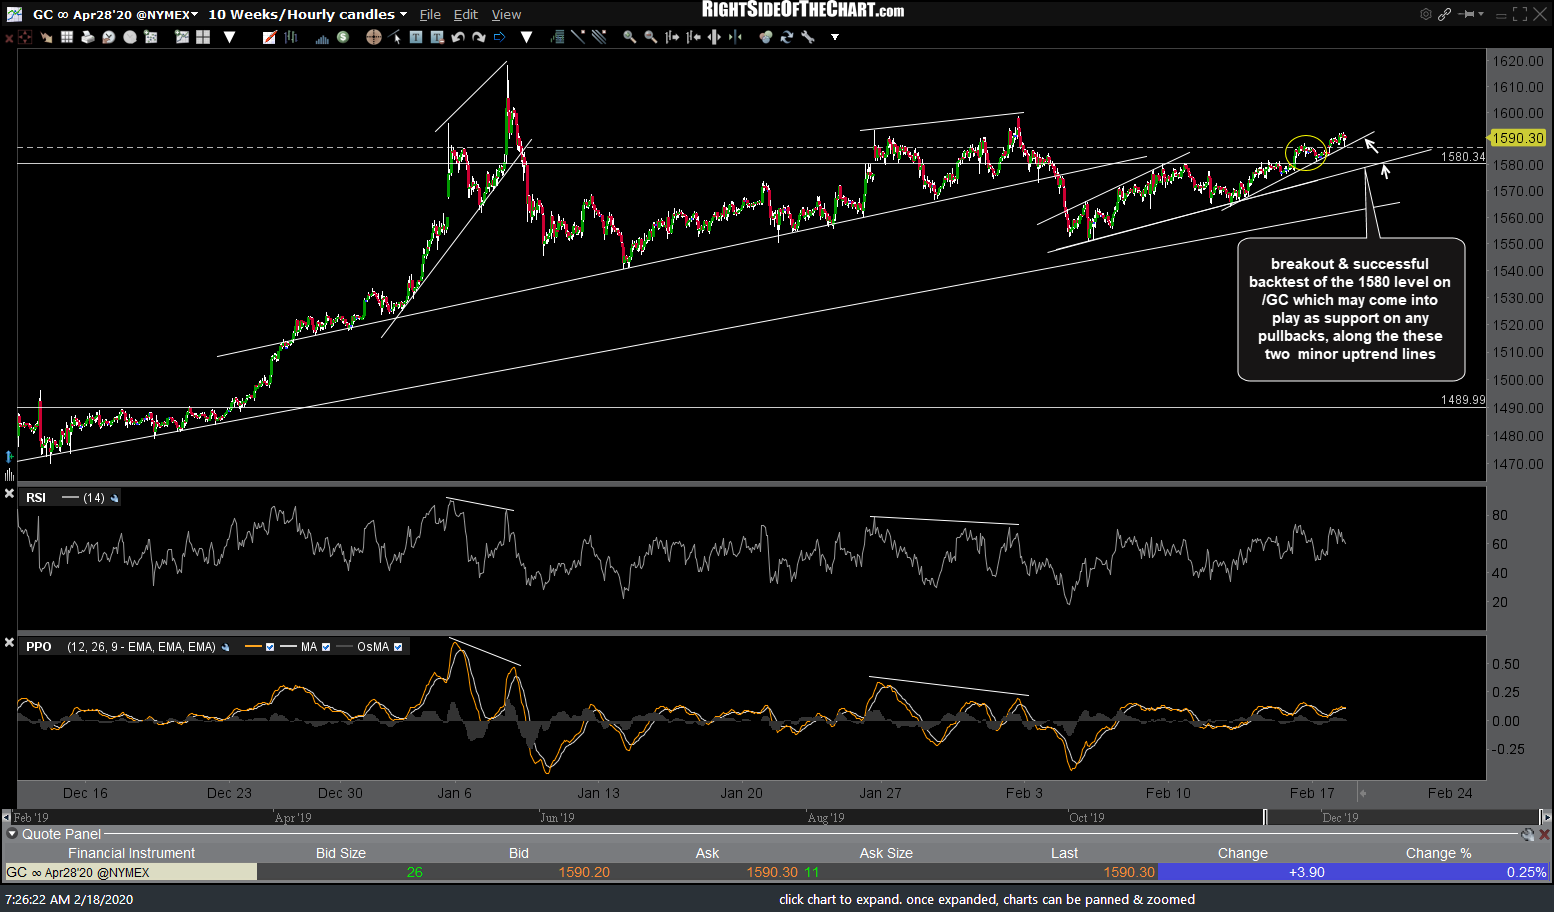
GC 60m Feb 18th
/SI silver has also provided several objective long entries since last week’s update, going on to breakout & successfully backtest the downtrend line followed by a tag of the first target at 17.821 & another buy signal today as silver has now taken that resistance level out following the pullback off the initial tag.
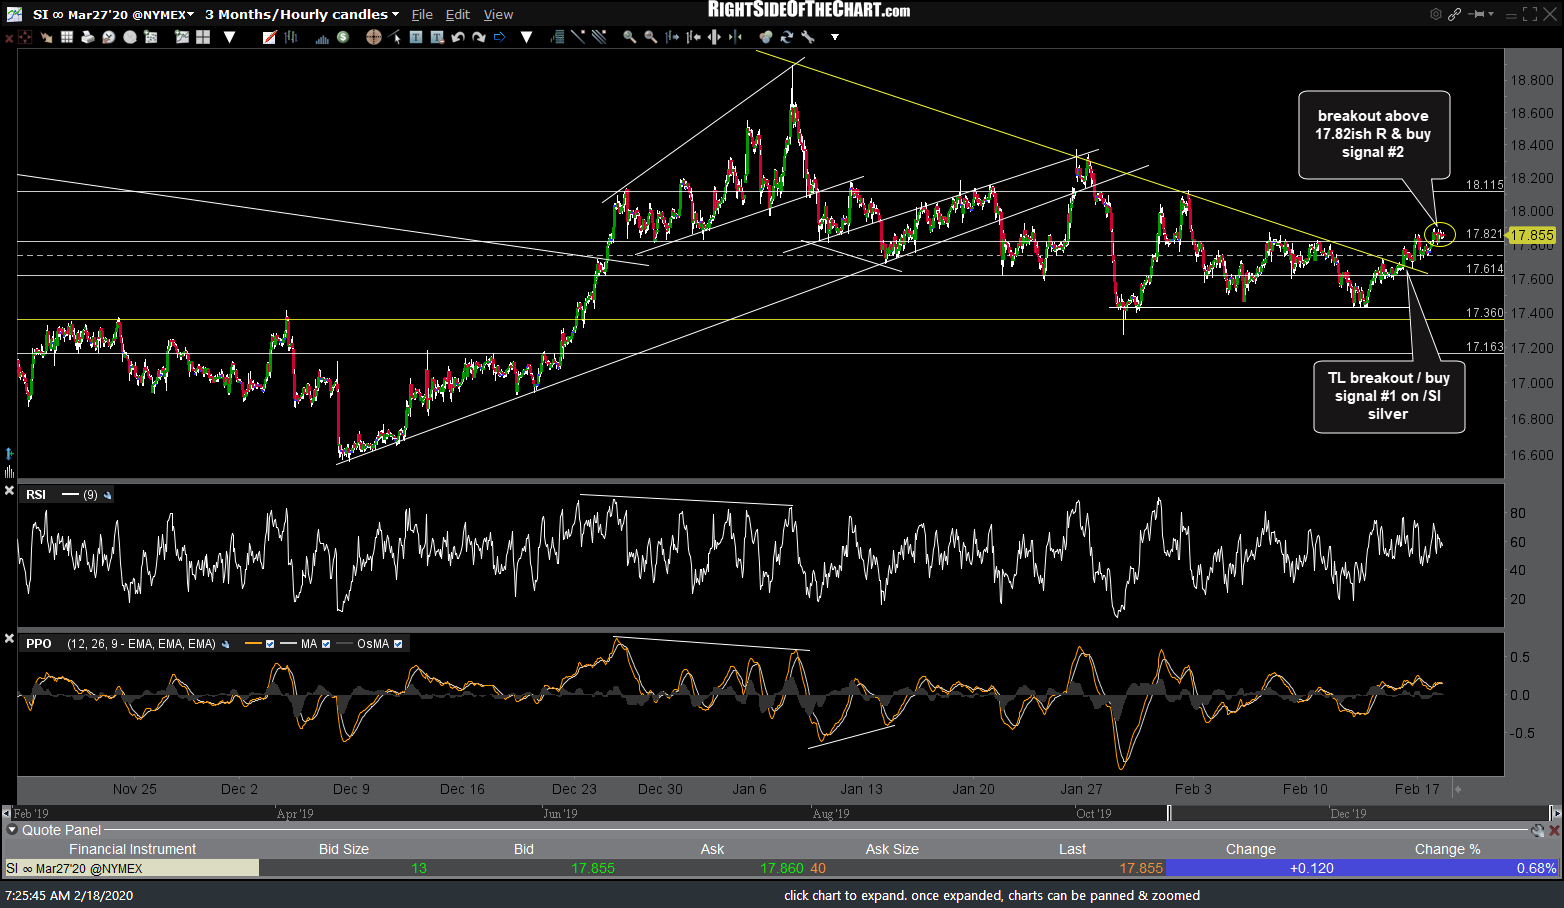
SI 60m Feb 18th
Likewise, /PL platinum also went on to trigger another objective long entry on the breakout above the 978.50ish resistance level following the recent breakout & backtest of the downtrend line. Ideally, 978.50ish should act as support going forward with the next targets around 987.60 & then 998.60ish.
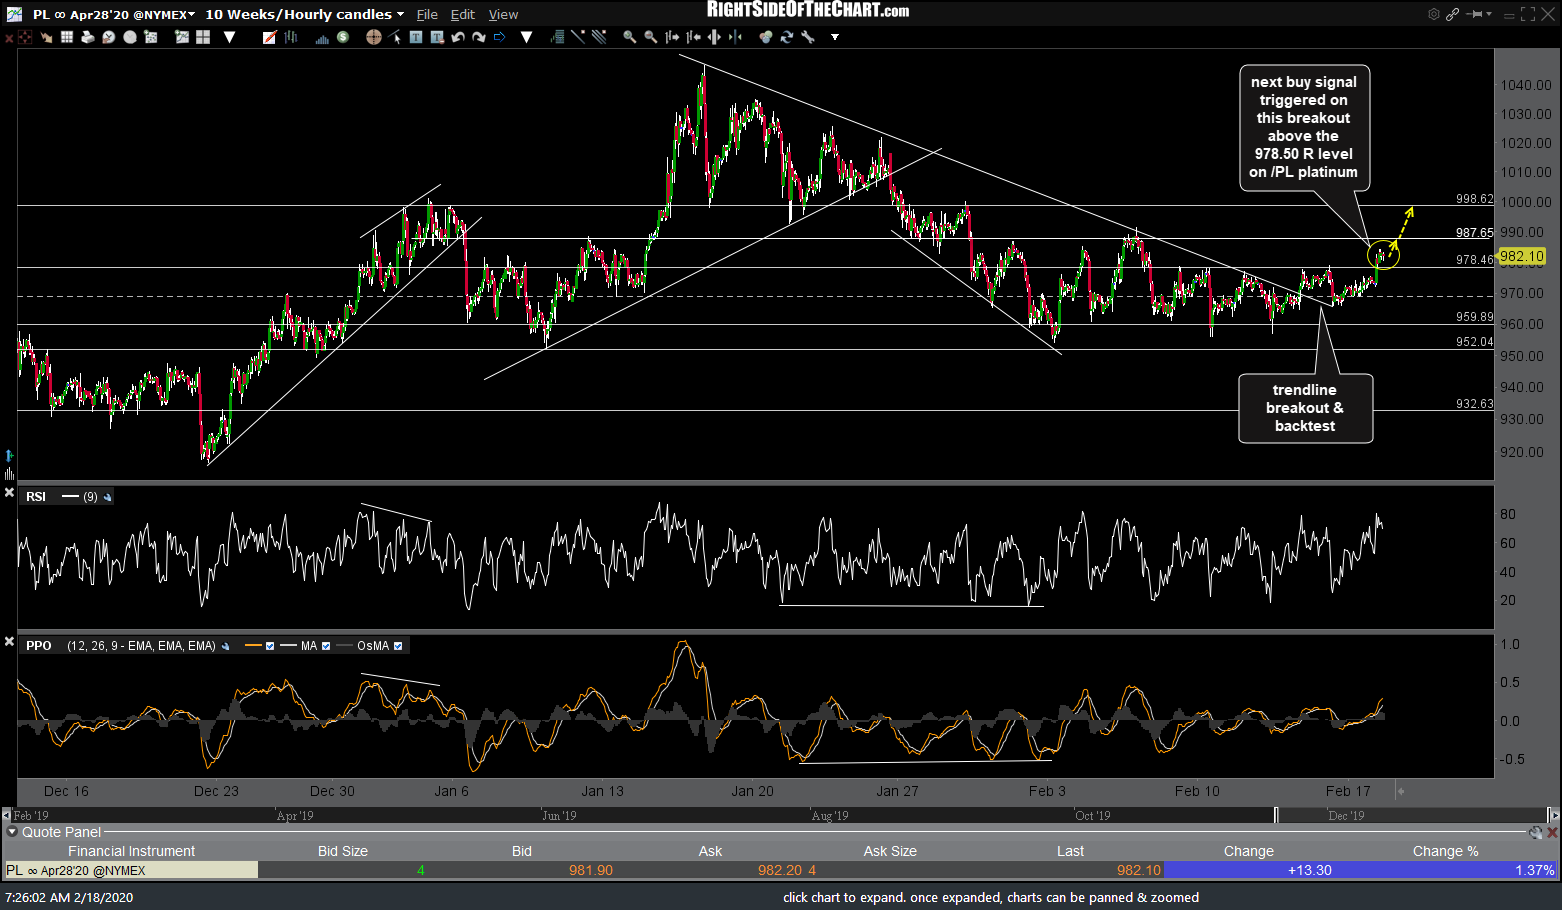
PL 60m Feb 18th
Following the recent divergent low & subsequent breakout & backtest of the bullish falling wedge pattern, /CL was recently rejected off the 52.50ish resistance level with the next buy signal to come on a solid break above that level with a move up to the 55ish price target likely if so.
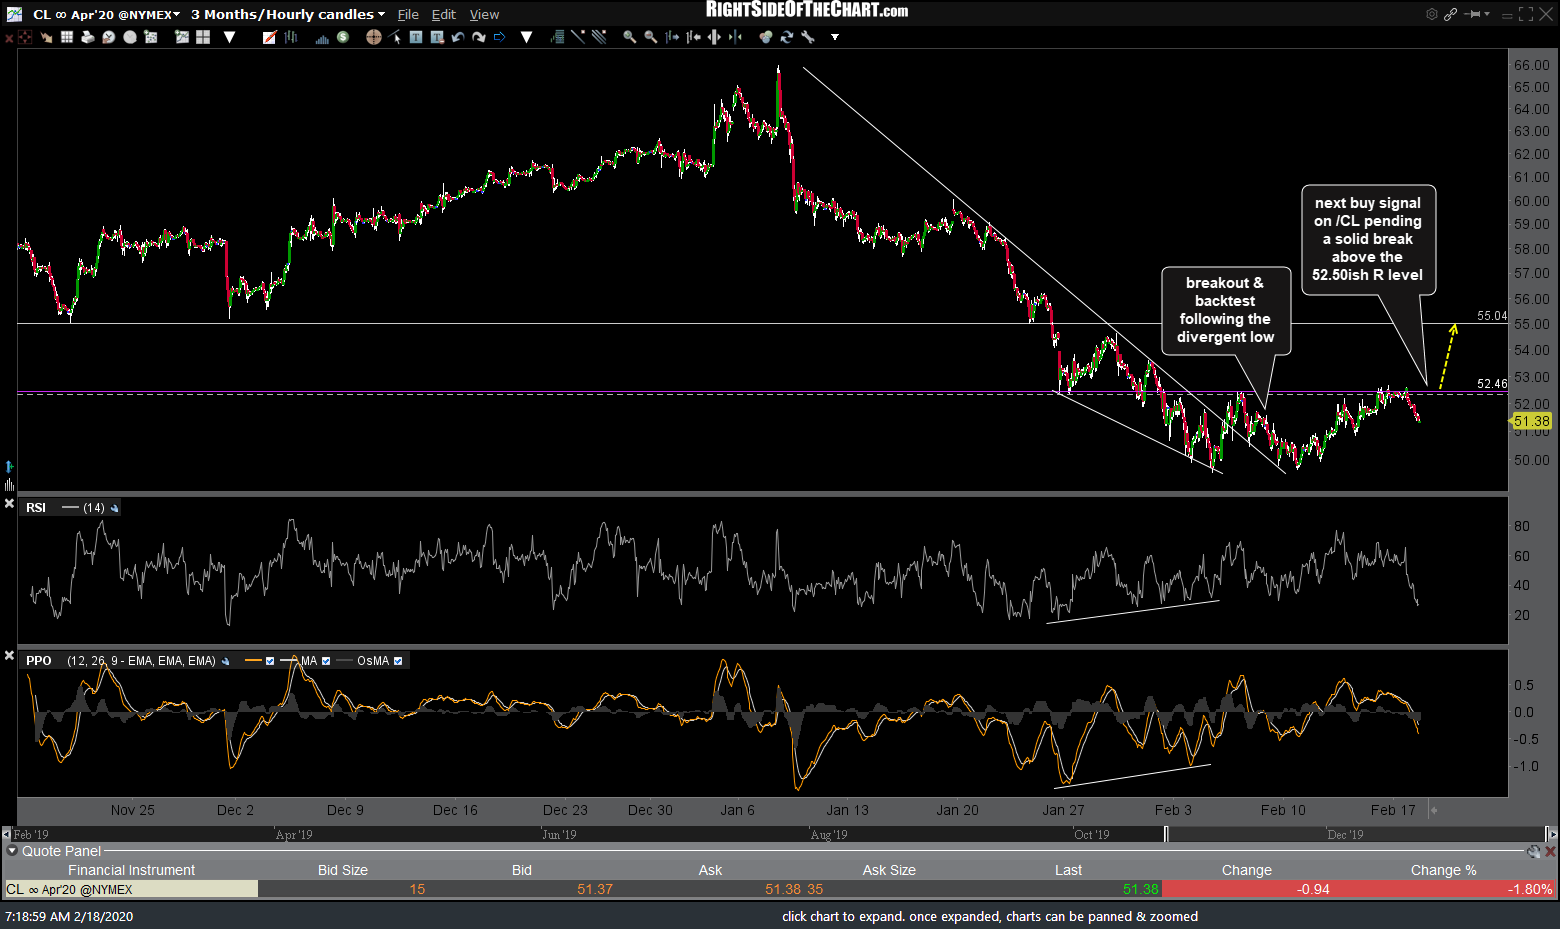
CL 60m Feb 18th
Following the recent divergent low, /NG natural gas has rallied into the 1.954 resistance level where a pullback is likely before the next leg up. The next objective entries will come on either a pullback to the 1.888ish support and/or a solid break above the 1.954 resistance level.

NG 60m Feb 18th
/BRR Bitcoin sell signal triggered on the breakdown below this 60-minute uptrend line following the recent divergent high.
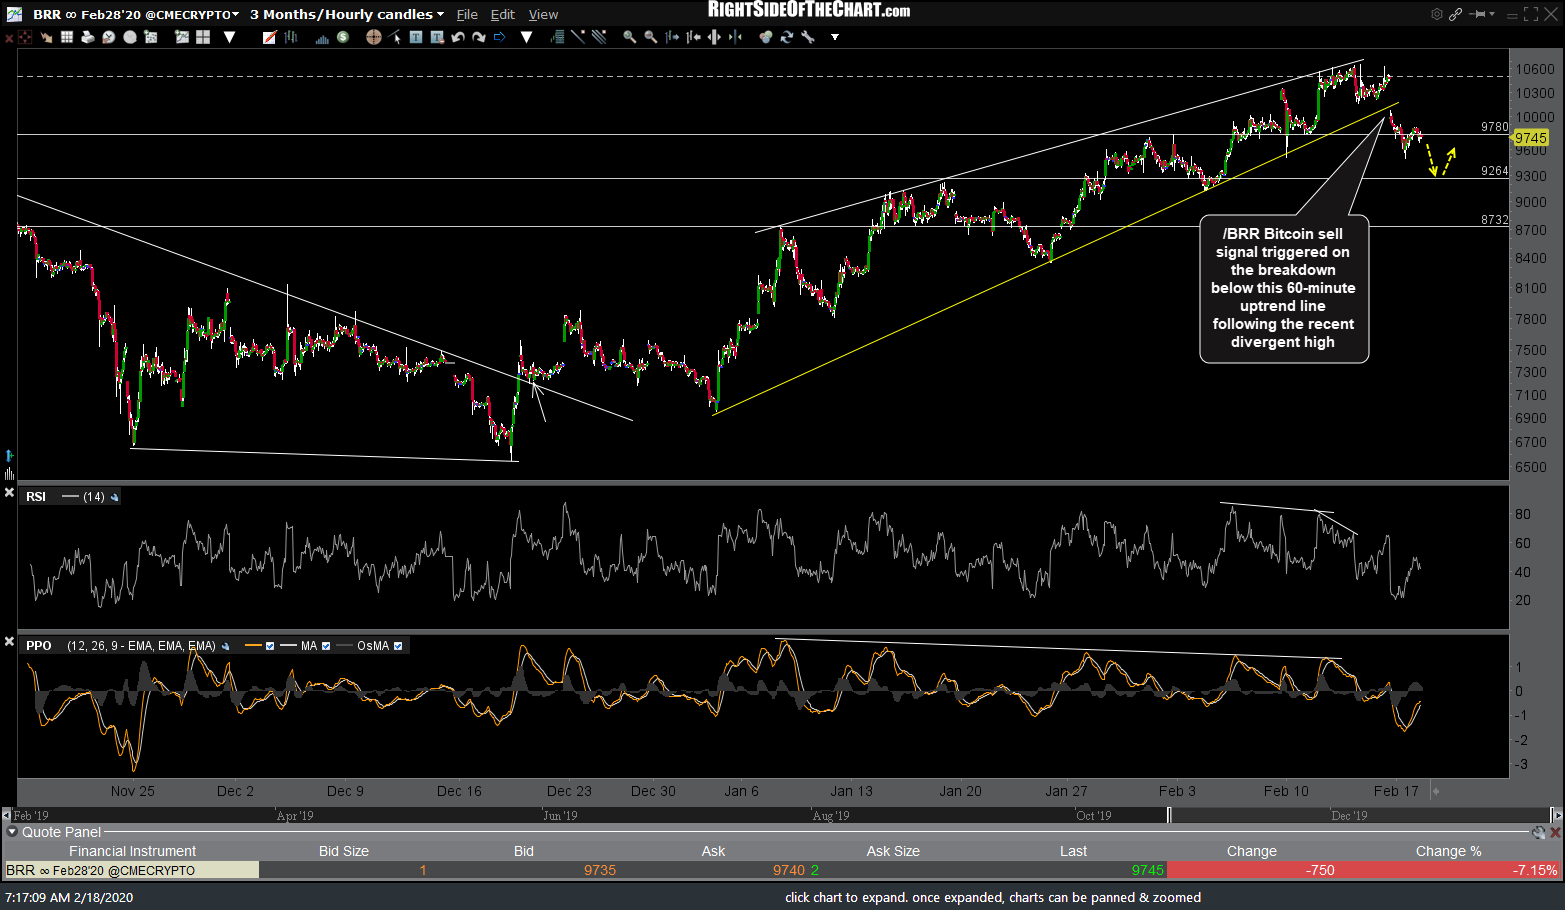
BRR 60m Feb 18th
I’ll post some updates, including the charts of some of the related ETFs such as SPY, QQQ, GBTC, UGAZ, USO, GLD, etc. after I return to my desk later today.