/NQ (Nasdaq 100 futures) continues to backtest the 60-minute uptrend line from below following last week’s breakdown with a break below this small wedge/minor trendline likely to spark a sell-off that could have a cascading effect if & as each of the subsequent support levels below (arrow breaks) are taken out. 60-minute chart:

NQ 60m 2 Nov 18th
/PA (palladium) has been backtesting the minor trendline from below with a break below the 1669ish support likely to spark another wave of selling although my convictions aren’t very high right now as odds for a pullback in the equity markets that week remain high & if so, that should be bullish for the precious metals, particularly gold & silver although platinum & palladium may catch sympathy bids along with the other precious metals. As of now, I am still holding a short position on /PA which is partially/indirectly hedged by longs on gold & silver.

PA 60m Nov 18th
/GC gold appears to have likely completed the first corrective wave/pullback following the initial thrust up after the recent divergent low & 60-minute downtrend line breakout, especially if we get a pullback in the stock market this week.

GC 60m Nov 18th
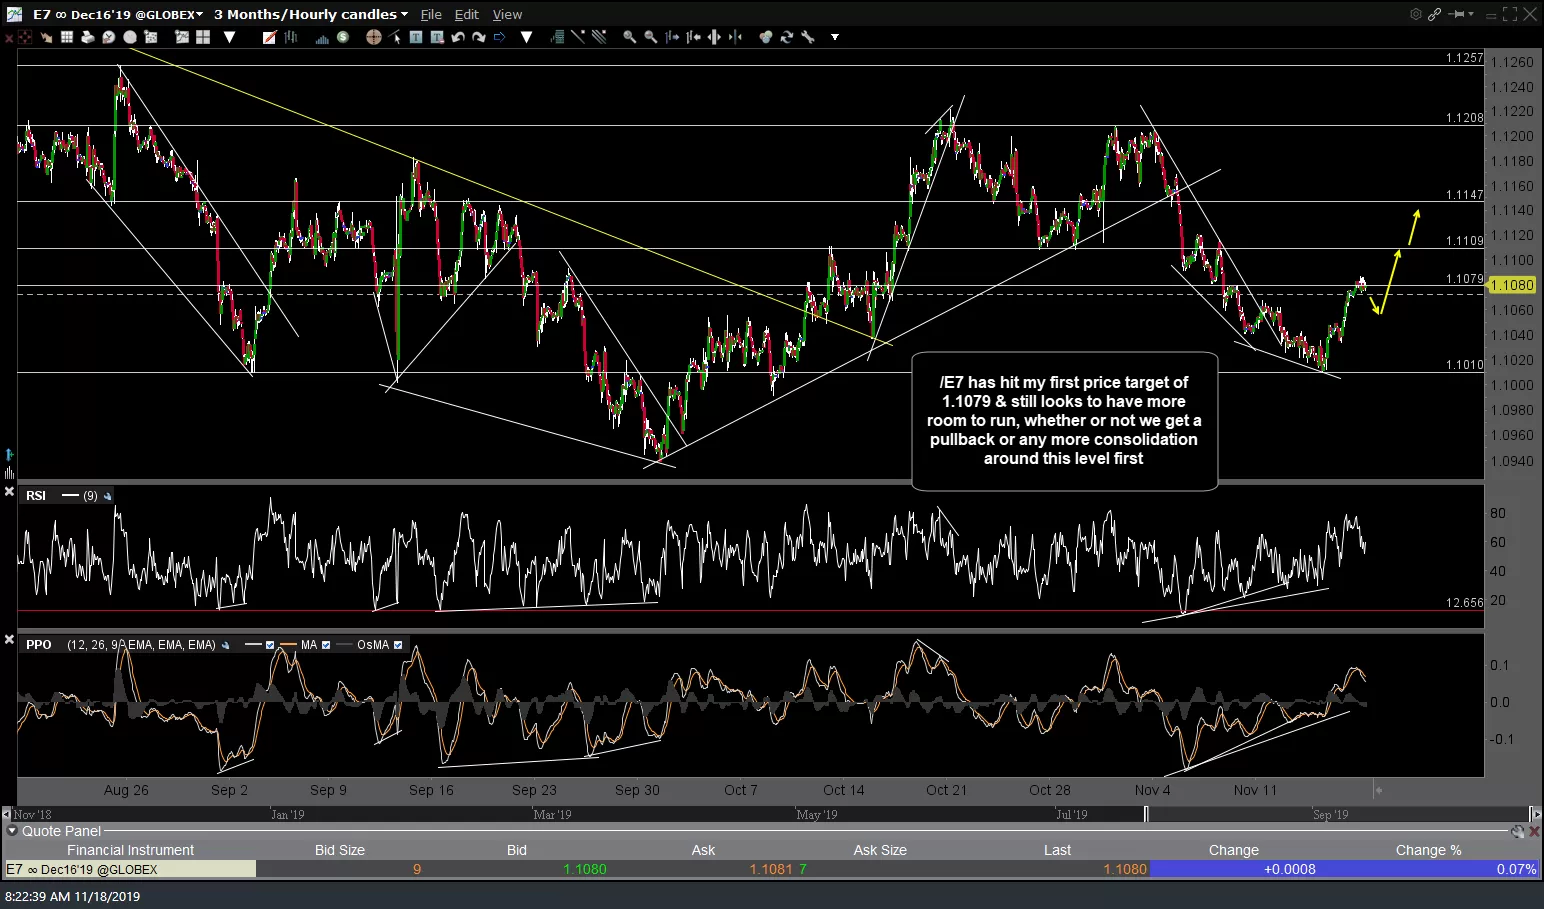
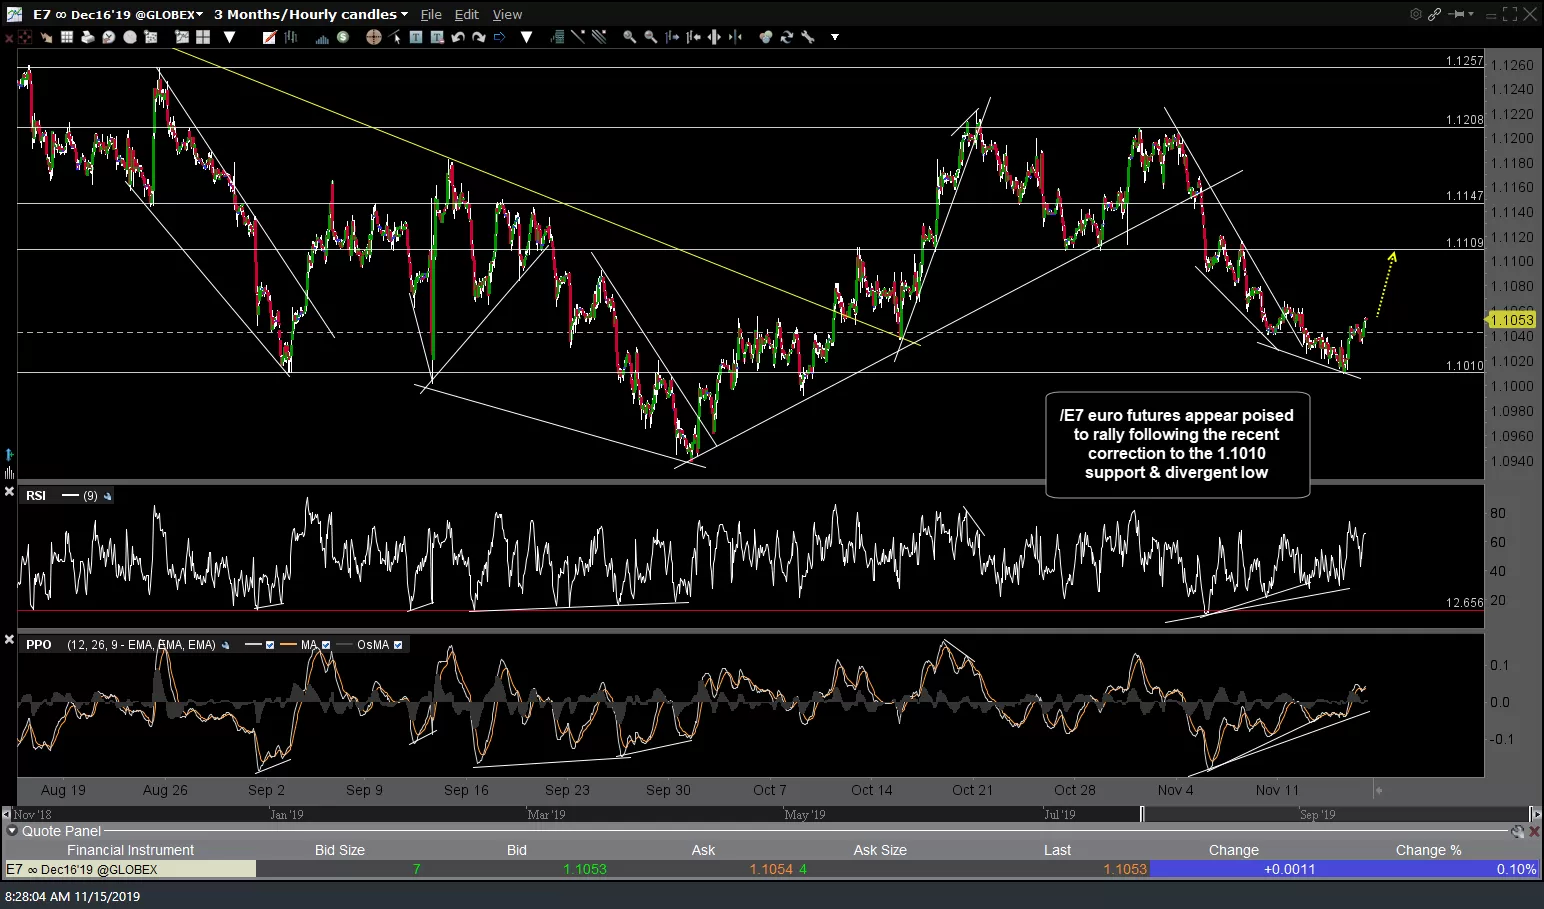
/E7 (Euro futures) has hit my first price target of 1.1079 & still looks to have more room to run, whether or not we get a pullback or any more consolidation around this level first. The previous (Friday’s) & today’s updated 60-minute charts are below. Edit: I just realized that I had added the 1.1079 resistance/target level on Friday after posting the first chart below about an hour before the stock market opened on Friday. I still favor a continued move up to at least the 1.1109 target & quite likely beyond in the coming days/weeks.
-

- E7 60m Nov 15th
-
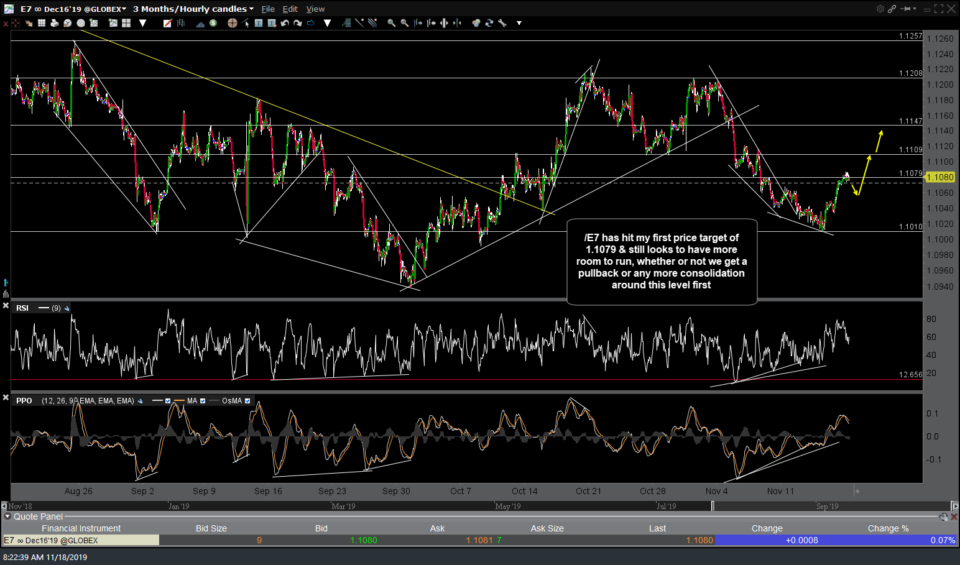
- E7 60m Nov 18th