
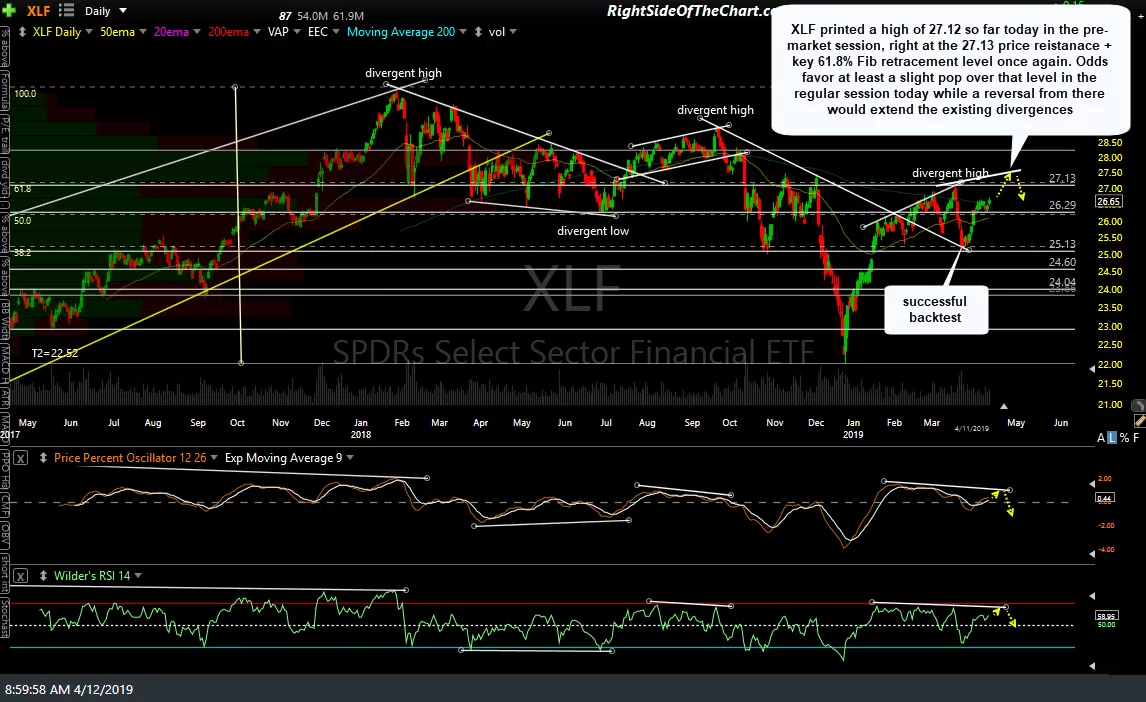
XLF, à la JPM earnings in pre-market today, printed a high of 27.12 so far today in the pre-market session, right at the 27.13 price resistance + key 61.8% Fib retracement level once again. Odds favor at least a slight pop over that level in the regular session today while a reversal from there would extend the existing divergences. To be clear, a solid breakout & close above the 27.13 resistance level is bullish until & unless the breakout fails & the potential divergent high is confirmed, as the current divergences could be taken out should XLF continue up towards the next resistance level around 28.30. Previous & updated daily charts of XLF (2nd chart reflecting prices as of yesterday’s close).
-
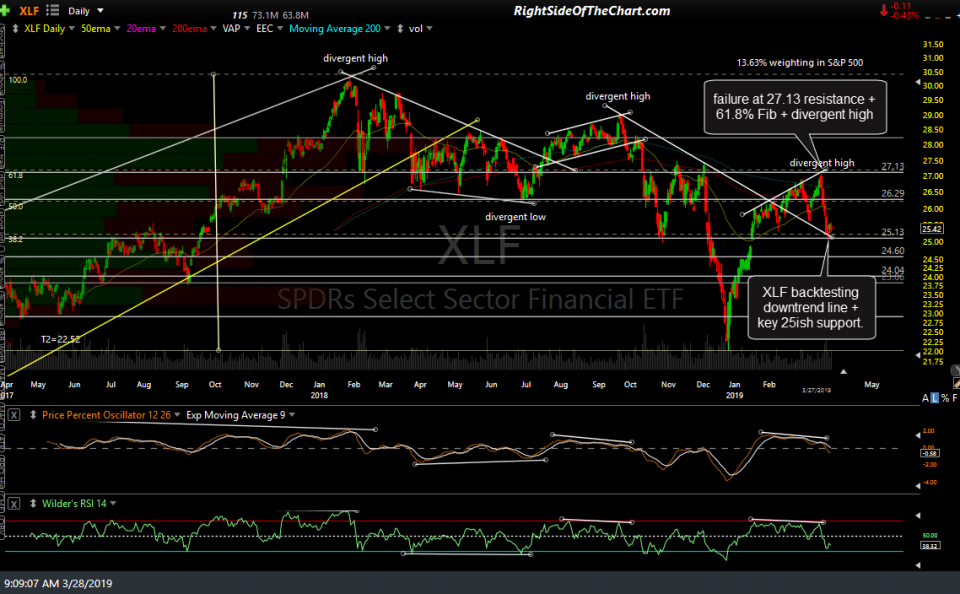
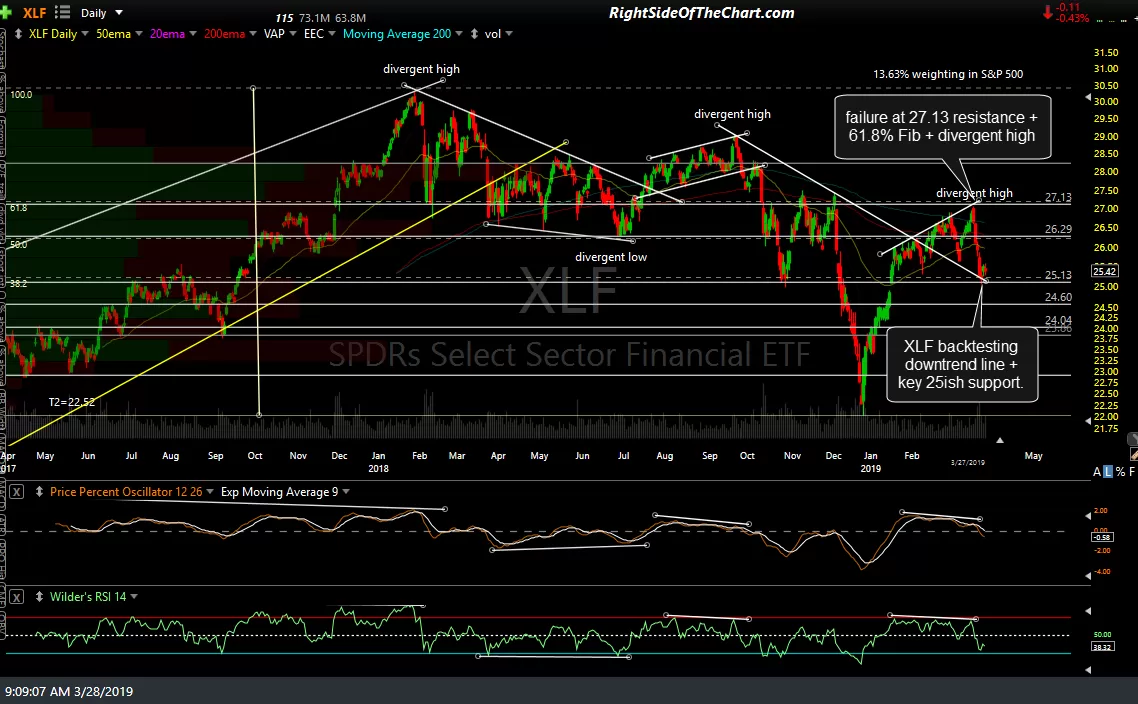
- XLF daily March 27th close
-
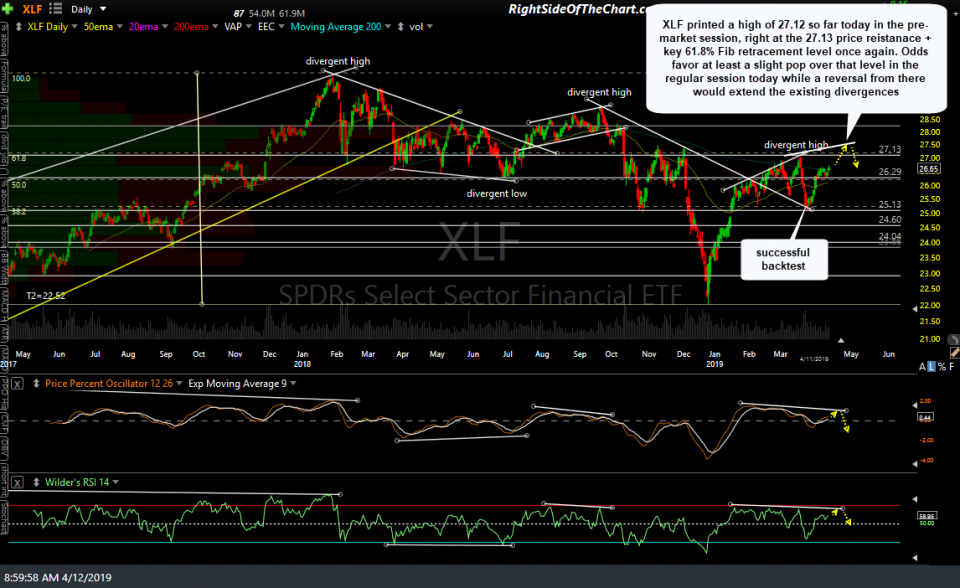
- XLF daily April 11th close
The March 28th divergent high may have marked the end of the run for TLT (20+ year Treasury Bond ETF) although a successful backtest of the 122.50ish support level followed by another thrust up beyond the recent highs would is certainly possible. My additional thoughts in reply to an update request from @campbellholland415 in the trading room earlier today:
Yes, I will update TLT today & will say that the 122.50 level should act as support & would be an objective level to enter or add to a position on TLT.
Keep in mind that TLT just put in a clear divergent high on the daily time frame and while I suspect that we might get one more thrust higher to extend & possibly even take out those divergences, they should be respected along with the fact that TLT started an impulsive move lower following that recent DH & appears to be bear flagging on the daily chart now.
Translation: Objective entry does not guarantee success so a long around the 122.50 level with a stop somewhat below in case TLT is going much lower which would likely mean that the stock market would be heading above the 2018 highs soon.
TLT daily April 11th close

EUR/USD is approaching the top of that bullish falling wedge I’ve been monitoring & appears poised for a break out soon. If so, that could help to confirm the next buy signal for gold and/or the mining stocks as a breakout in EUR/USD is analogous to the breakdown in the US Dollar and a falling Dollar is bullish for gold.
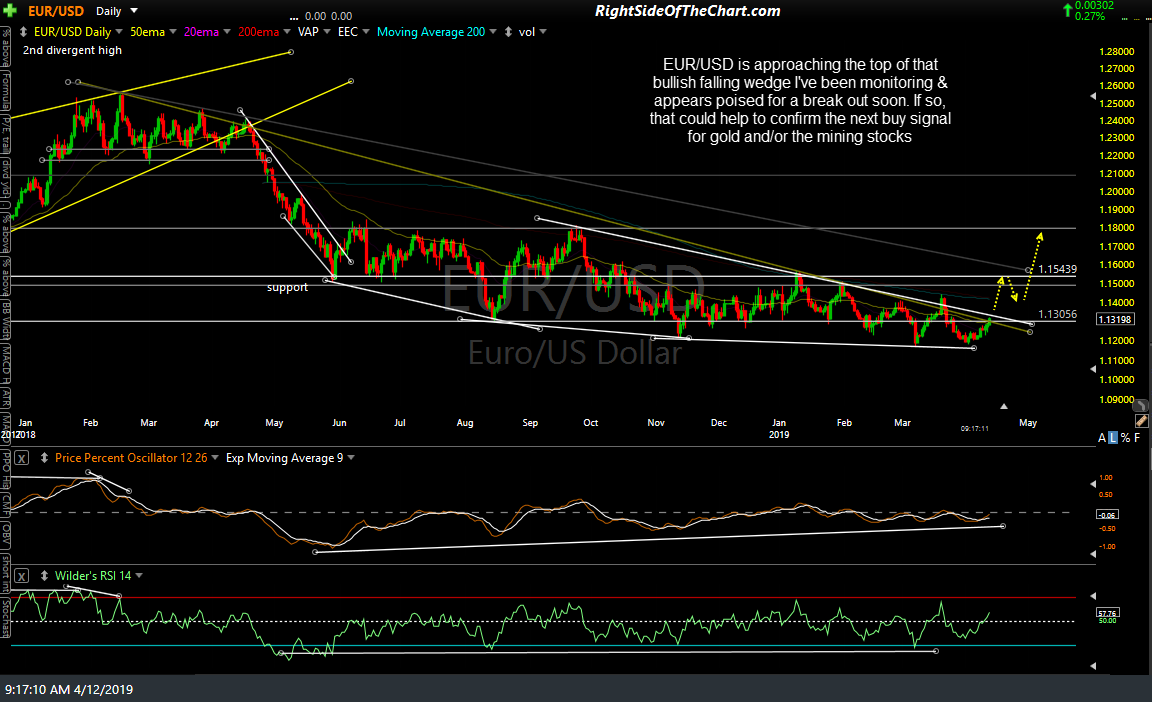
EUR-USD daily April 12th