
The negative divergences continue to build on this 60m chart of /ES (S&P 500 futures) with a sell signal to come on a solid break below this 60-minute bearish rising wedge pattern & even better on a break below 3225.
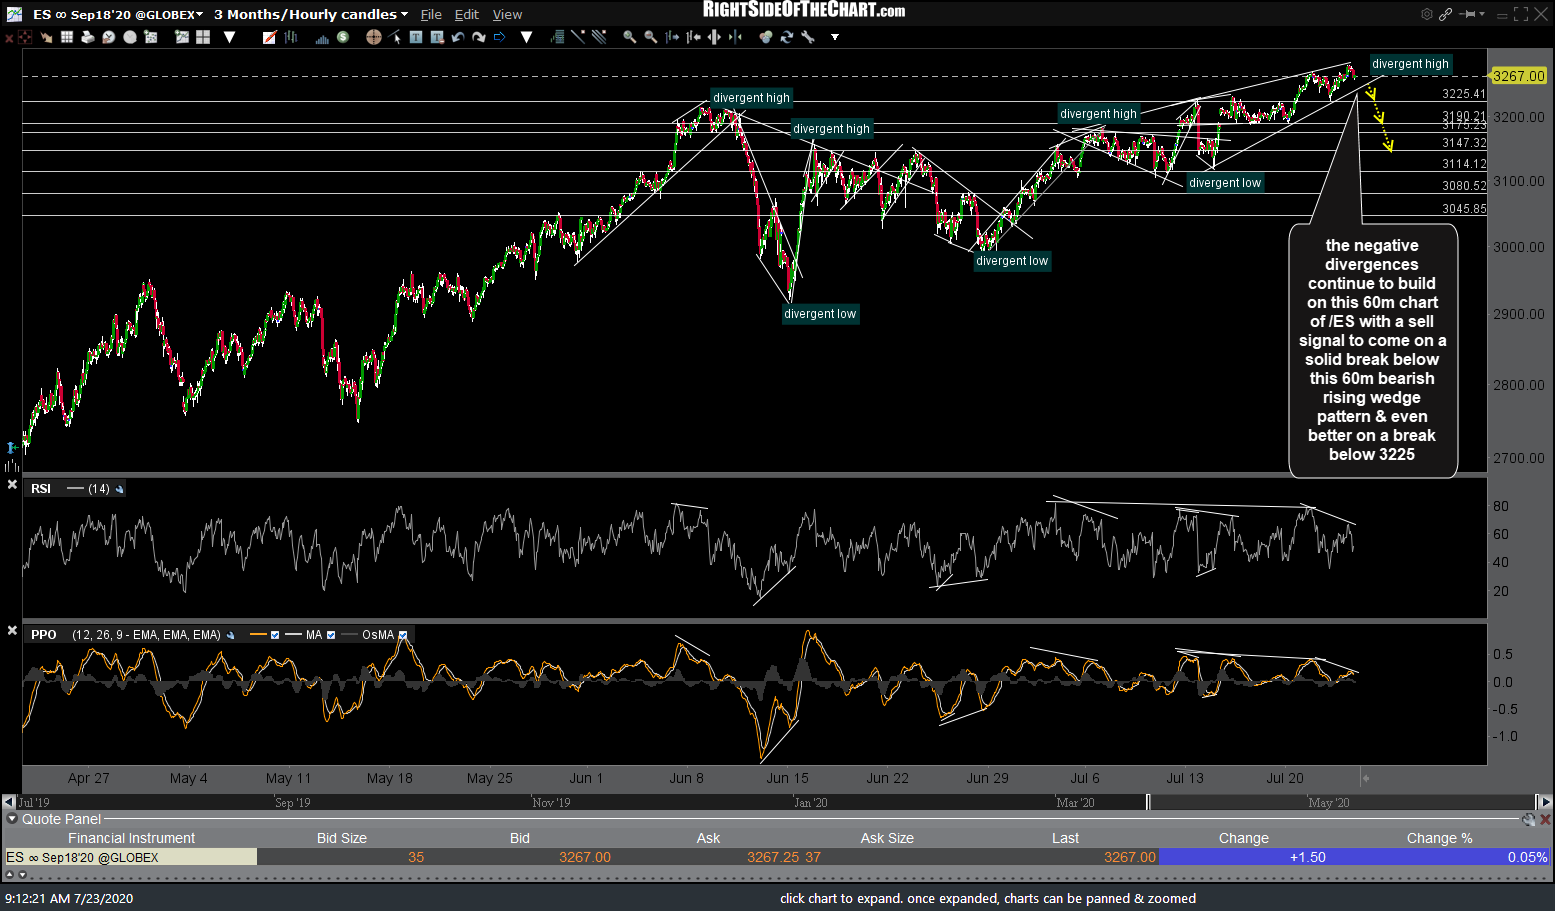
ES 60m July 23rd
/NQ (Nasdaq 100 futures) remains in an uptrend with the next sell signal pending a solid break and/or 60-minute candlestick close below this uptrend line.

NQ 60m July 23rd
As highlighted in one of the recent videos, we have a “double-tap” of the red sell signal level on my $CPC (total put/call ratio) chart… correction coming soon or will this time be different?
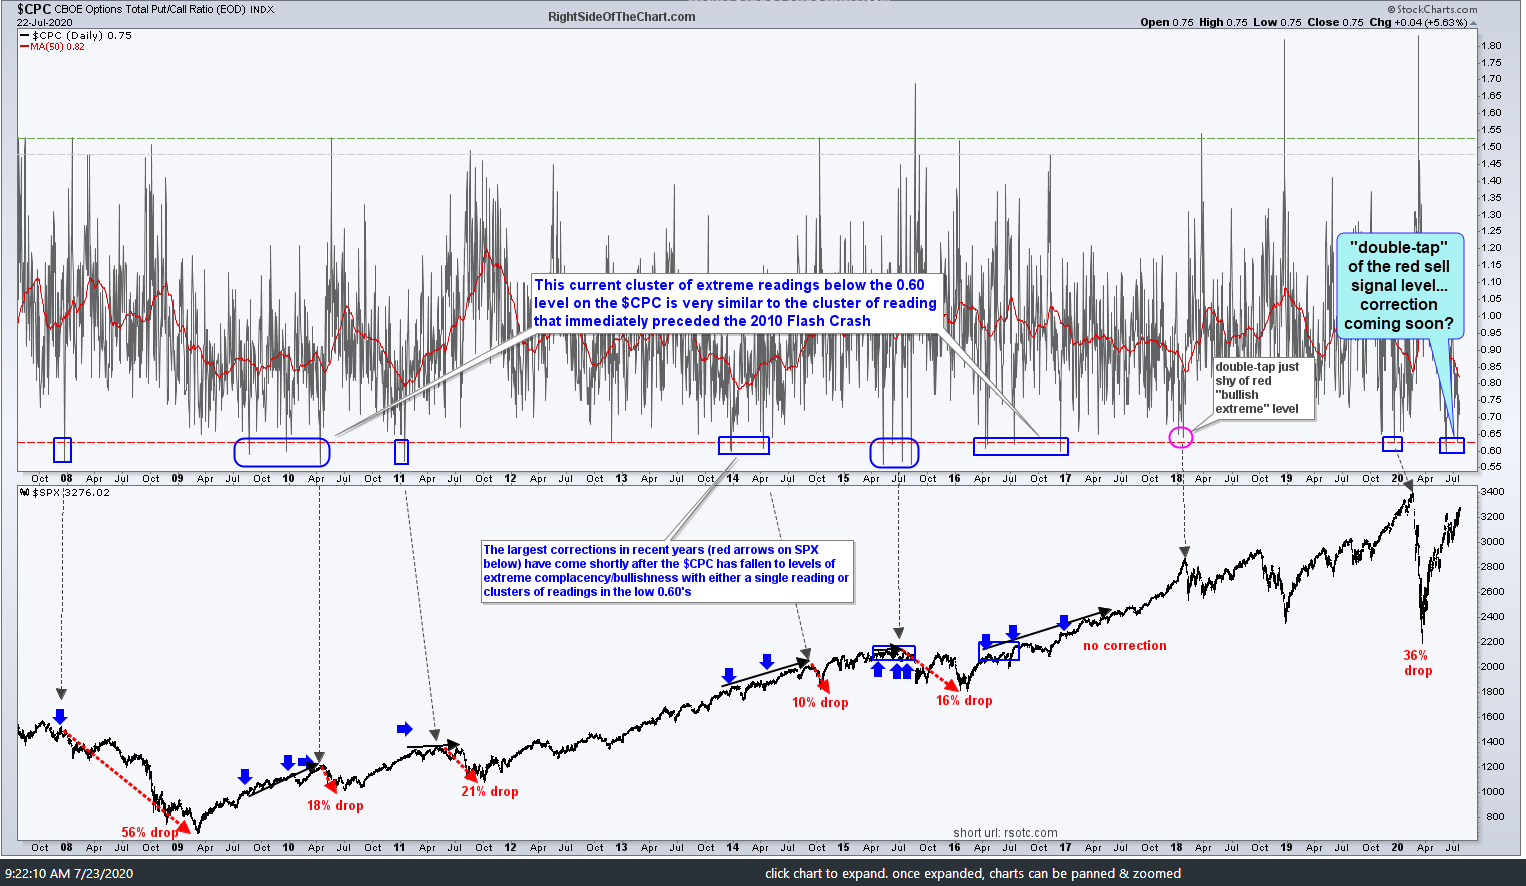
$CPC daily July 22nd close
I’m still awaiting a solid break below this 60-minute uptrend line for a sell signal on /GC (gold) although I’ve just added a minor trendline just above it that would likely bring gold futures down to the larger trendline, if/when broken. Previous & updated 60-minute charts below.
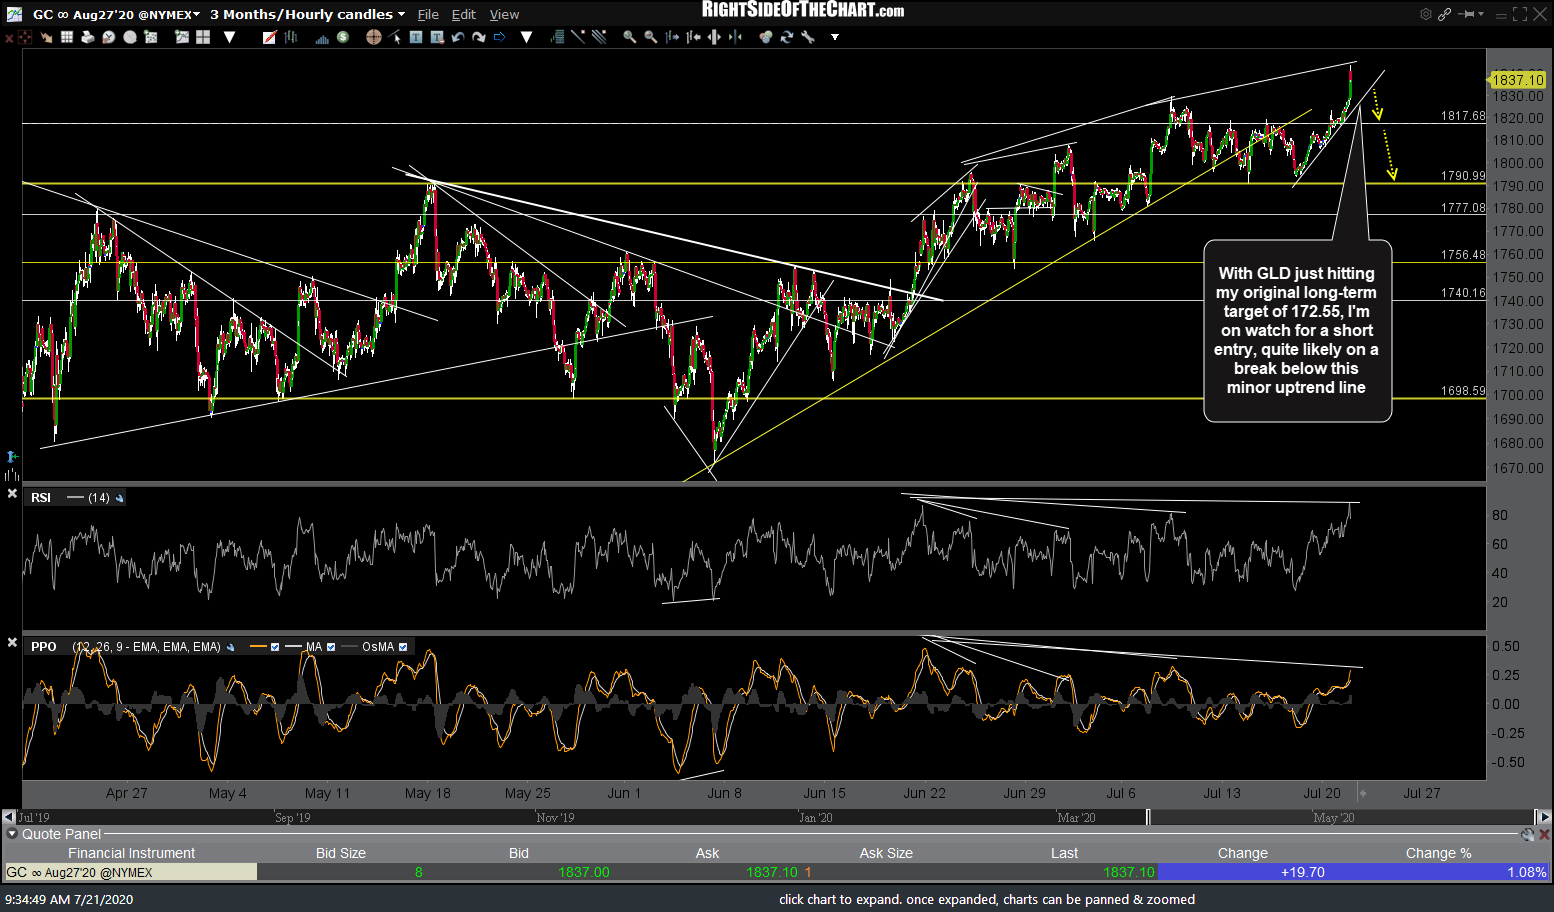
GC 60m July 21st
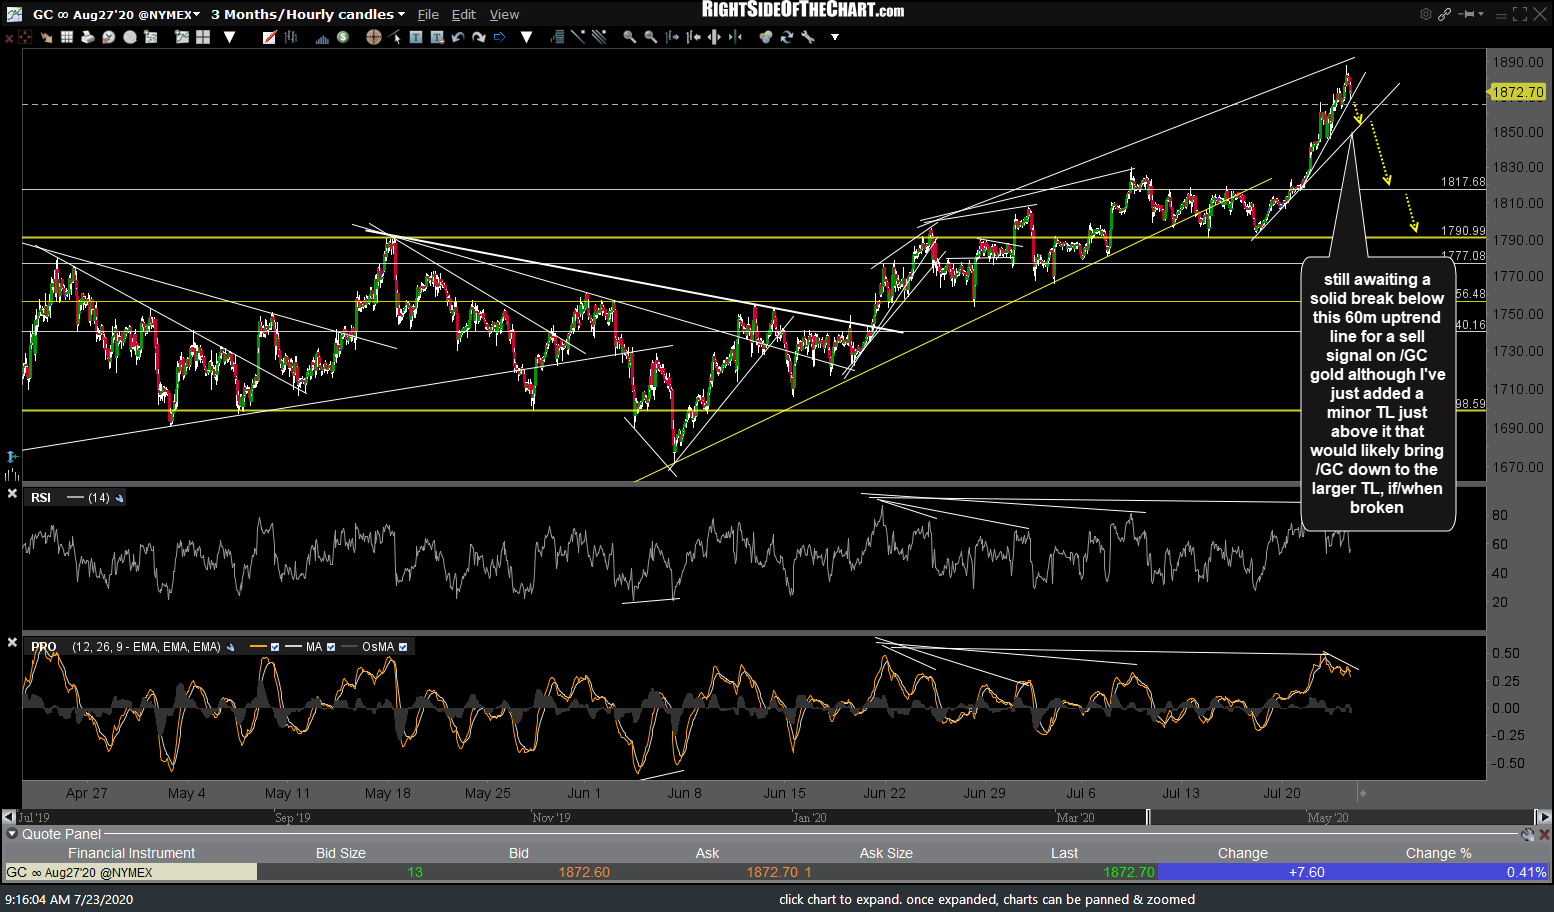
GC 60m July 23rd
Assuming a breakdown from around current levels, /SI (silver) appears poised for a 13%, potentially swift drop back down to at least the 19.835ish level, pending a solid break below this steep 60-minute uptrend line.
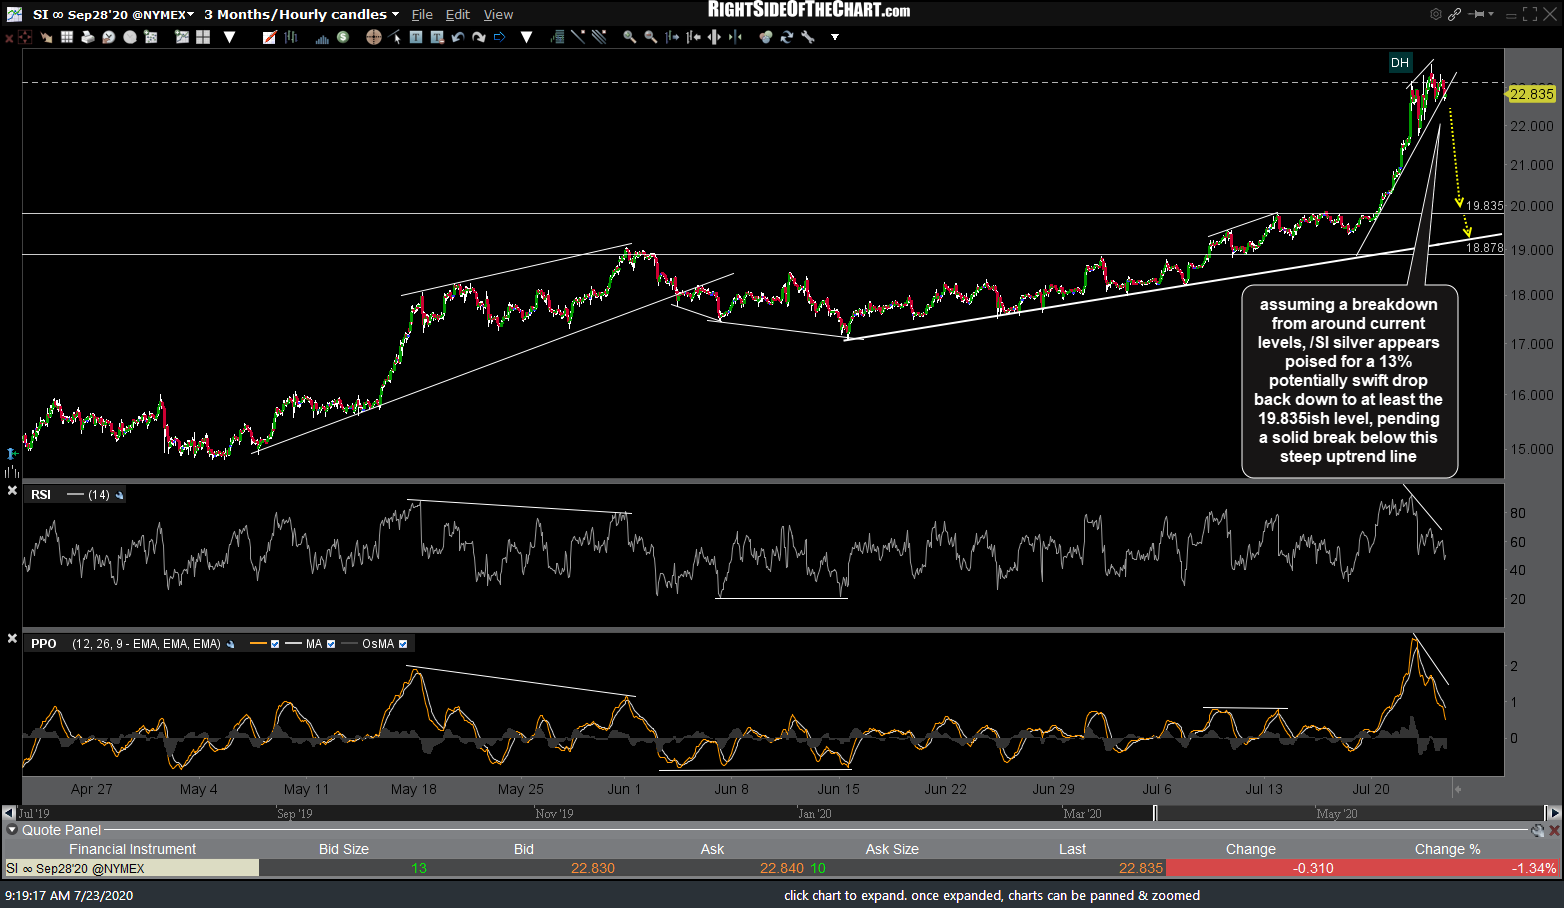
SI 60m July 23rd
I’m still awaiting a solid break and/or 60-minute close above this downtrend line for a buy signal on /NG (natural gas) although the only difference since my previous update on the setup from July 15th (first chart below) is that 1.786 resistance level now becomes the first target.

NG 60m July 15th

NG 60m July 23rd