
For nearly a month, this market has going basically nowhere in a choppy, nearly impossible to trade sideways range. However, large unidirectional moves typically follow such sideways consolidation & the charts continue to point to that next major direction being to the downside.
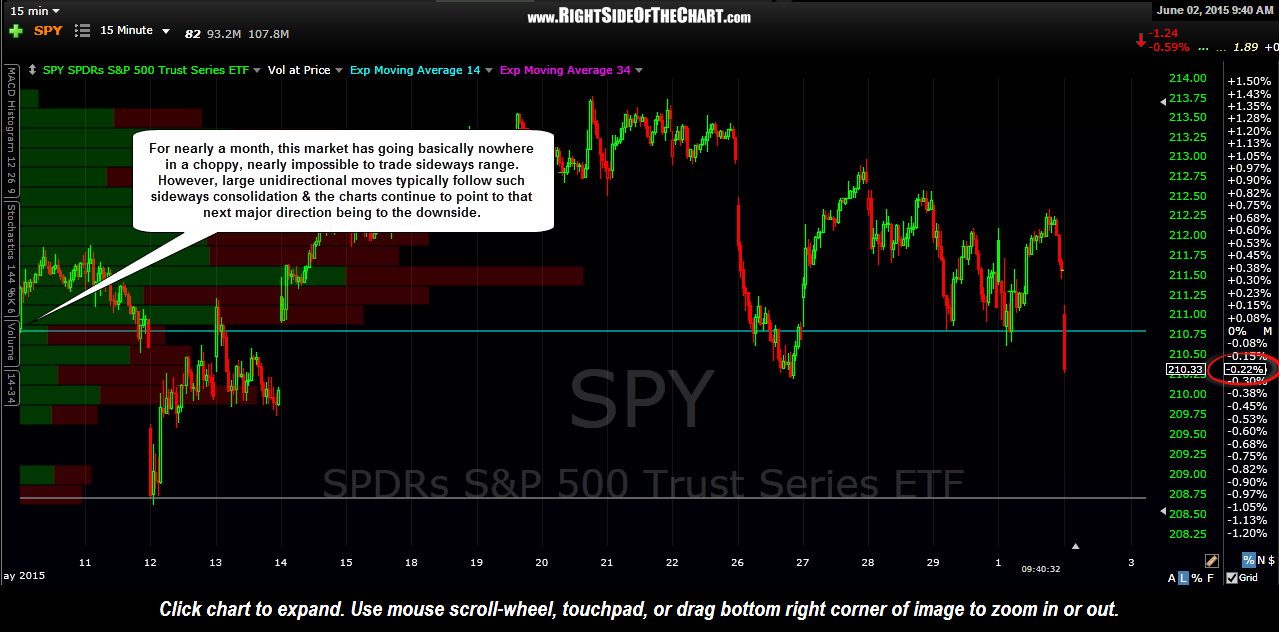
SPY 15 minute June 2nd
Back on April 27th, in this post, I highlighted how plunges in the 5 day ema on volume in the SPY and other broad stock indices (either stand-alone reading or clusters of low volume readings) are typically followed by a correction. At that time, the 5 day ema had fallen to the red “sell signal” line on the volume histogram although volume immediately increased from that point, causing the moving average to be recalculated and we never did get a closing print on or below that sell level.
Fast forward just under a month to May 22nd & volume on the SPY finally did print a close on the 5-day EMA (the most recent red arrow on this daily chart. That low-volume sell signal has so far coincided with the most recent top in the SPY and we also had similar sell signals put in place in the QQQ (also shown below) as well as other US broad equity indices.
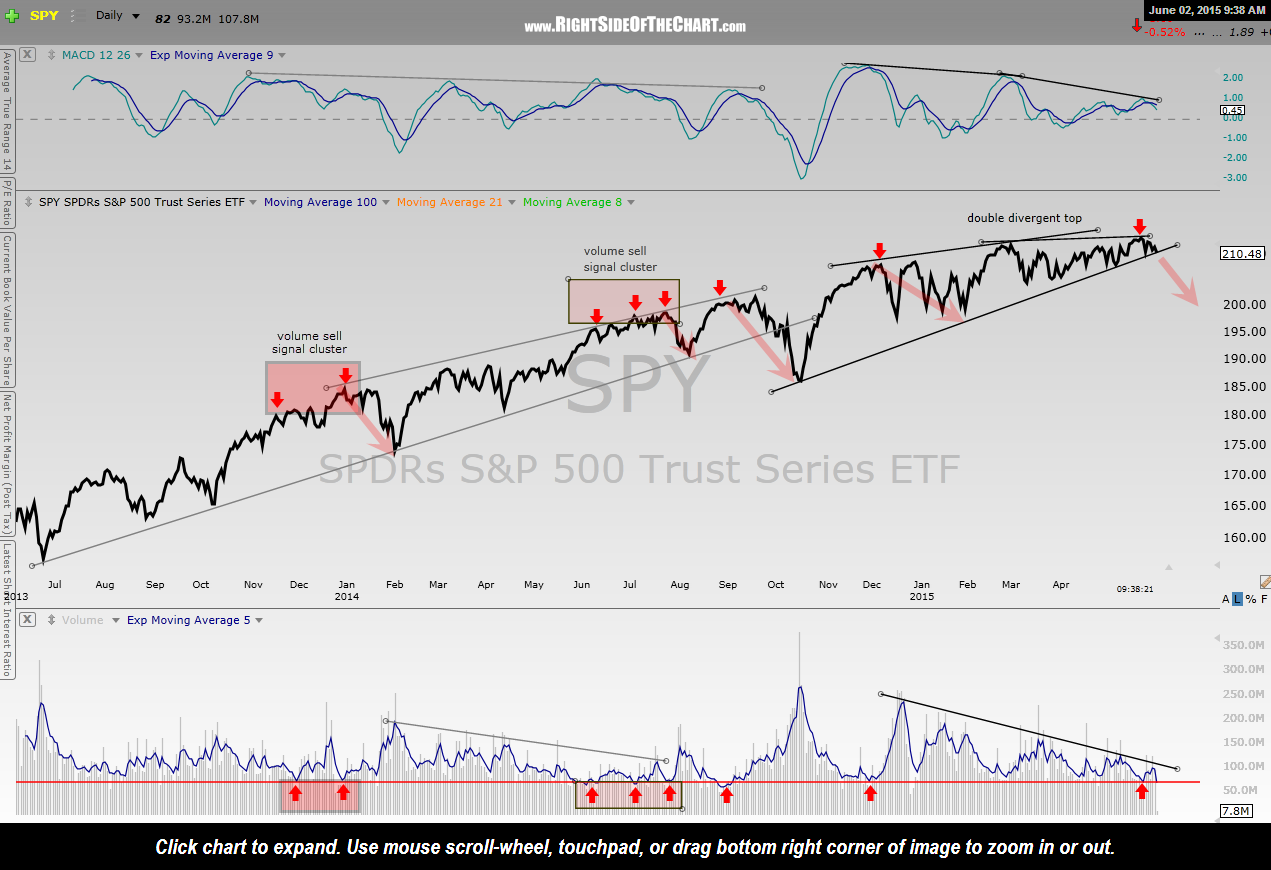
SPY daily June 2nd

QQQ daily June 2nd
Although I continue to believe that the R/R for the broad markets is clearly skewed to the downside, most trend indicators remain bullish as US equities continue to grind sideways. While I continue to monitor all of the major US stock indices, I’m keeping a close eye on this minor (blue) uptrend line in the QQQ/$NDX. A solid break and/or close below that trendline is likely to bring the Q’s to at least the 104 level in relatively short order, which would correlate to a drop of nearly 5% from current levels.

QQQ daily 2 June 2nd