
In this post last week, I had highlighted how plunges in the 5-day exponential moving average on the volume for the SPY to certain levels has been a fairly accurate timing indicator to signal impending corrections. I was asked today to update that chart, which I have done below although for simplicity, I removed the orange line & the corrections that were triggered when it was hit. We now have the 5-day volume ema reaching the red line for the first time since November 28th of last year. Following that previous sell signal, the SPY peaked 5 trading sessions later & fell nearly 5% over the next 7 trading sessions. As noted on this updated chart below, we now have our first tag of the red-line so far this year. Any half-decent correction is likely to cause a break below the bearish rising wedge pattern, triggering a potentially powerful sell signal.
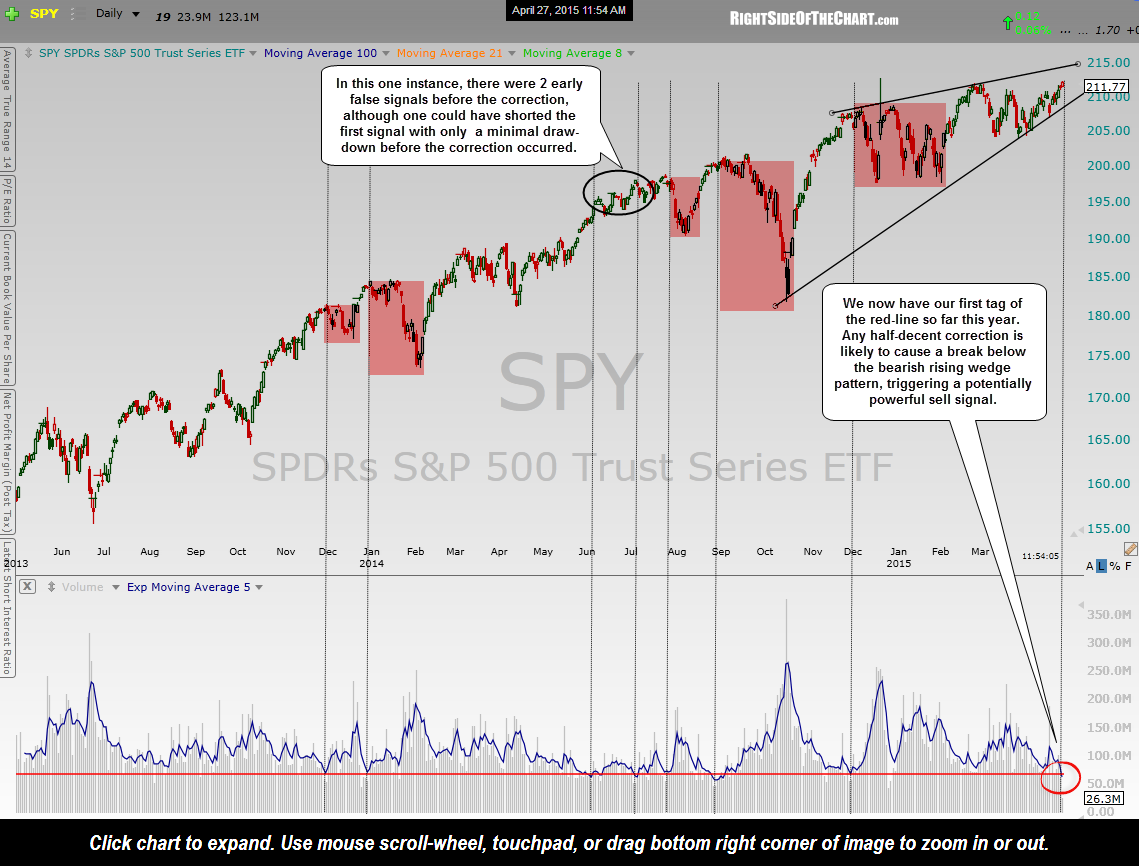
SPY low volume sell signals April 27
In that post last week, I had mentioned that I have noted similar low-volume extreme sell signals on the other broad market tracking ETFs. Most ominous of all is the plunge in volume on the IWM (Russell 2000 Index ETF), with the lowest reading on the 5-day volume EMA in years. This daily chart of the IWM spans 2-years and highlights all 9 tags of the red line, all of which were either immediately or very soon afterwards followed by a correction in that small cap stock index. Also note that as with the SPY & QQQ, any half-decent correction in the IWM is almost certain to cause a solid break below the large bearish rising wedge pattern that has formed since the Oct lows. In fact, since I started working on this post, the IWM has fallen sharply on very impulsive selling and is now at the bottom of the wedge.
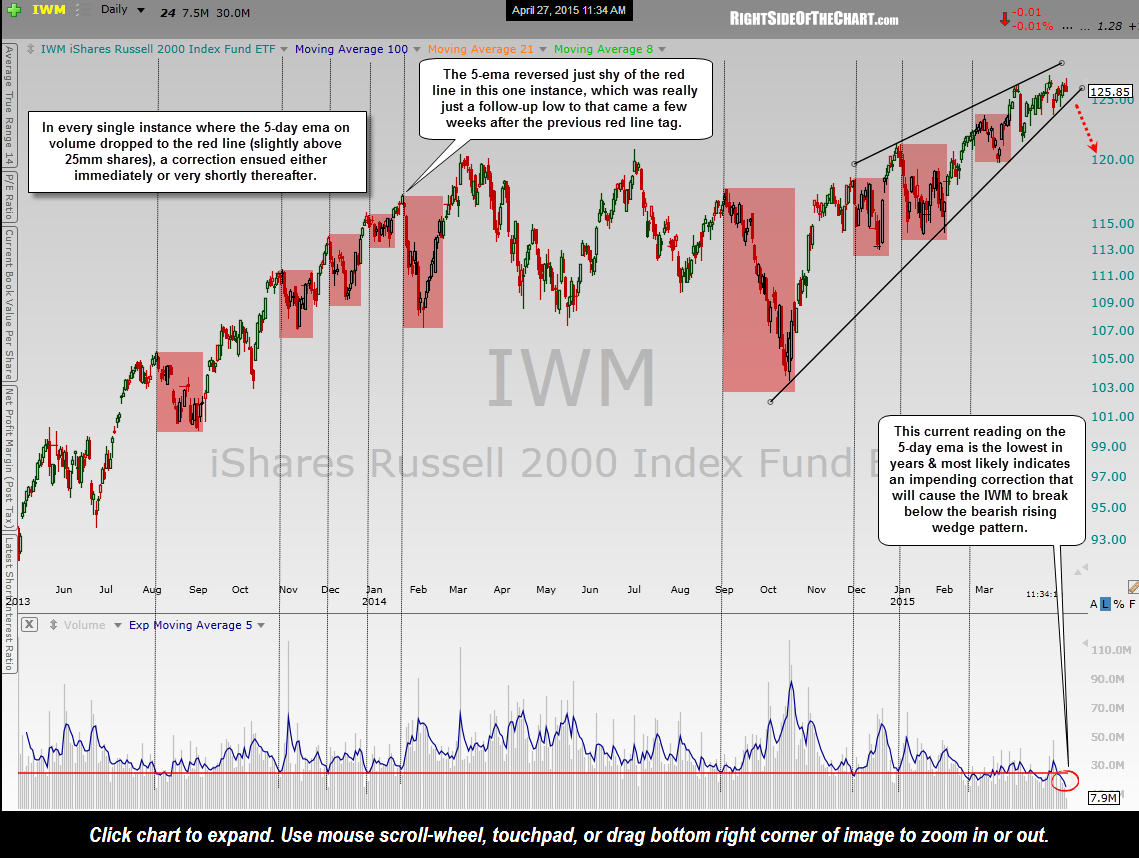
IWM low volume sell signals April 27