
I’m still awaiting (and expecting) an impulsive break & close below the uptrend line on XLK (tech sector ETF) whether it comes soon (yellow arrows) or following a marginal new & still divergent high (blue arrows) as when tech breaks, the stock market breaks.
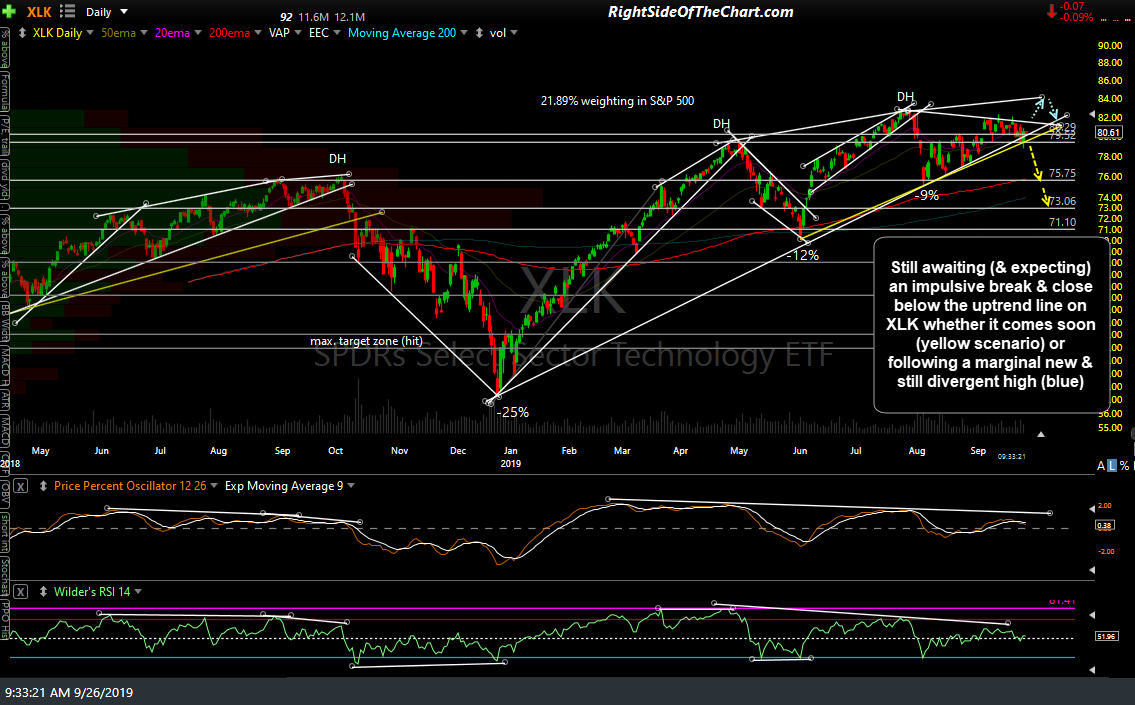
XLK daily Sept 26th
While we need to see a solid daily close below both (nearly overlapping) uptrend lines on that daily chart, we might be able to be able some early clues for a potential sell signal on tech & the market from this 60-minute chart. XLK is currently backtesting the 60-min uptrend line while also at the minor (yellow) downtrend line. On watch for a rejection here followed by a break below the 80 support level with the next support around 79.

XLK 60m Sept 26th