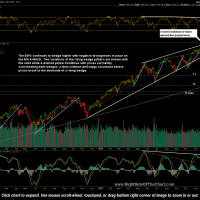
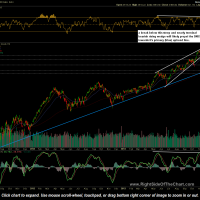
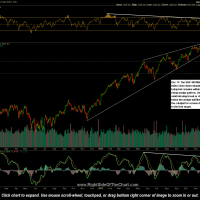
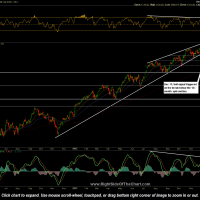
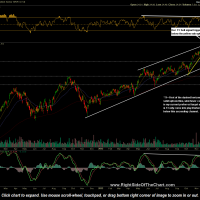
Today’s sell-off in US equities resulted in some solid technical breakdowns in some of the more volatile indices and sectors, such as the $RUT (Small Caps) and XLK (Technology) while the broadly diversified large cap indexes, such as the S&P 500 and Nasdaq 100 are still perched comfortably above their respective primary uptrend lines, albeit looking increasing vulnerable to a significant correction at this time. The S&P 400 Mid Cap Index, which falls between the more volatile, lower quality small caps and the more (relatively) stable large caps are very close to, but have not yet broken below its primary uptrend line/bearish rising wedge pattern. This pattern of the recent under performance of lower quality small cap stocks following the pronounced outperformance by small caps in the 2nd & 3rd quarter of this year is typical of the market action often observed in the final stages of an advance. (Discussed in detail in this post a couple of months ag0).
- S&P 500 (SPX) daily chart
- Nasdaq 100 (NDX) daily chart
- S&P 400 Mid Cap Index ($MID)
- Russell 2000 (RUT) daily chart
- SPDRs Technology ETF (XLK)
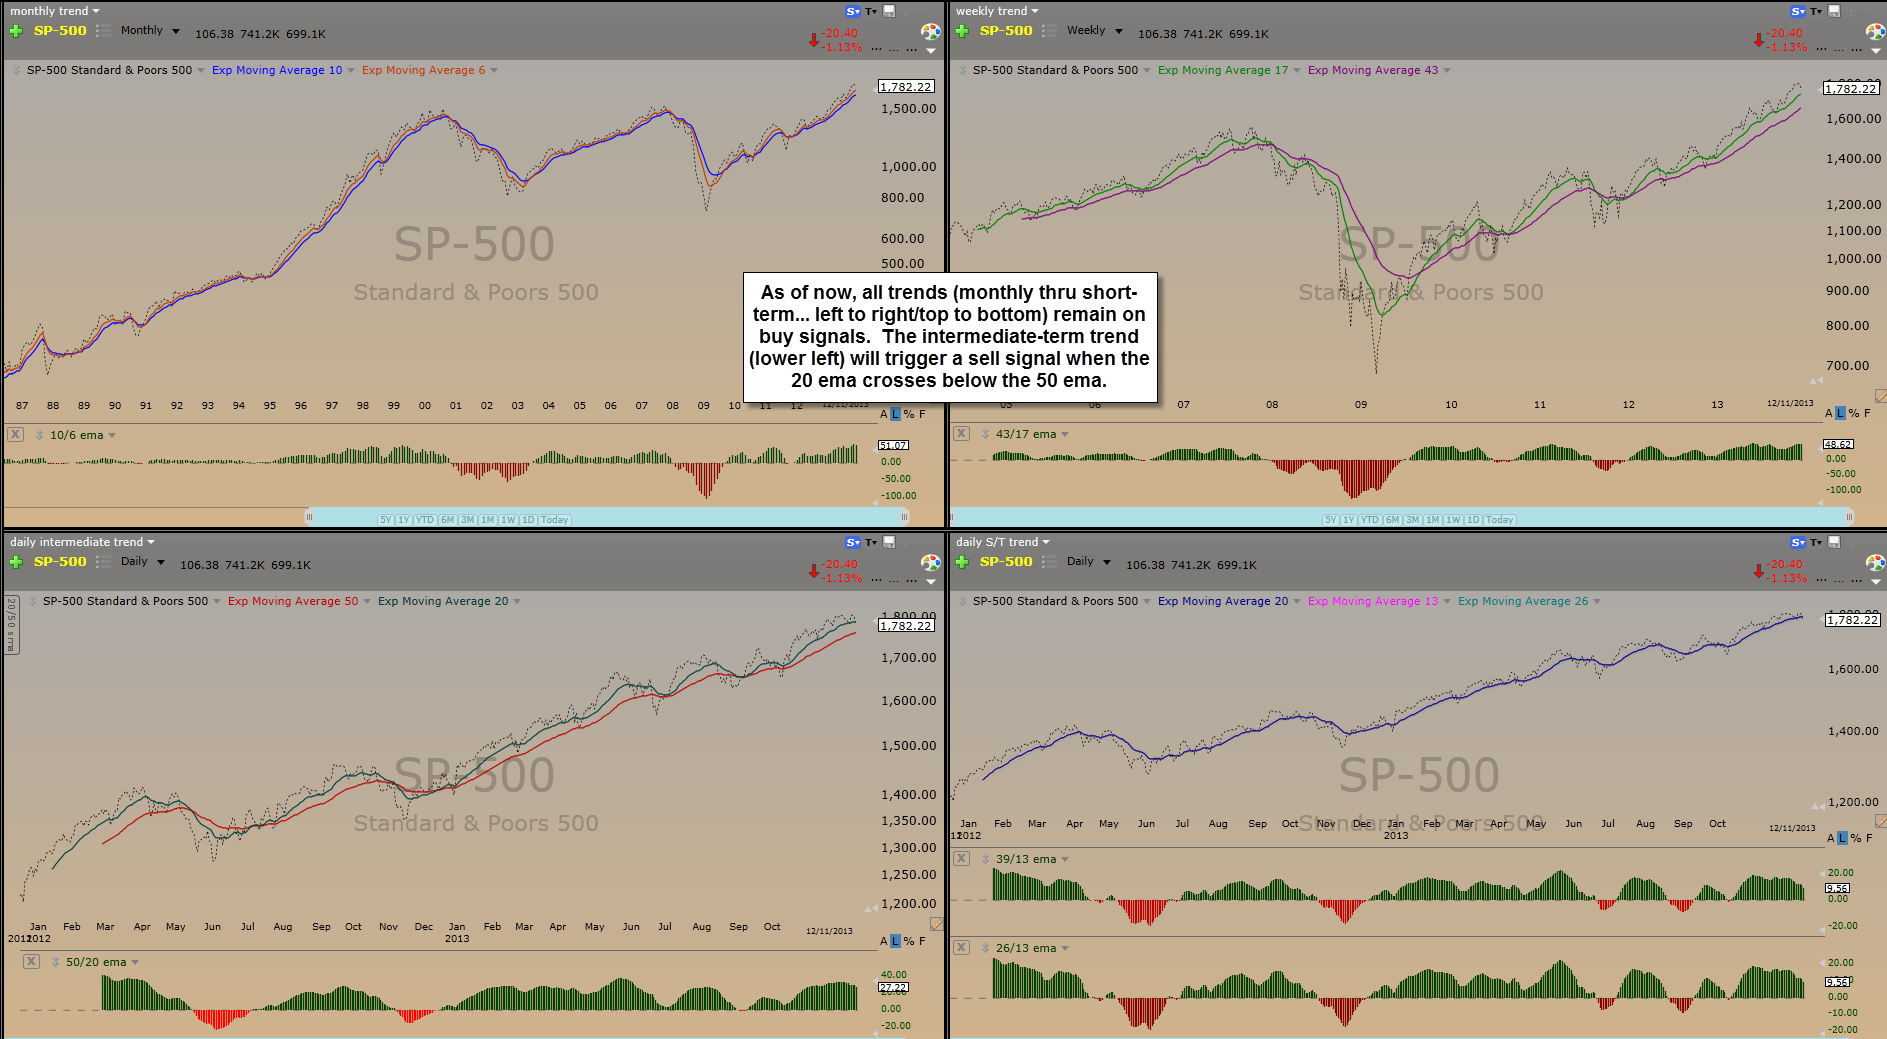
2013 has been a year plagued with false sell signals and bear traps and with all but the shortest-term trend indicators remaining on buy signal for now, today’s breakdown in the small caps and tech sector may very well prove to be just another false alarm. However, a preponderance of bearish developments such as extreme sentiment readings, record high margin interest, multi-year low short interest, multi-month bearish divergences and wedge patterns on just about every major index continues to build and will almost certainly manifest in the form of lower stock prices in the coming months. The chart below is a screenshot of four trend indicators for the S&P 500. My guess is that by the time the S&P 500 & Nasdaq 100 finally do fall below the primary uptrend lines shown on the charts above (and that can & most likely will happen much faster than most expect, as prices tend to fall much faster than they rise), that the short-term indicators will all be on solid sell signals with the intermediate-term trend very close to moving to a sell signal as well.
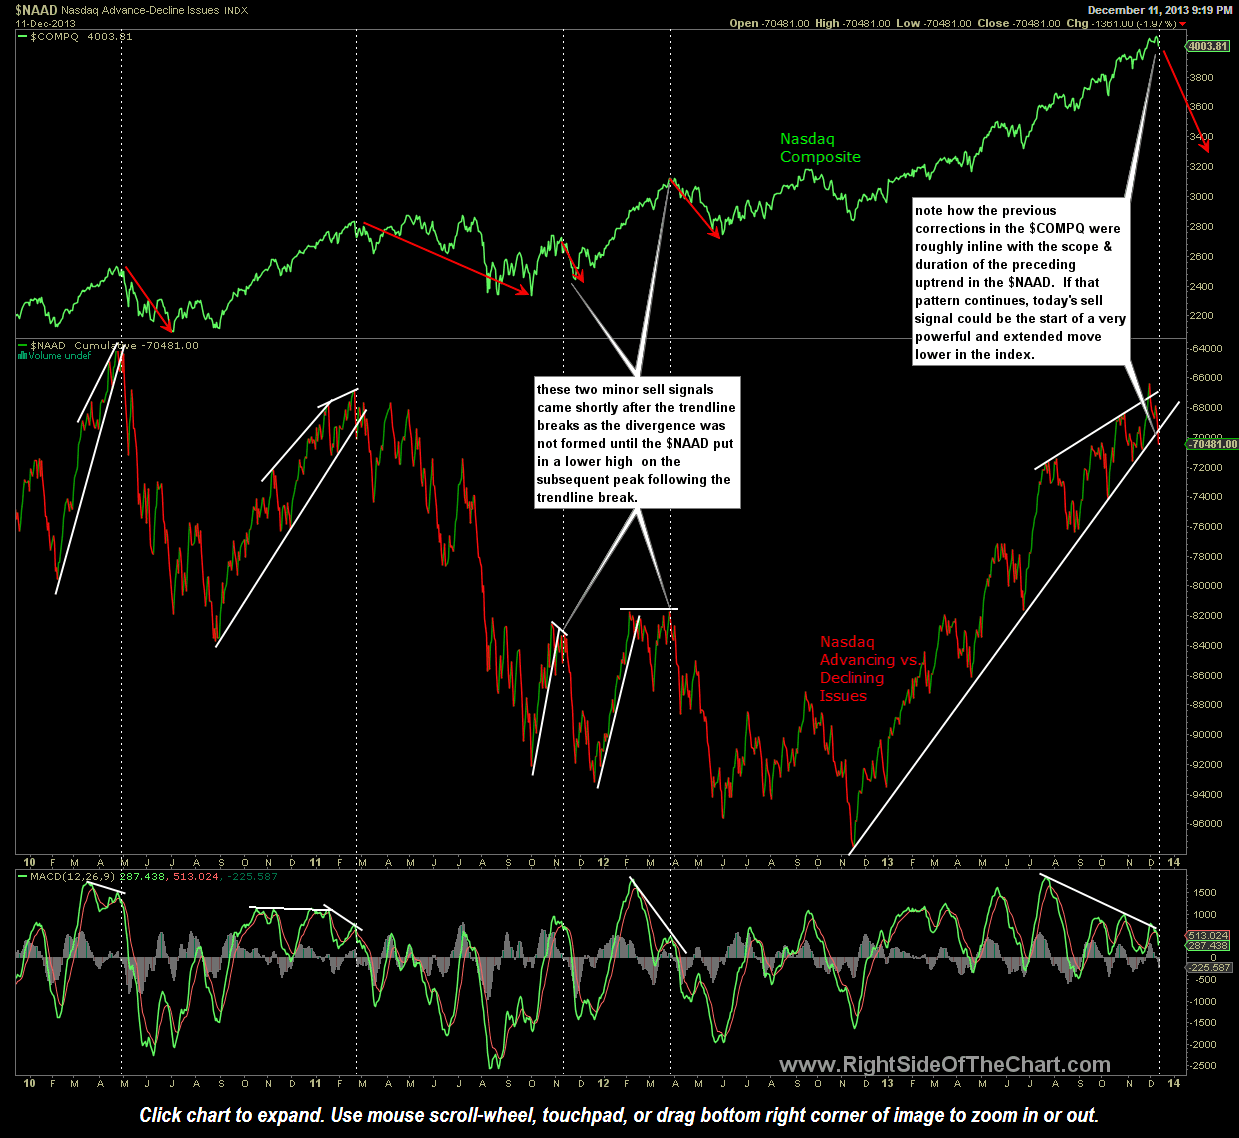
One final chart worth mentioning is the $NAAD (Nasdaq Advance-Decline Index), which finally triggered a sell signal today on a break below this very long uptrend line and large rising wedge pattern. As the chart illustrates, a sell signal is given following a break below the $NAAD uptrend line once negative divergence has been put in place (the MACD making a lower high while the $NAAD makes a higher high). Nothing is 100% and I believe that I’ve posted one false sell signal using the $NAAD earlier this year but that was in the early stages of a trendline break on a questionable trendline draw (very few touches), nor was I using the negative divergence as confirmation to the signal. Maybe this sell signal pans out, maybe not but this is an extremely well defined and long standing uptrend line with solid divergences in place. One possibility would be for the $NAAD to make one more thrust higher to backtest the wedge from below before a solid trend reversal in the $COMP takes hold. However, this is only the 5th confirmed sell signal in at least the last 4 years and the previous four signals were all followed by corrections that were roughly commensurate in scope and duration to the preceding advance in the $NAAD so both bulls and bears alike may want to keep an eye on this indicator.


