
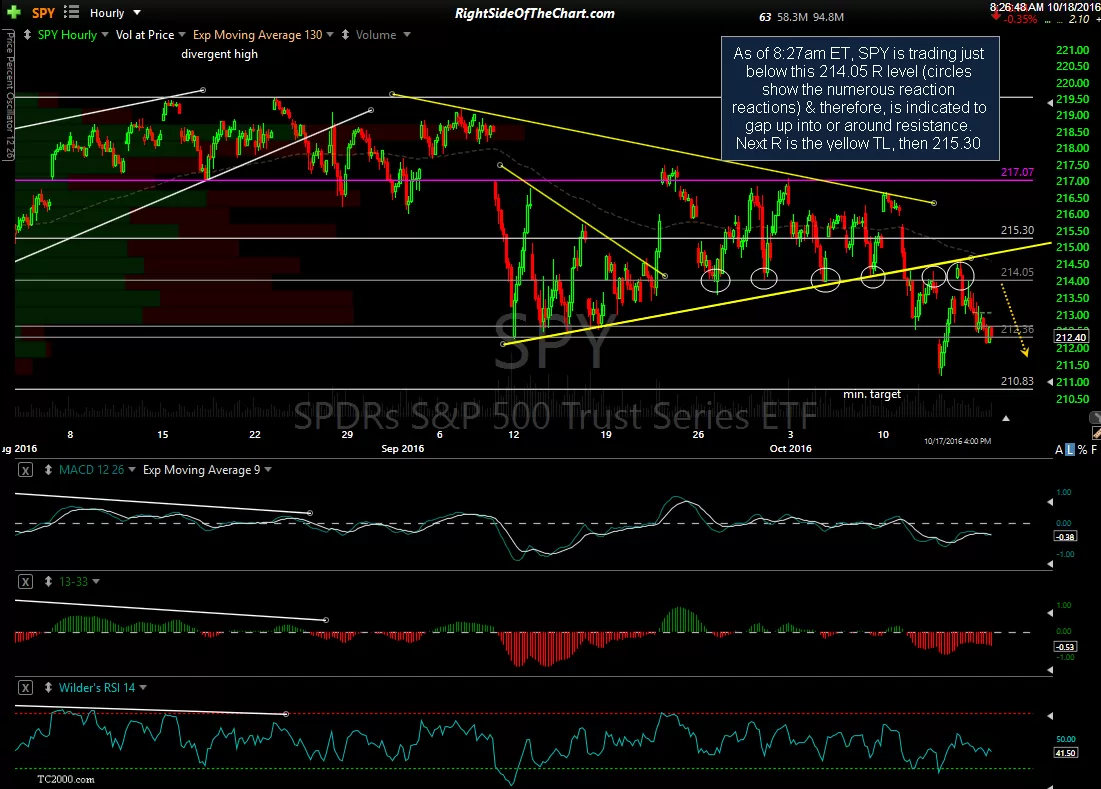
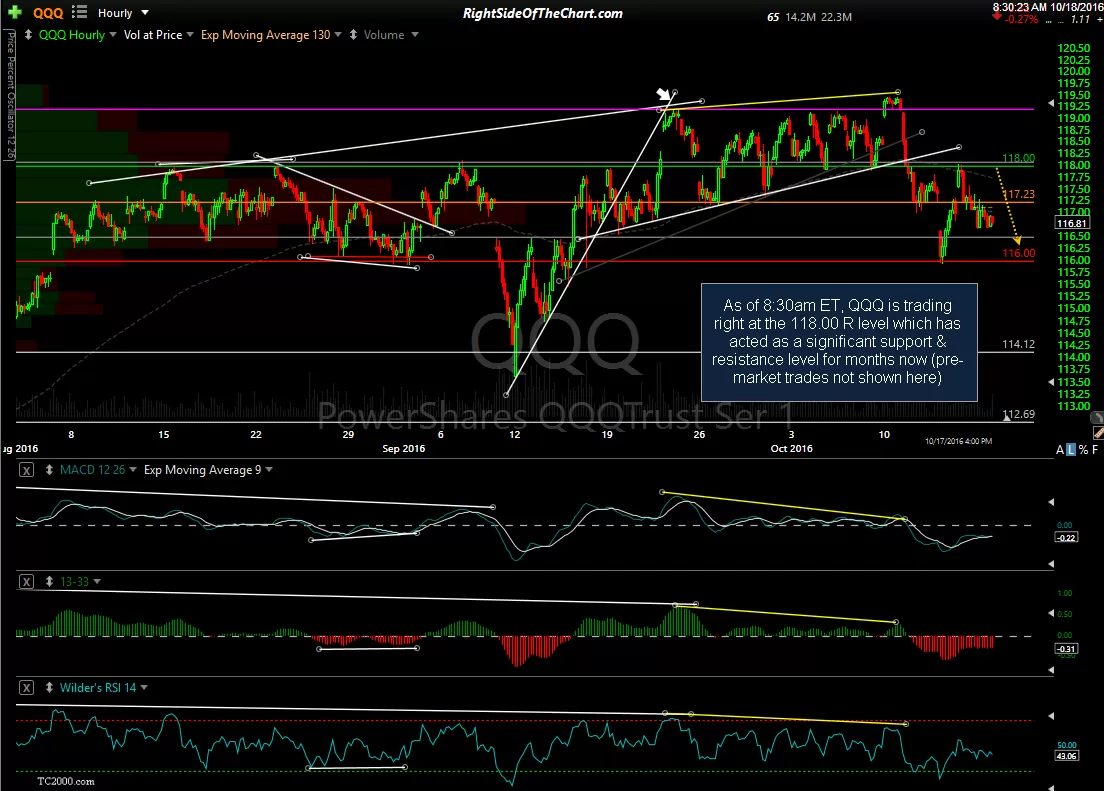
As of 8:27am ET, SPY is trading just below this 214.05 R level (circles show the numerous reaction reactions) & therefore, is indicated to gap up into or around resistance. Next R is the yellow TL, then 215.30. QQQ is trading right at the 118.00 R level which has acted as a significant support & resistance level for months now (pre-market trades not shown on these 60-minute charts).
-
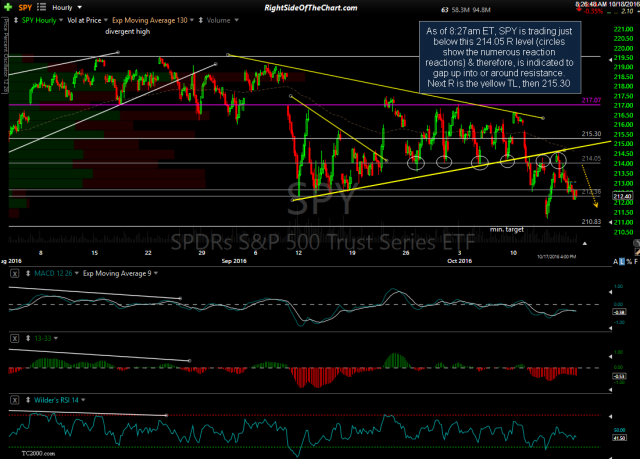
- SPY 60-min Oct 17th close
-
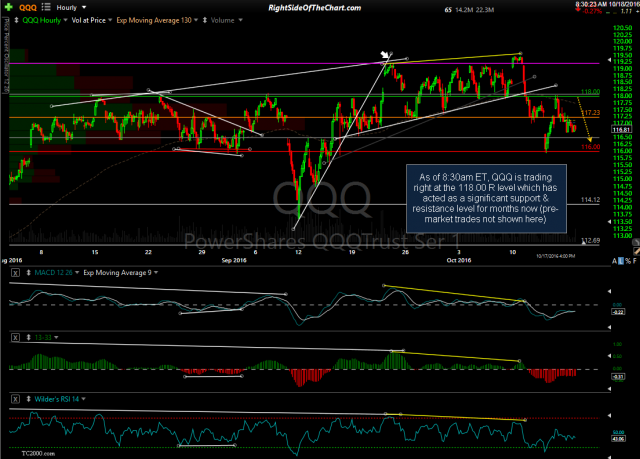
- QQQ 60-min Oct 17th close
Bottom line: The US equity markets still remain well within the sideways trading ranges which have contained prices for over 3 months now while a downside resolution of these ranges still appears the most likely scenario, we need to see those ‘flashpoint’ support levels taken out (or a convincing break above the pattern) before the next clear bullish or bear trend gets underway.