
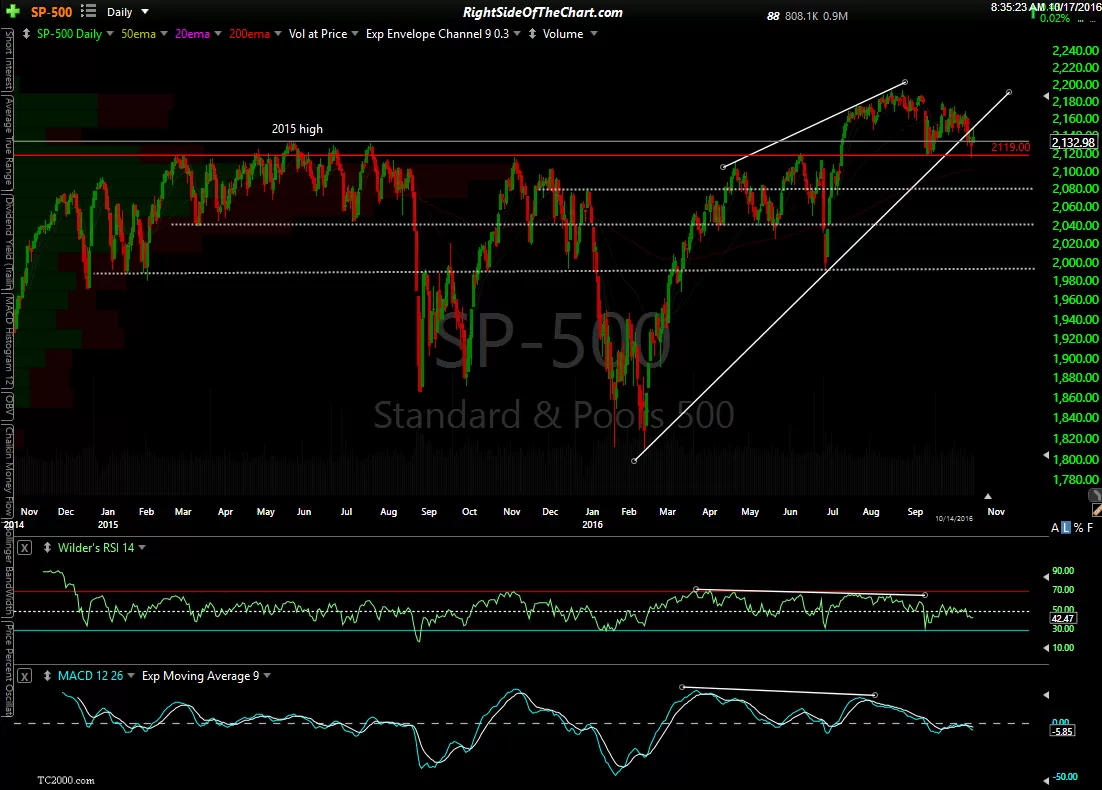
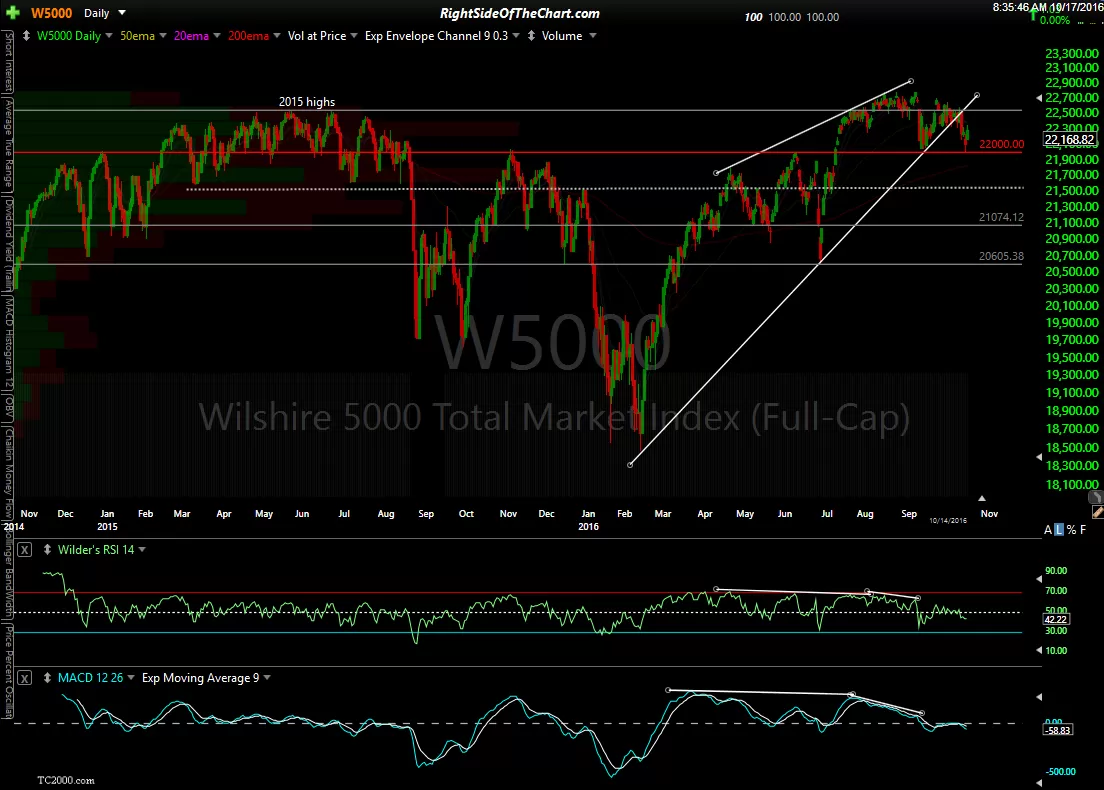
Here’s a quick snapshot of some of the major US stock indices covered in last night’s video. The key support levels that were referred to as potential “flashpoints”, key support levels which are likely to spark an impulsive wave of selling if taken out, are highlighted in red. The white horizontal lines below are key support/targets levels for each index.
-

- $SPX daily Oct 17th
-
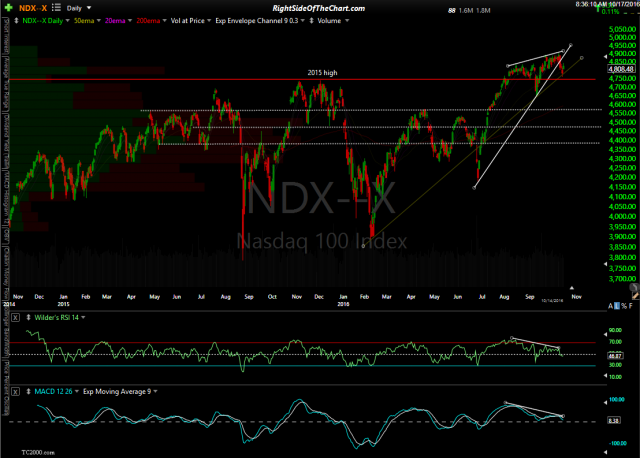
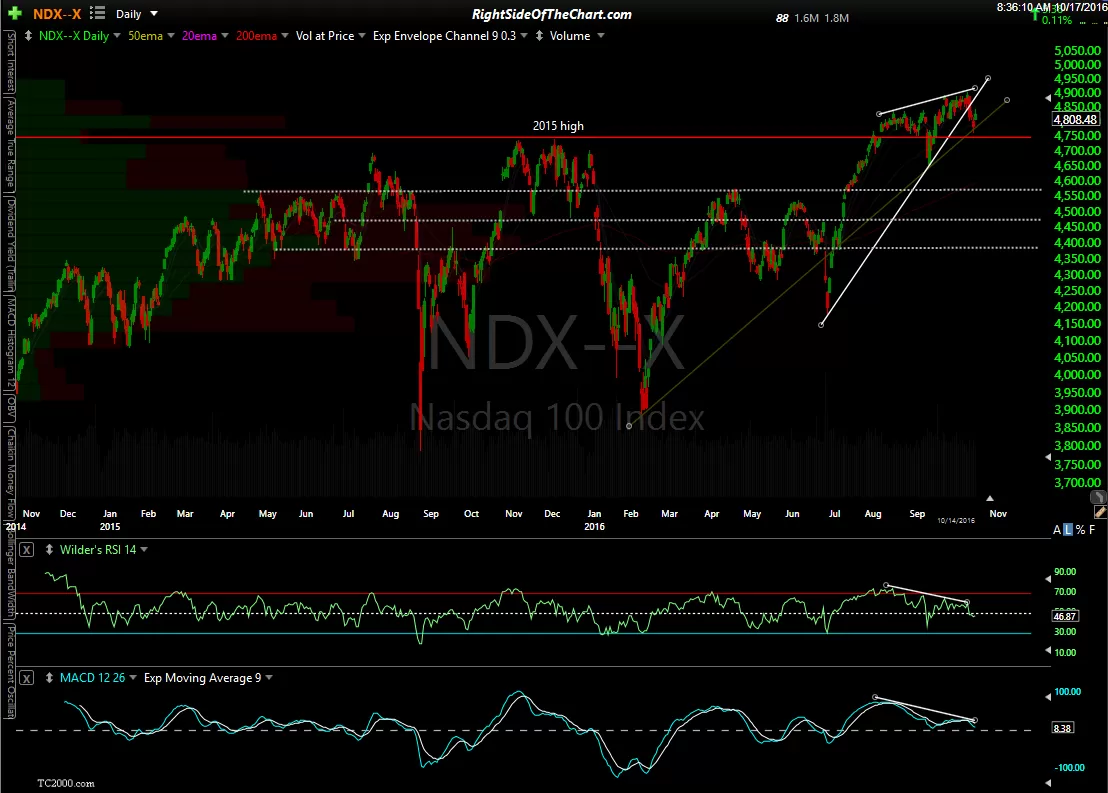
- $NDX daily Oct 17th
-

- $WLSH daily Oct 17th
-
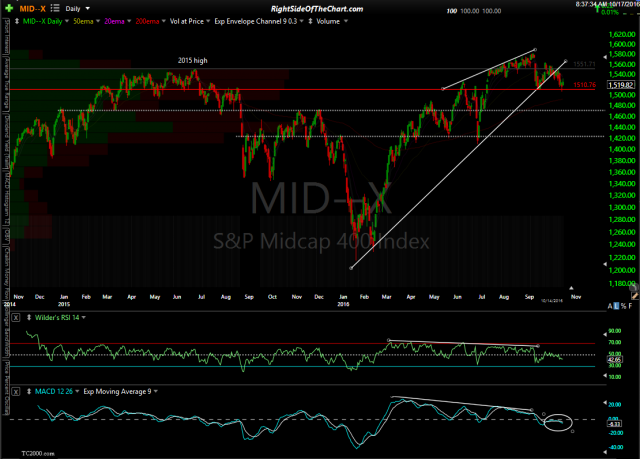
- $MID daily Oct 17th

(click on the first chart to expand, then click the arrow to the right of each expanded chart to advance to the next full size chart image)