
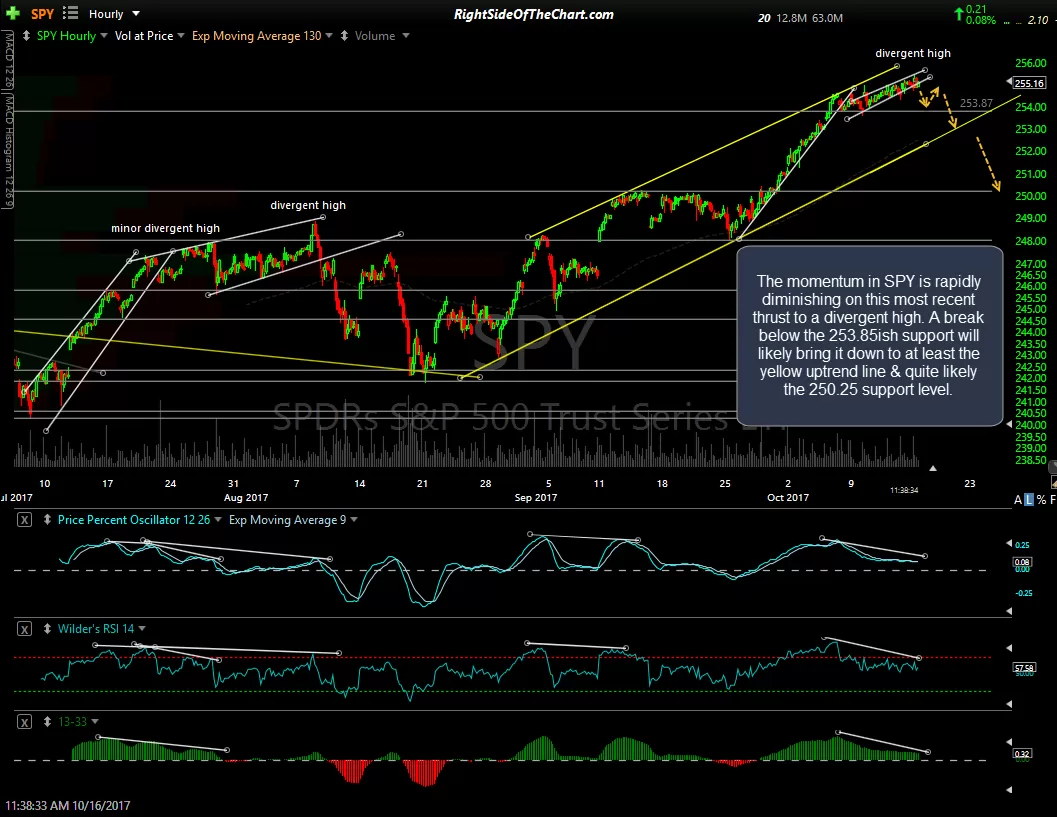
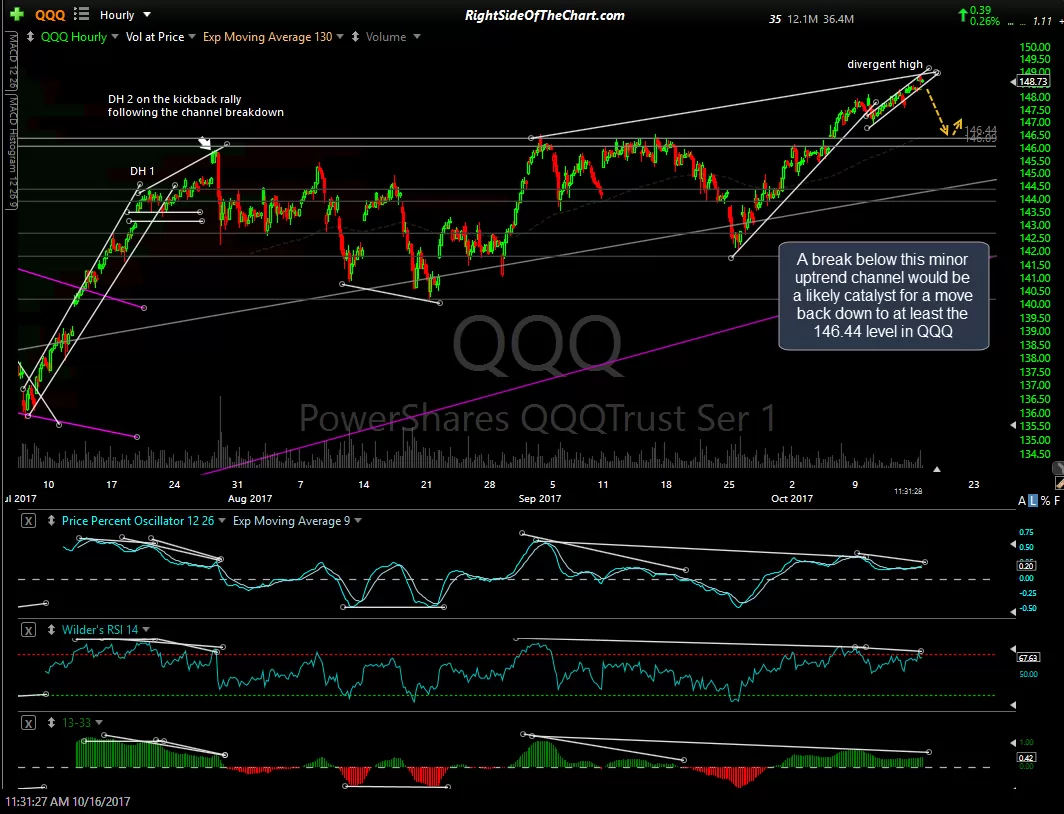
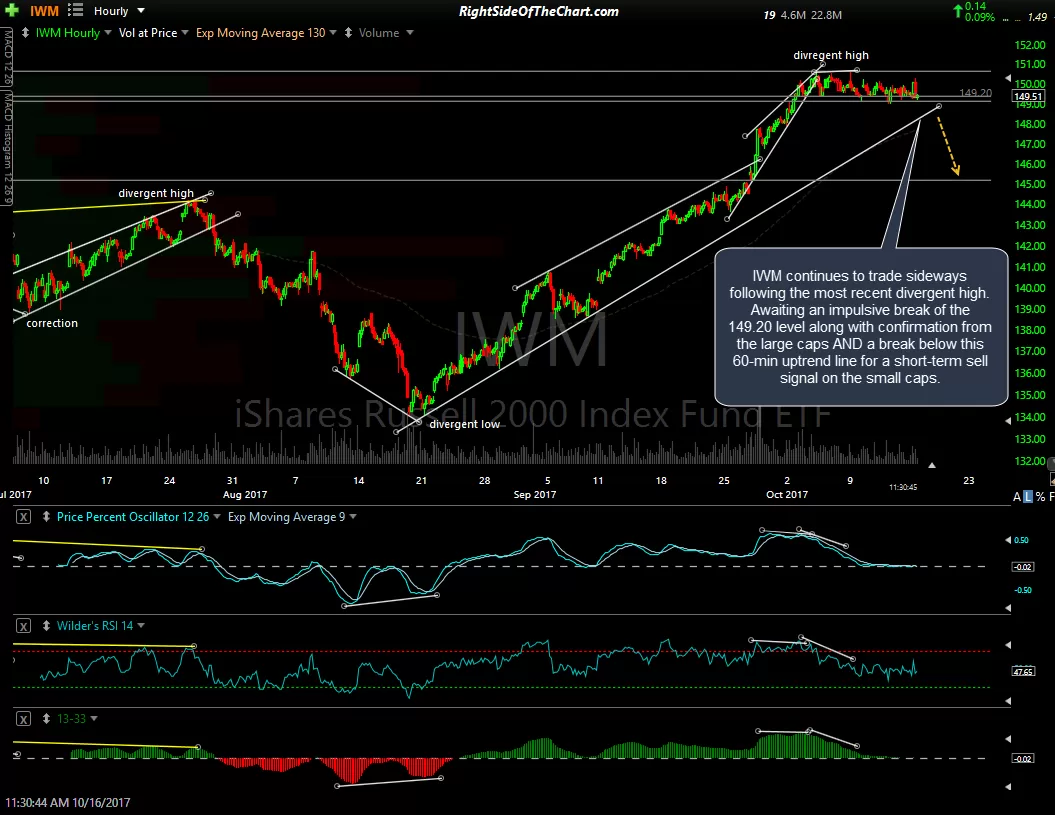
A quick look at some of the key technical levels & developments that I’m monitoring on within the U.S. equity markets. Starting with the 60-minute charts of the broad index tracking ETFs: The momentum in SPY is rapidly diminishing on this most recent thrust to a divergent high. A break below the 253.85ish support will likely bring it down to at least the yellow uptrend line & quite likely the 250.25 support level; A break below this minor uptrend channel would be a likely catalyst for a move back down to at least the 146.44 level in QQQ; IWM continues to trade sideways following the most recent divergent high. Awaiting an impulsive break of the 149.20 level along with confirmation from the large caps AND a break below this 60-min uptrend line for a short-term sell signal on the small caps.
-
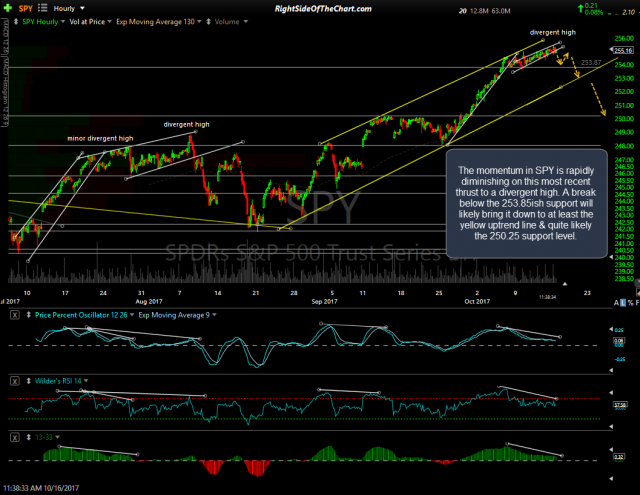
- SPY 60-min Oct 16th
-

- QQQ 60-min Oct 16th
-
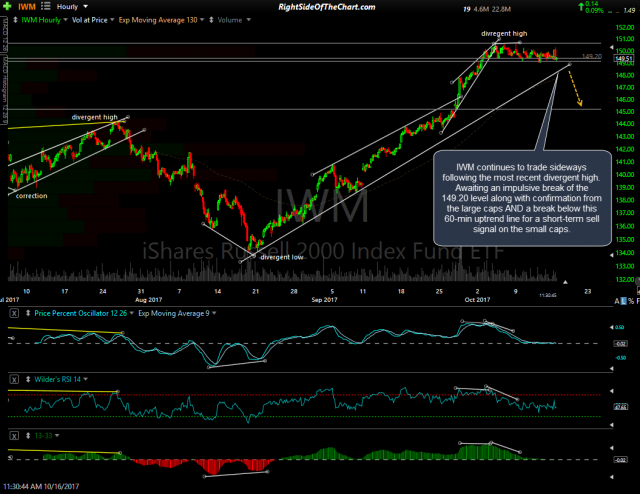
- IWM 60-min Oct 16th
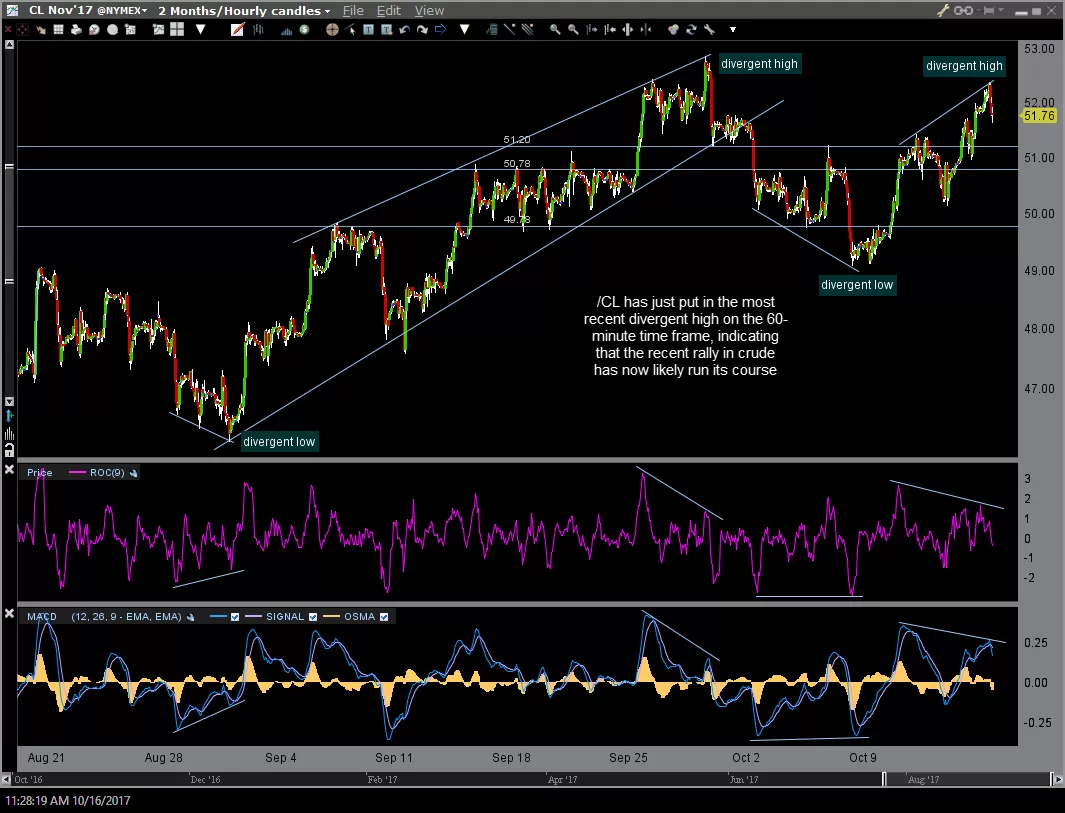
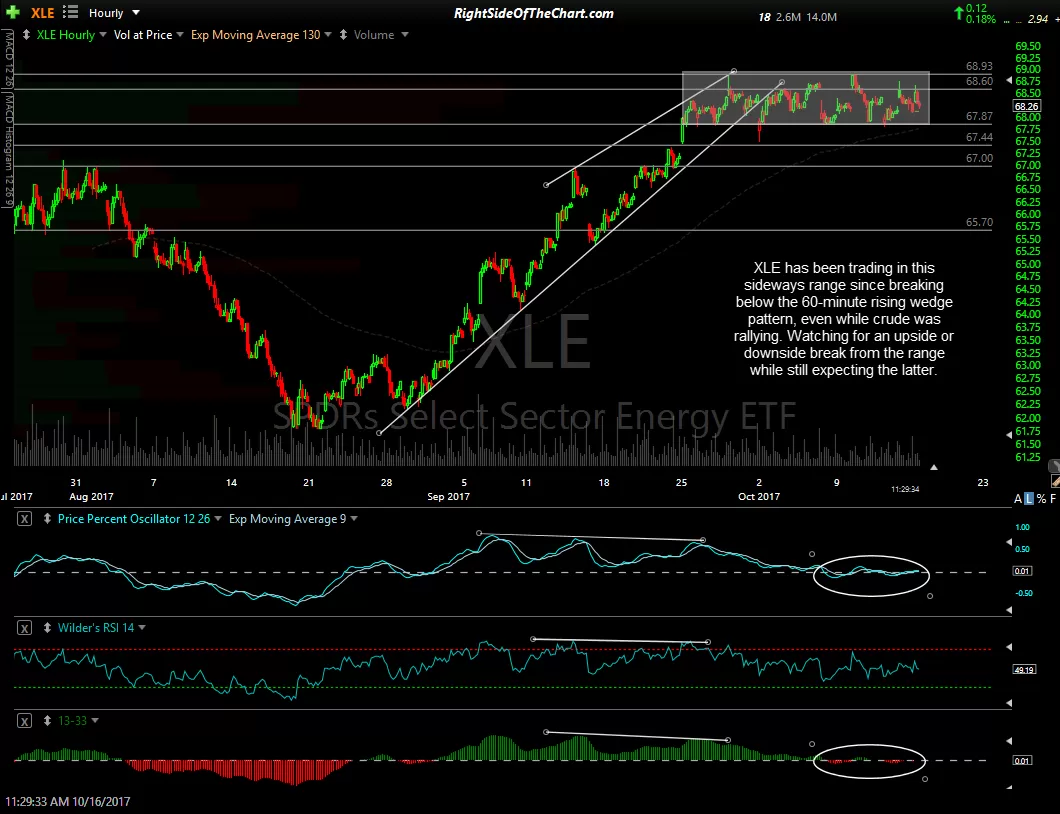
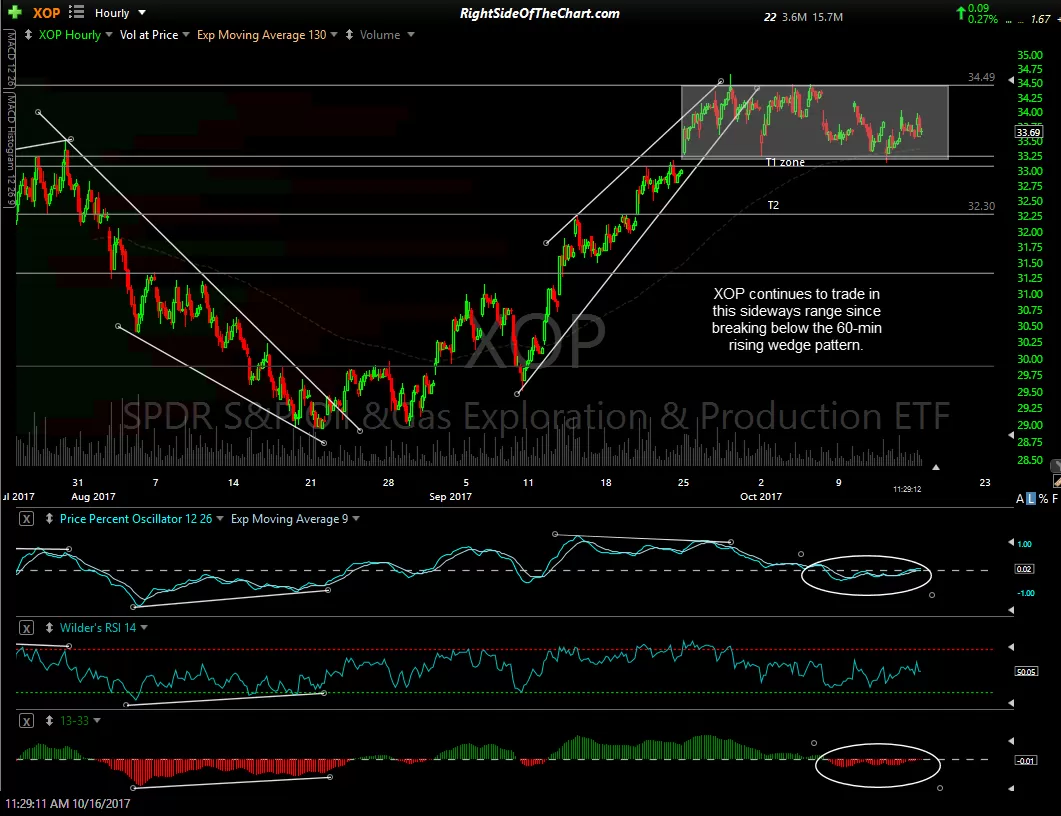
Looking at the energy sector, /CL (crude futures) have just put in the most recent divergent high on the 60-minute time frame, indicating that the recent rally in crude has now likely run its course while both XLE & XOP have been trading in these sideways ranges since breaking below their respective 60-minute rising wedge patterns, even while crude was rallying. Watching for an upside or downside break from the range while still expecting the latter.
-

- $CL 60-min Oct 16th
-

- XLE 60-min Oct 16th
-

- XOP 60-min Oct 16th
XLP (Consumer Staples ETF) still stands out to me as one of the more attractive sectors within the S&P 500 at this time. XLP along with the individual stocks within that stand out as compelling trading opportunities at this time have been covered in several videos in recent weeks. XLP still appears to offer one of the better R/R profiles on the long side at this time following the recent divergent low & bounce off support as do many (but certainly not all) of the individual components.
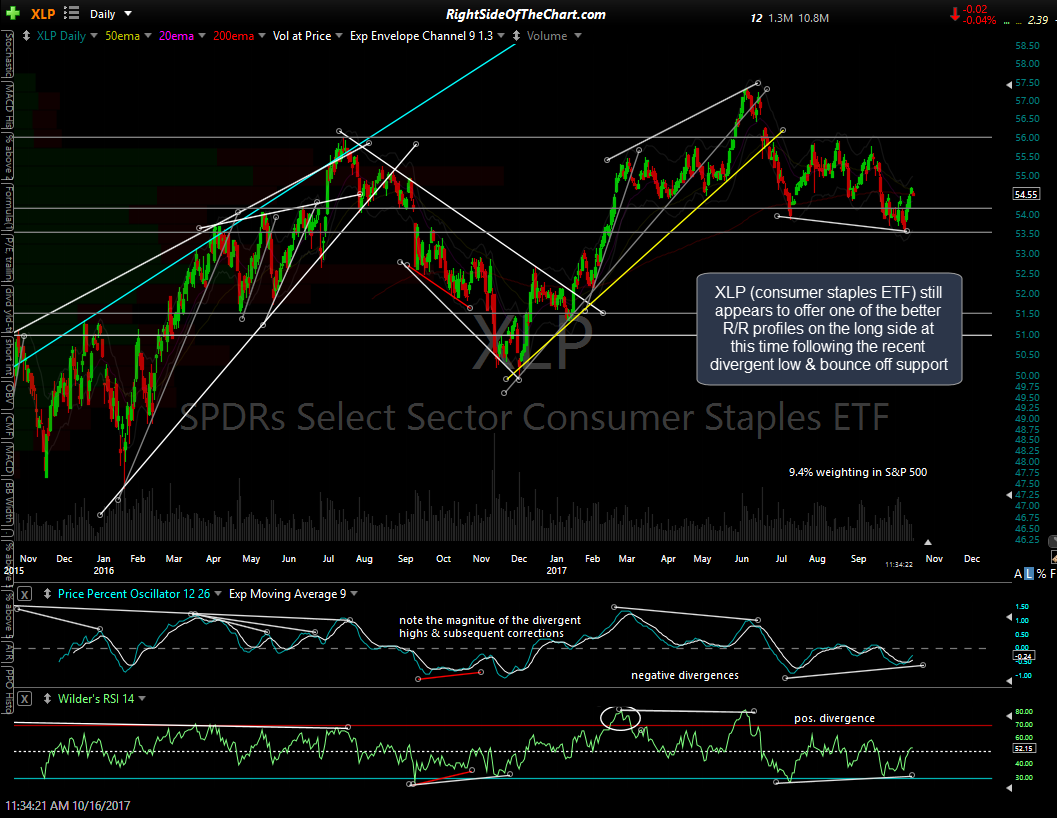
XLP daily Oct 16th
In the Biotechs (XBI), so far today we had an impulsive breakout above this minor downtrend line followed by an equally impulsive fade of that early session rally which caused the breakout to fail. Watching to see how XBI acts on this backtest of the minor TL as well as the backtest of the zero lines on the PPO 9-ema & 13/33-ema trend indicators, which recently flipped from bullish to bearish following the divergent high. 60-min chart:
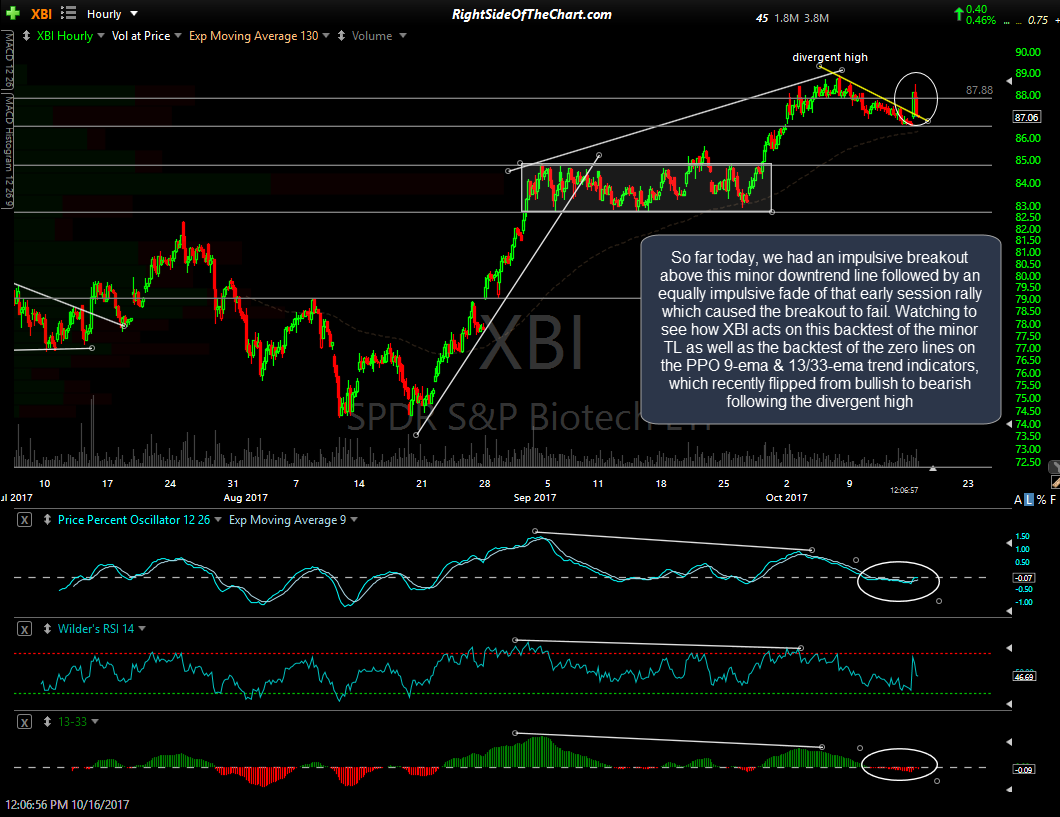
XBI 60-min Oct 16th