
/ES (S&P 500 futures) rolling over following the recent divergent high & backtest of the primary trendline & “should” start to build downside momentum if/when this minor support level is taken out. 60-minute chart below.
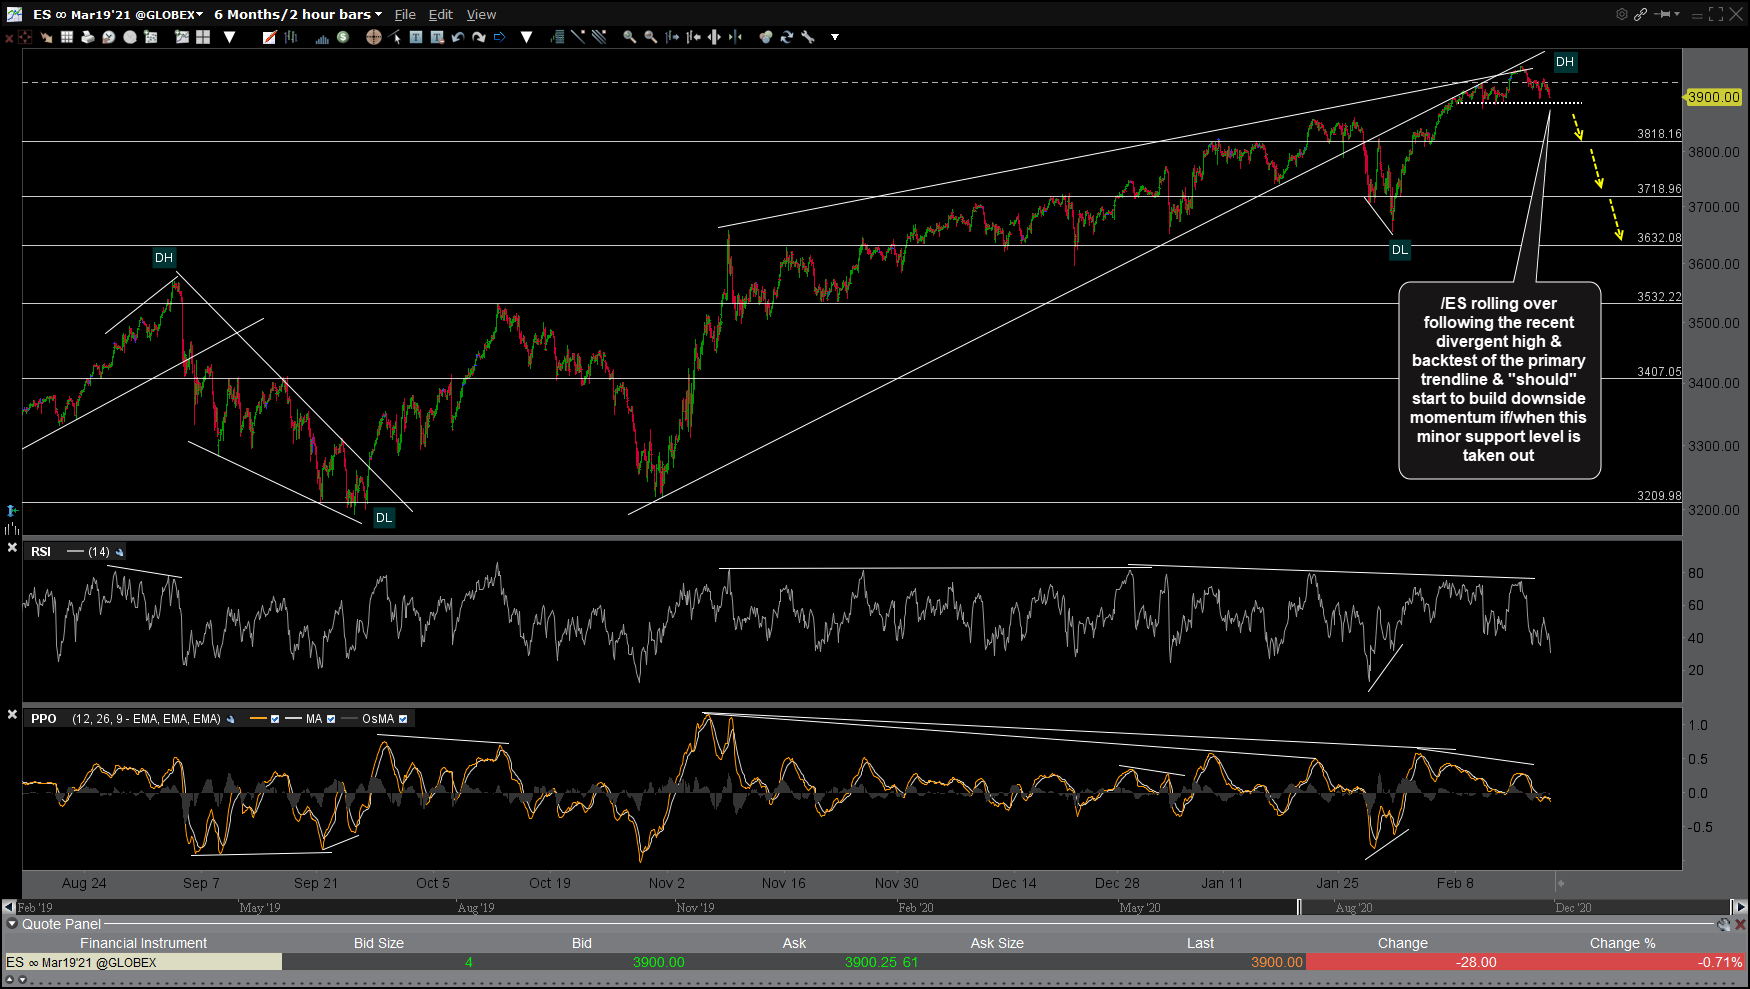
ES 60m Feb 18th
/NQ (Nasdaq 100 futures) is testing the first target again in the pre-market/Globex session following yesterday’s tag & minor bounce off it. Next sell signal still pending a solid break below. 60-minute chart:

NQ 60m Feb 18th
QQQ sell signal still to come on a solid break and/or close below the primary uptrend line off the March lows or pretty much any downside from here. Daily chart below.
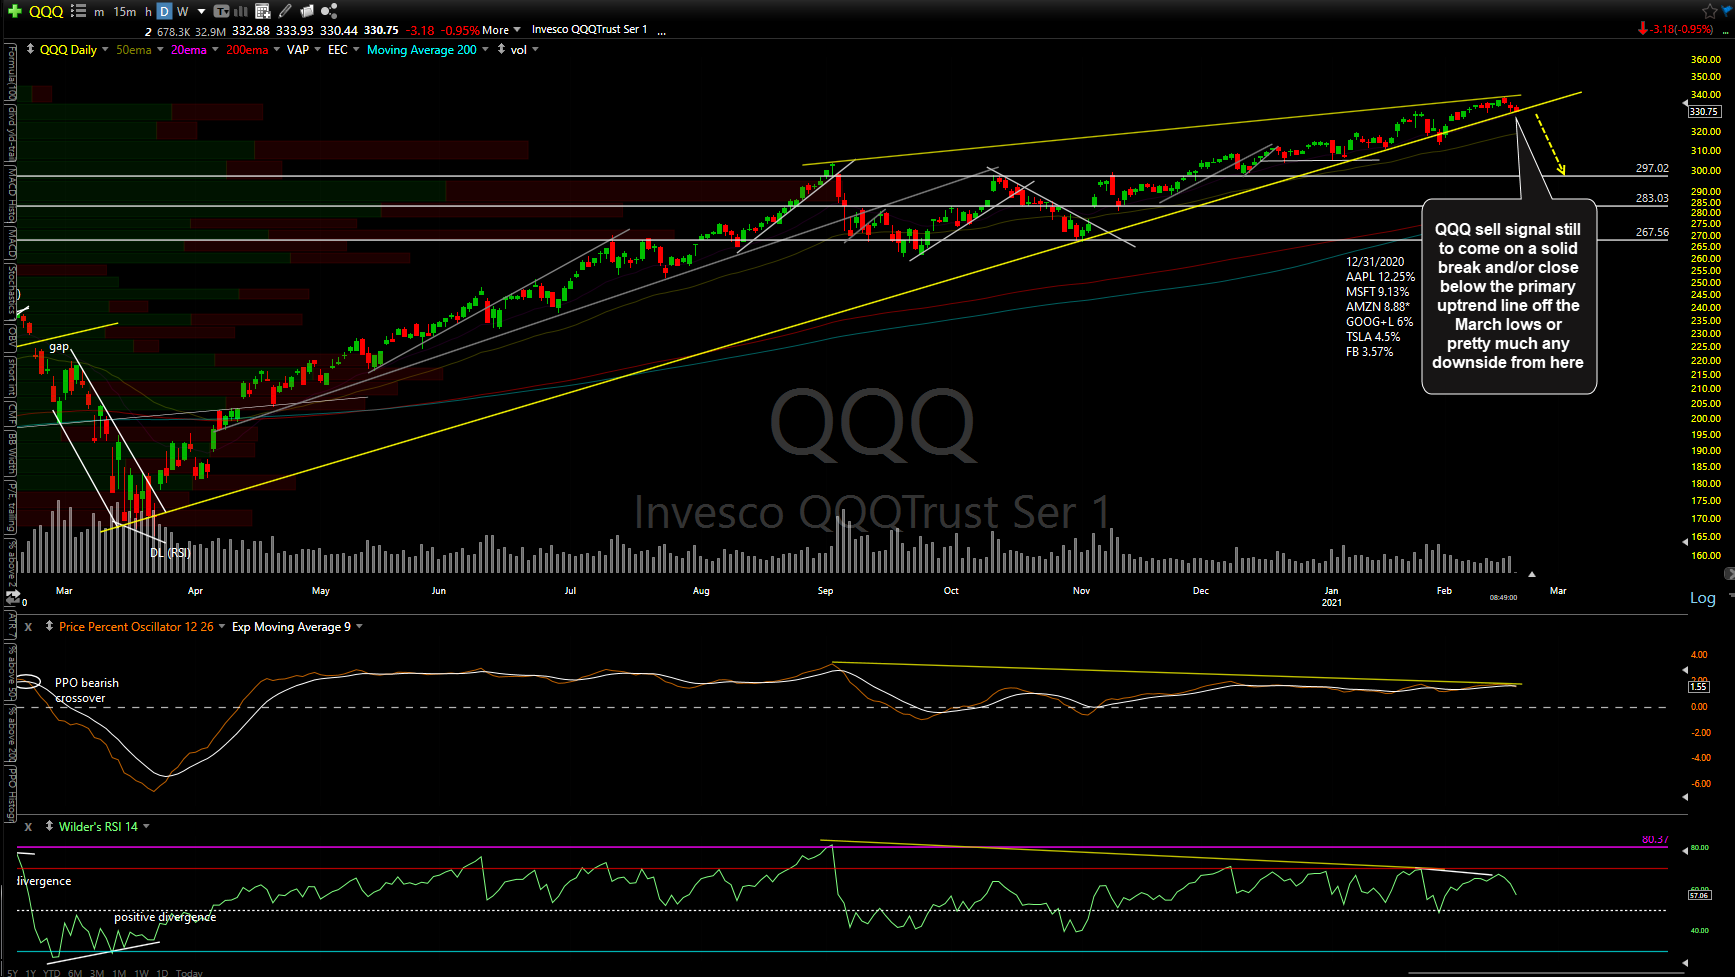
QQQ daily Feb 18th
AAPL (Apple Inc) is approaching my first target (125.75) following the recent sell signal with the next objective short entry or add-on to come on a solid break below it.

AAPL daily Feb 18th
Still awaiting a solid break and/or daily close below the 800ish level to confirm a sell signal on TSLA.
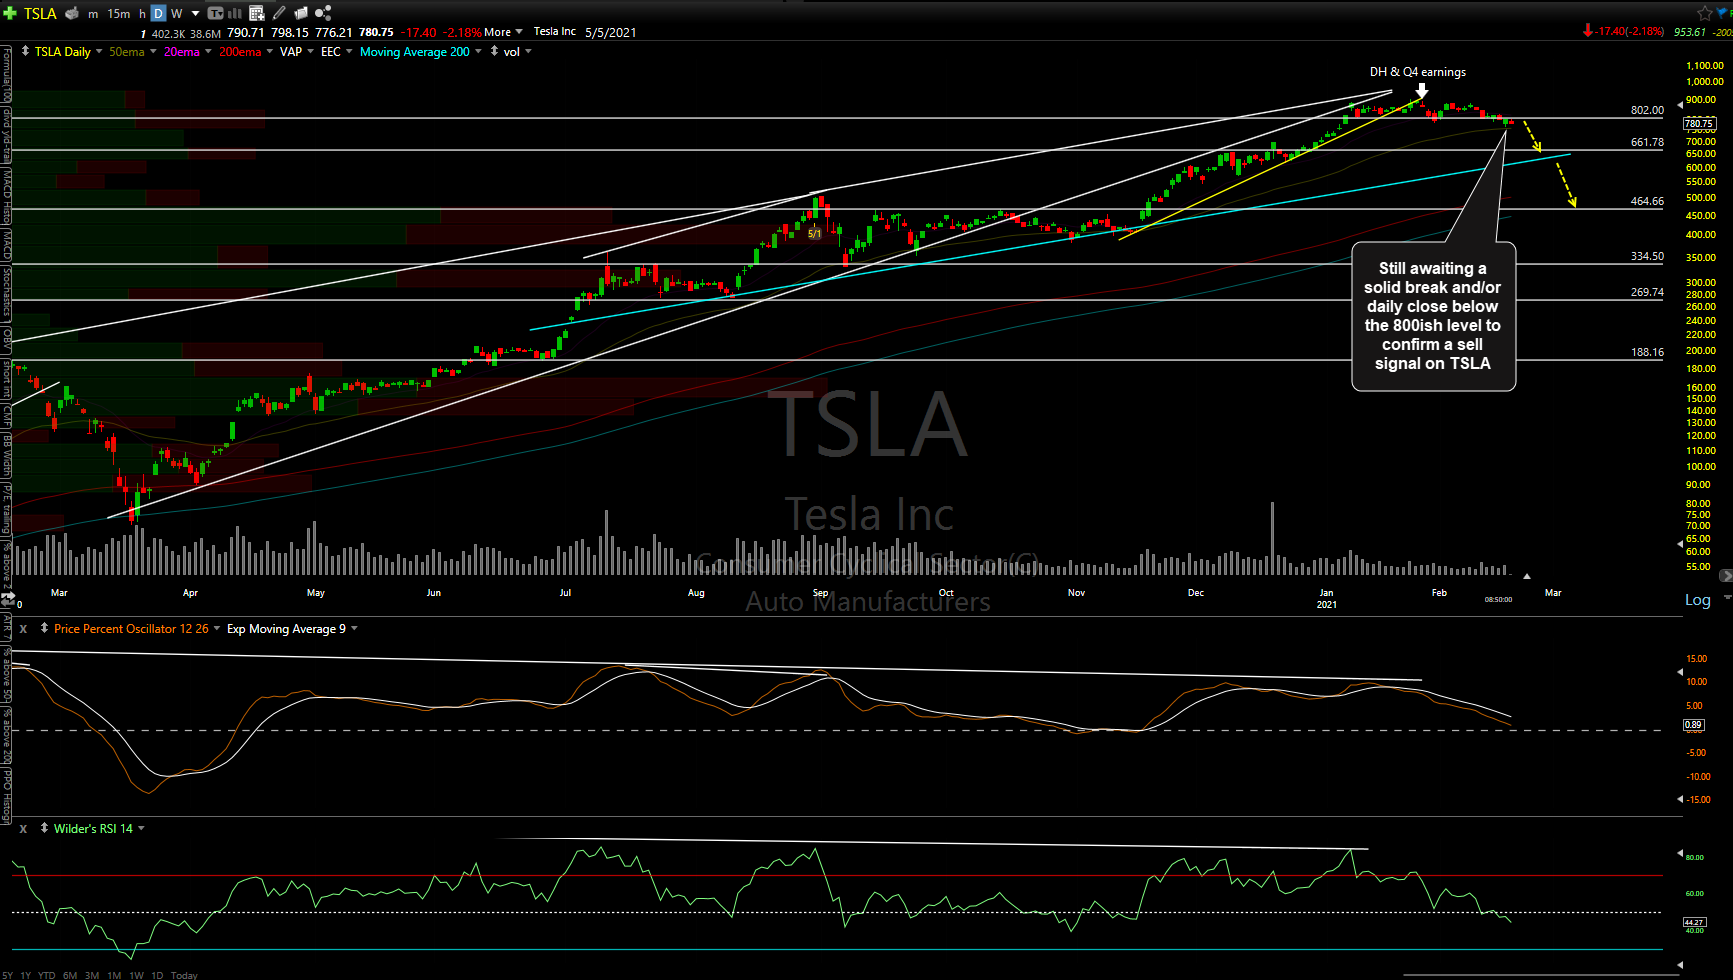
TSLA daily Feb 18th
Bottom line: Cracks are starting to form in the market with the SPY breaking down below the primary uptrend line a couple of weeks ago then backtesting from below & now starting to roll over with a solid sell signal on top-weighted AAPL and TSLA very close to breaking down as well. Should the pending sell signals above soon trigger, those additional cracks have the potential to finally break the dam & trigger a swift correction in the equity markets with some of the biggest losses likely to come from many of the insanely overbought & overvalued low-quality stocks.