
So far, we had a breakout above the wedge/downtrend line & backtest of the minor uptrend line + 297.50ish resistance level in SPY followed by a reversal as forecasted in today’s earlier video.
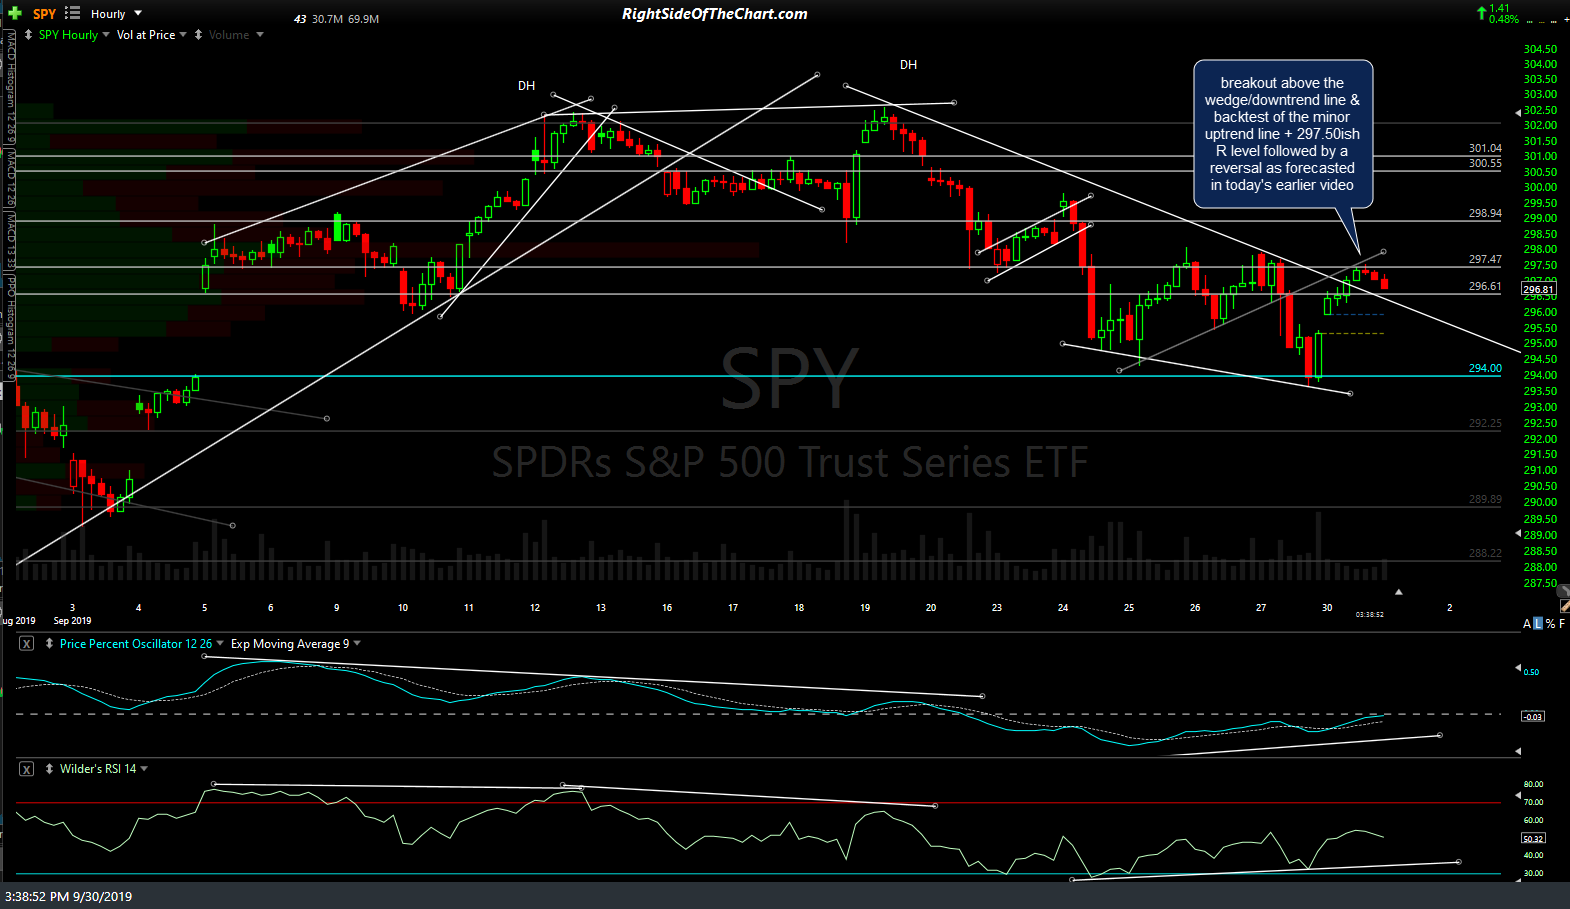
SPY 60m Sept 30th
We also had 4 consecutive 60-minute candlestick breakout failures so far (intraday period break above the downtrend line only to close back on or below it on QQQ as well.
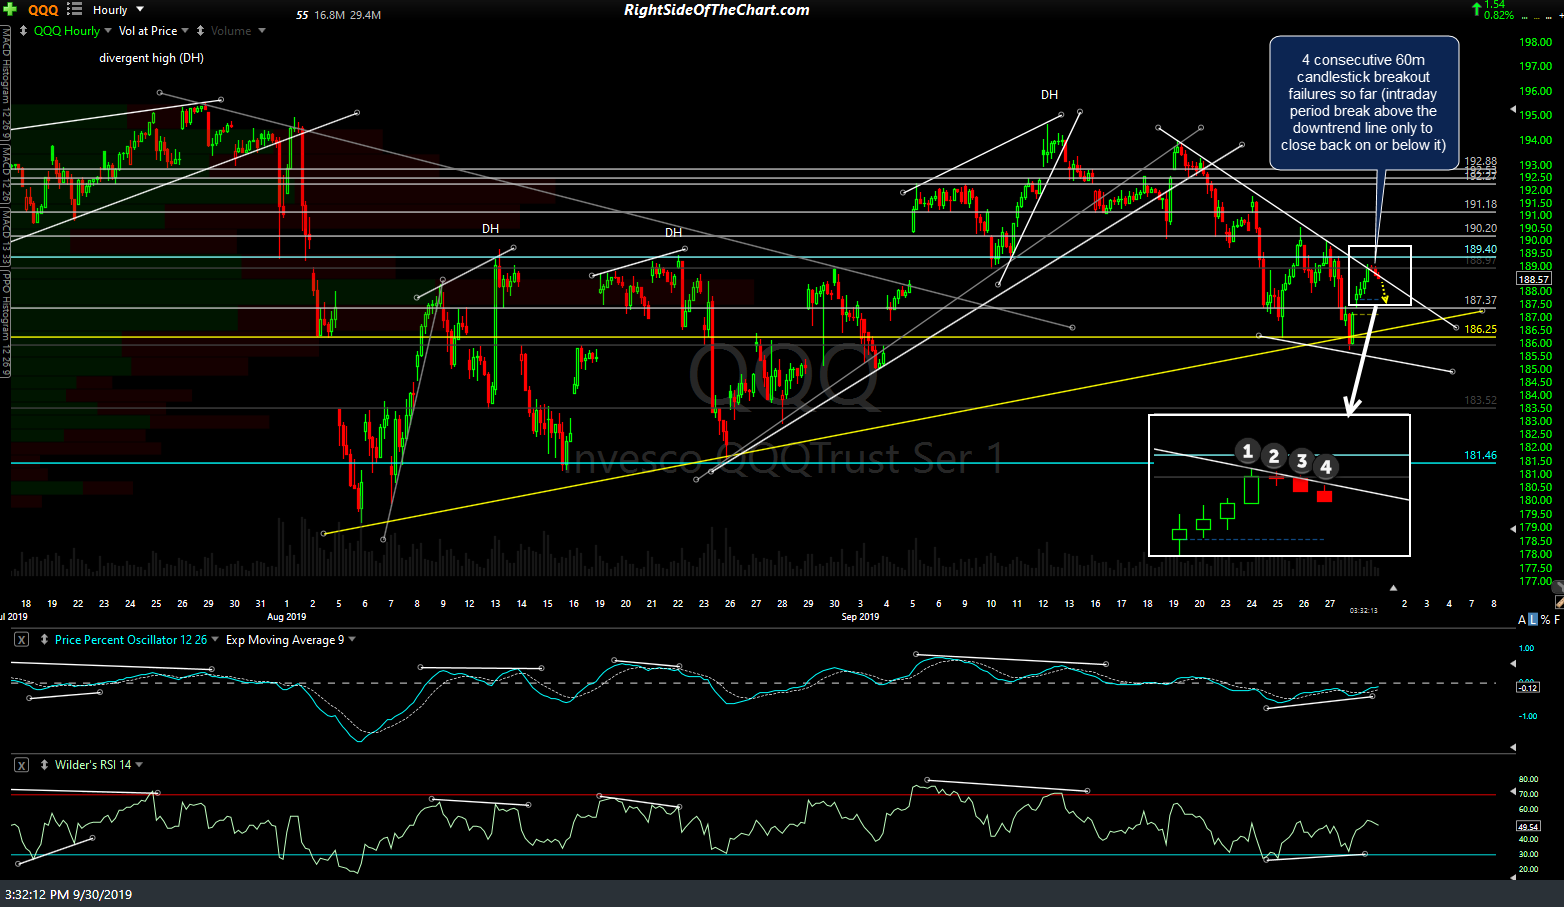
QQQ 60m 2 Sept 30th
Likewise, we had a rejection of the /NQ 60-minute downtrend line with a break below the 7754 S would likely usher in more selling while an impulsive breakout above today’s highs would be near-term bullish.
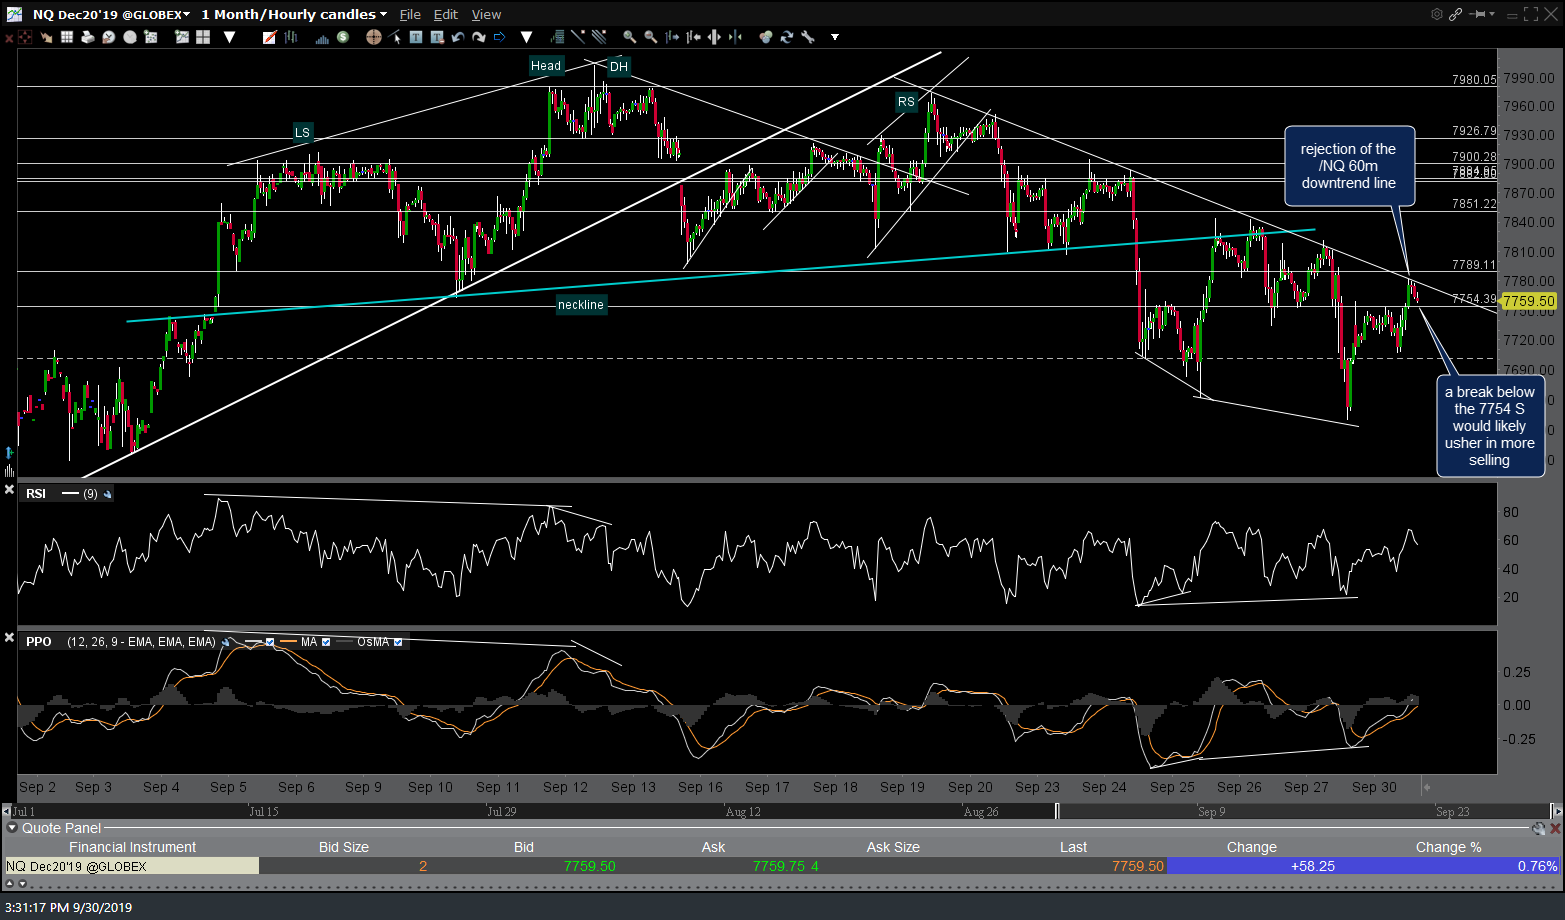
NQ 60m 3 Sept 30th
/ES reversed at the 2984.75 resistance level & intersecting downtrend & uptrend lines on the 60-minute chart.
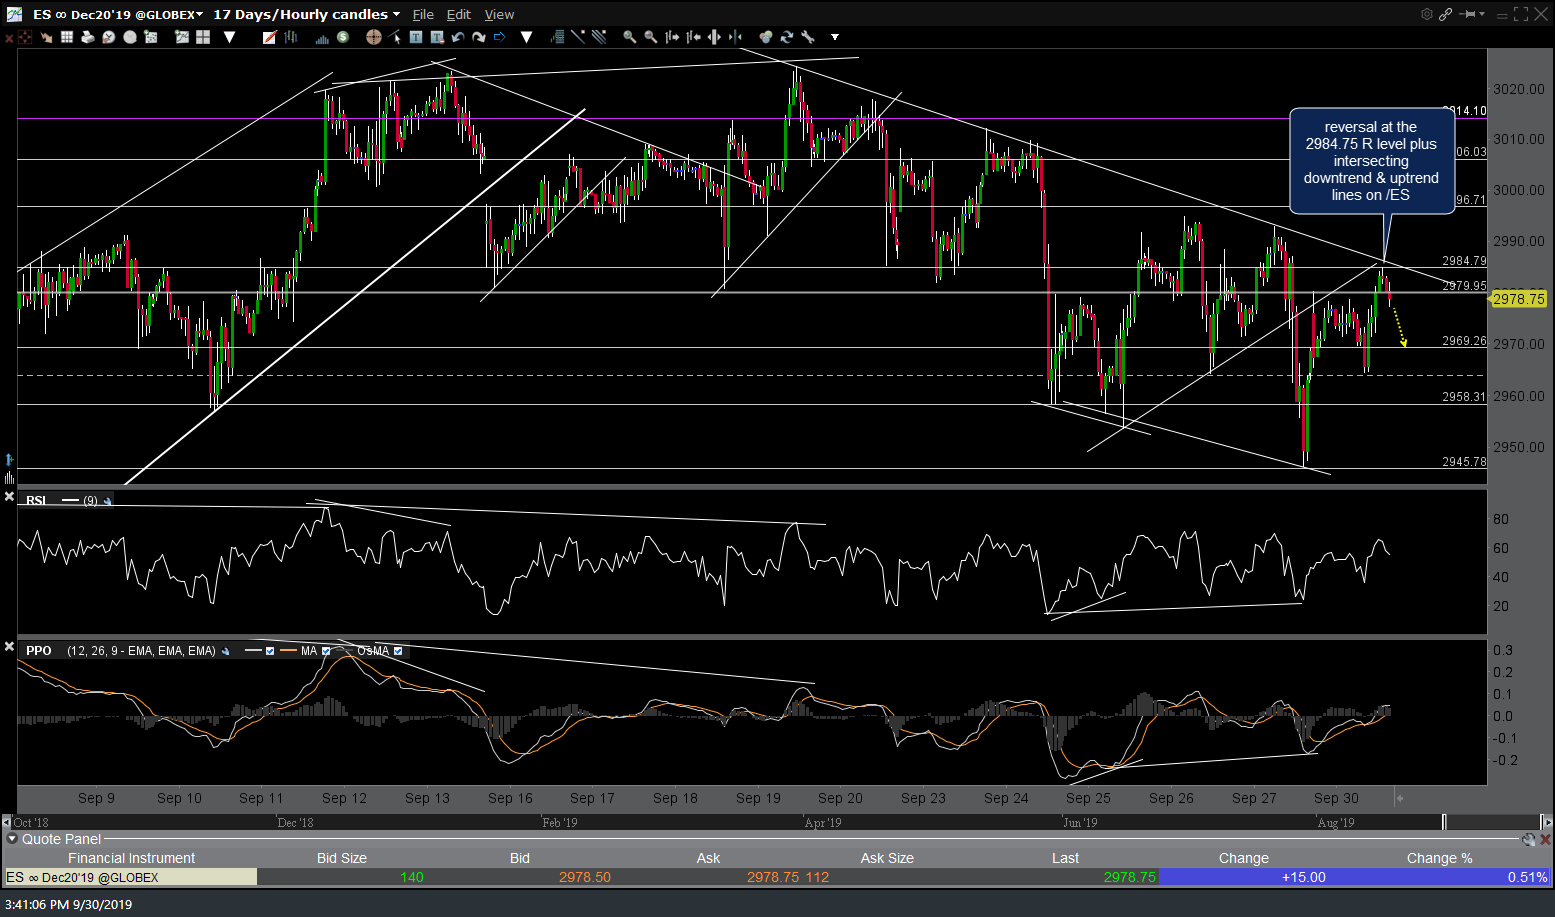
ES 60m 2 Sept 30th
/GC gold reversed just shy of the 1468.25 support just as the stock indexes reversed off those resistance levels highlighted in the video earlier today.
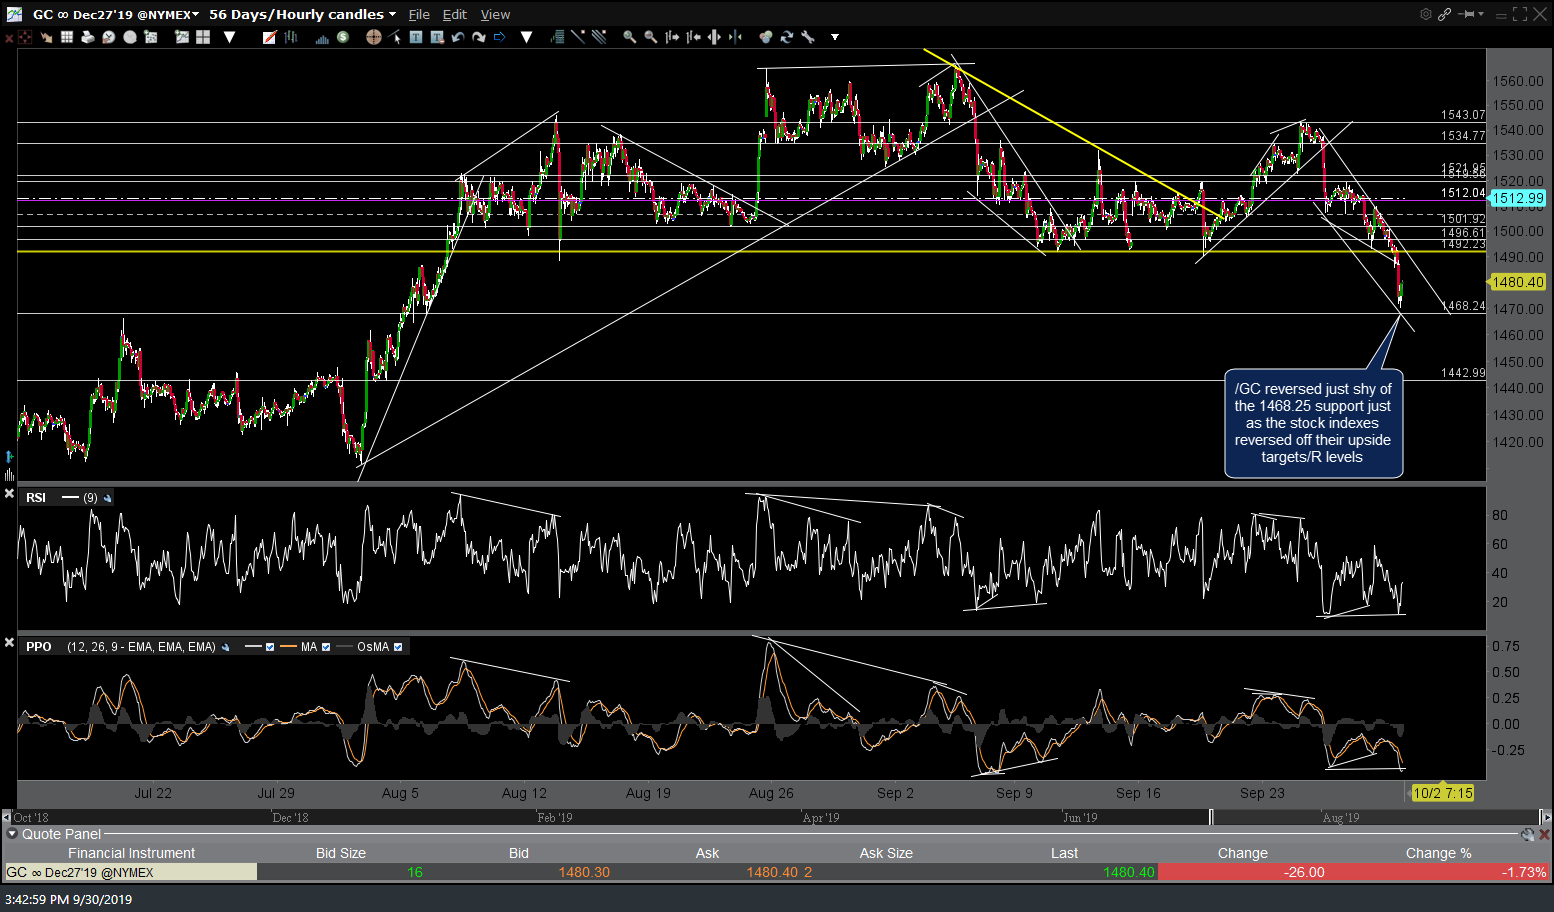
GC 60m 3 Sept 30th
/SI silver reversed just shy of the 16.942 support level with the bullish divergences still intact. Any additional test of that level soon will still provide an objective long entry with stops somewhat below (particularly if /GC breaks support as well). Other than pullbacks to the 16.94ish S level, a break above this downtrend line will offer an objective long on /SI.

SI 60m 3 Sept 30th