
The charts below are all 60-minute time frames of the major stock index, gold, & crude oil futures. /NQ is currently testing downtrend line + 12950ish price resistance following the divergent low which coincided with the tag & reversal off the 297 support/target on the QQQ daily chart. A solid break above this level along with a breakout above the downtrend line in /ES (below) should open the door to more upside to the next resistance levels above while a rejection here could mark the end of a counter-trend rally of a larger downtrend off the Feb 15th divergent high with more downside still to come.
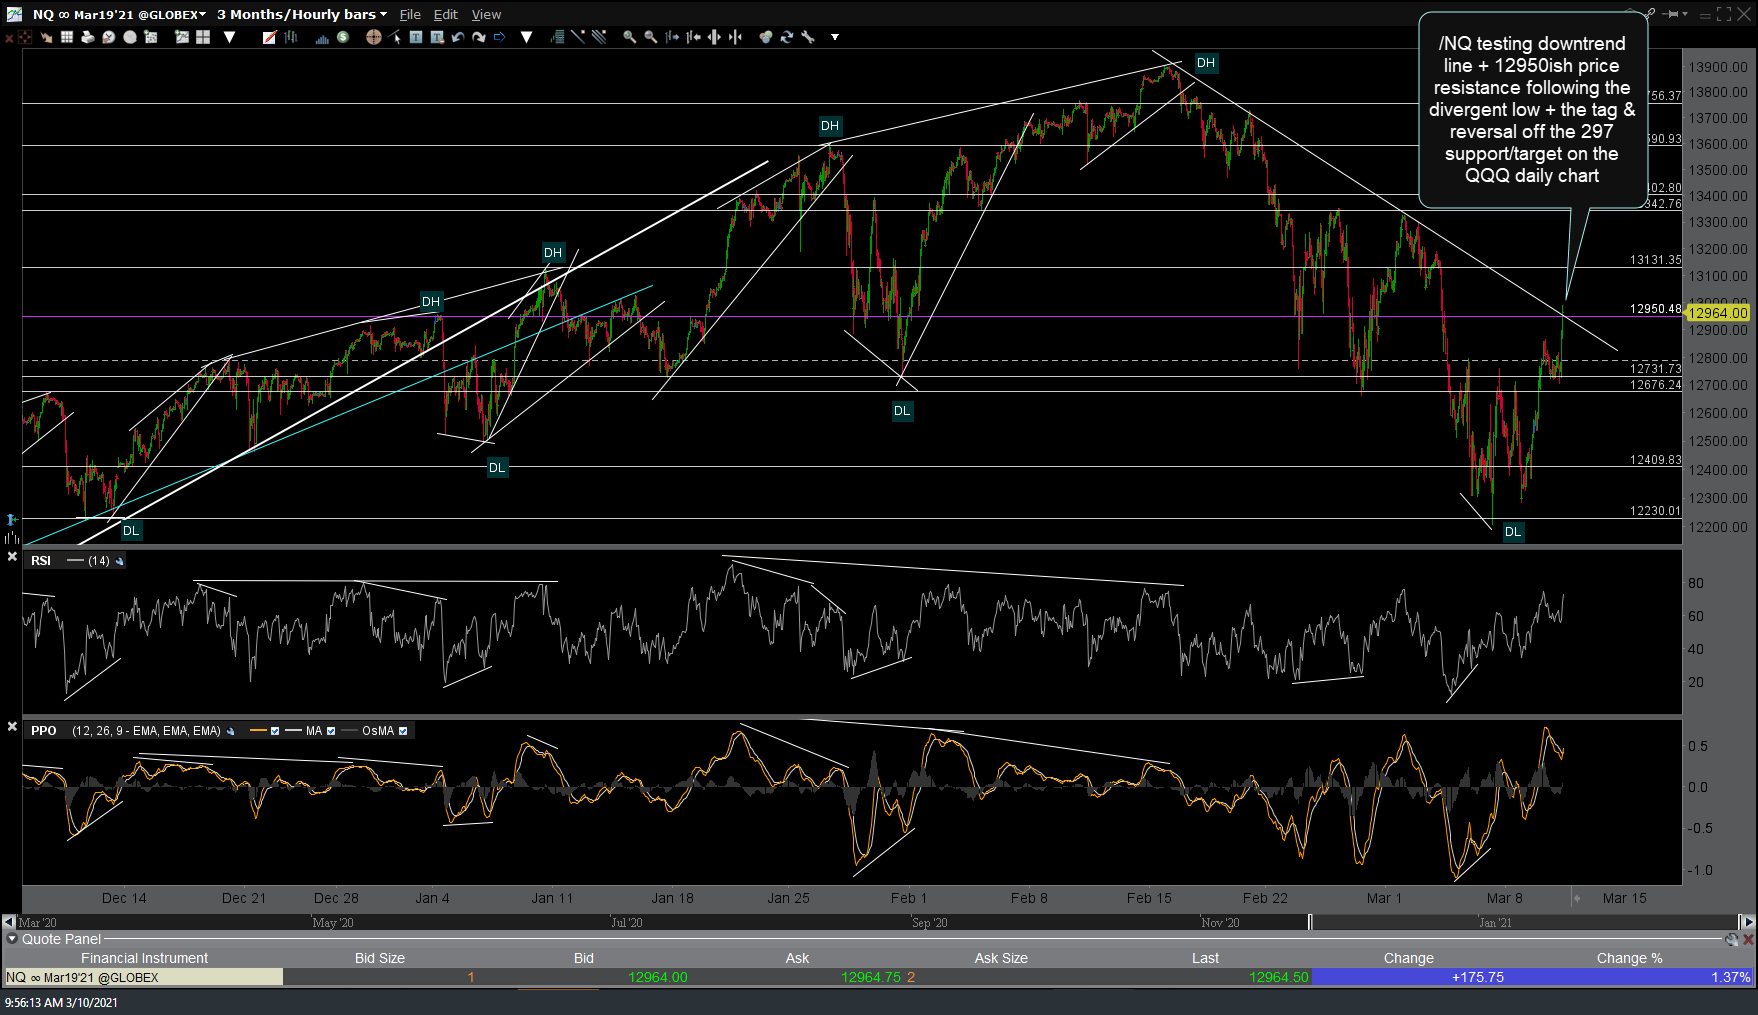
NQ 60m March 10th
As with /NQ, /ES is also testing its minor downtrend line (resistance) off the Feb 15th divergent high.
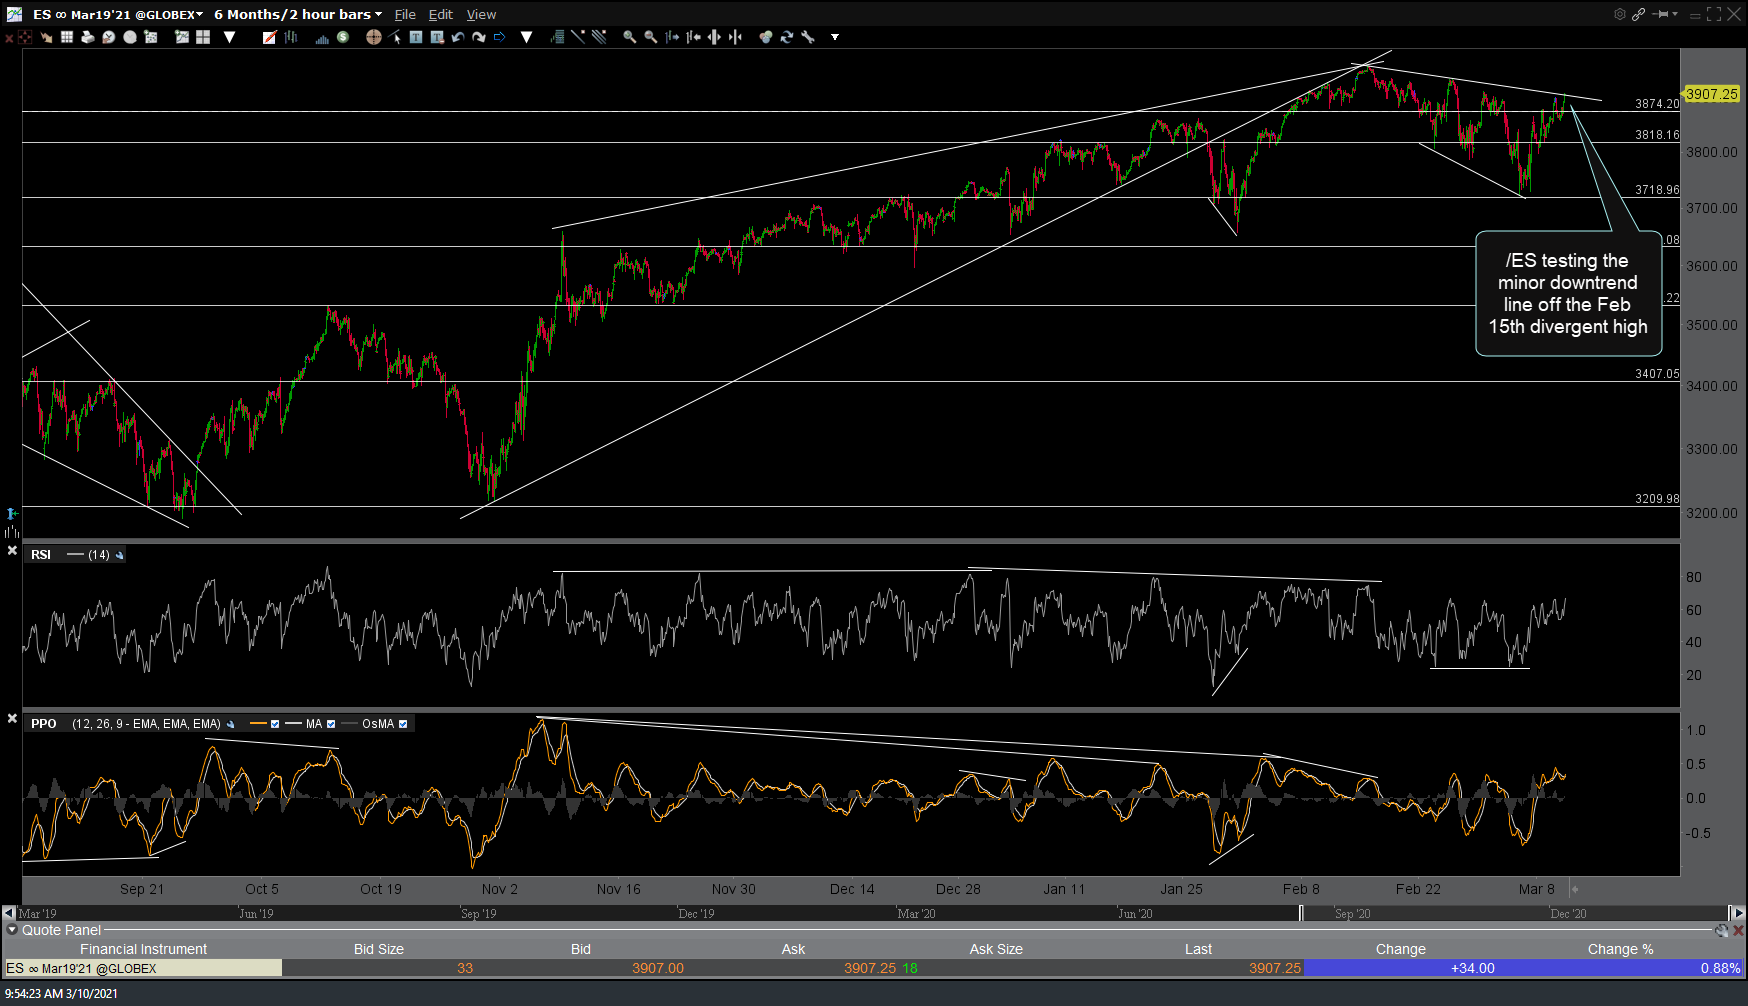
ES 60m March 10th
/GC (gold)is still offering an objective long entry or add-on following the recent falling wedge breakout & the more recent breakout & backtest of the 1707ish support/resistance level.

GC 60m March 10th
/CL (crude oil) is still holding above the 63.70 support with the next sell signal to come on a solid break below the recent reaction low. Updates on the comparable ETFs will follow later today.
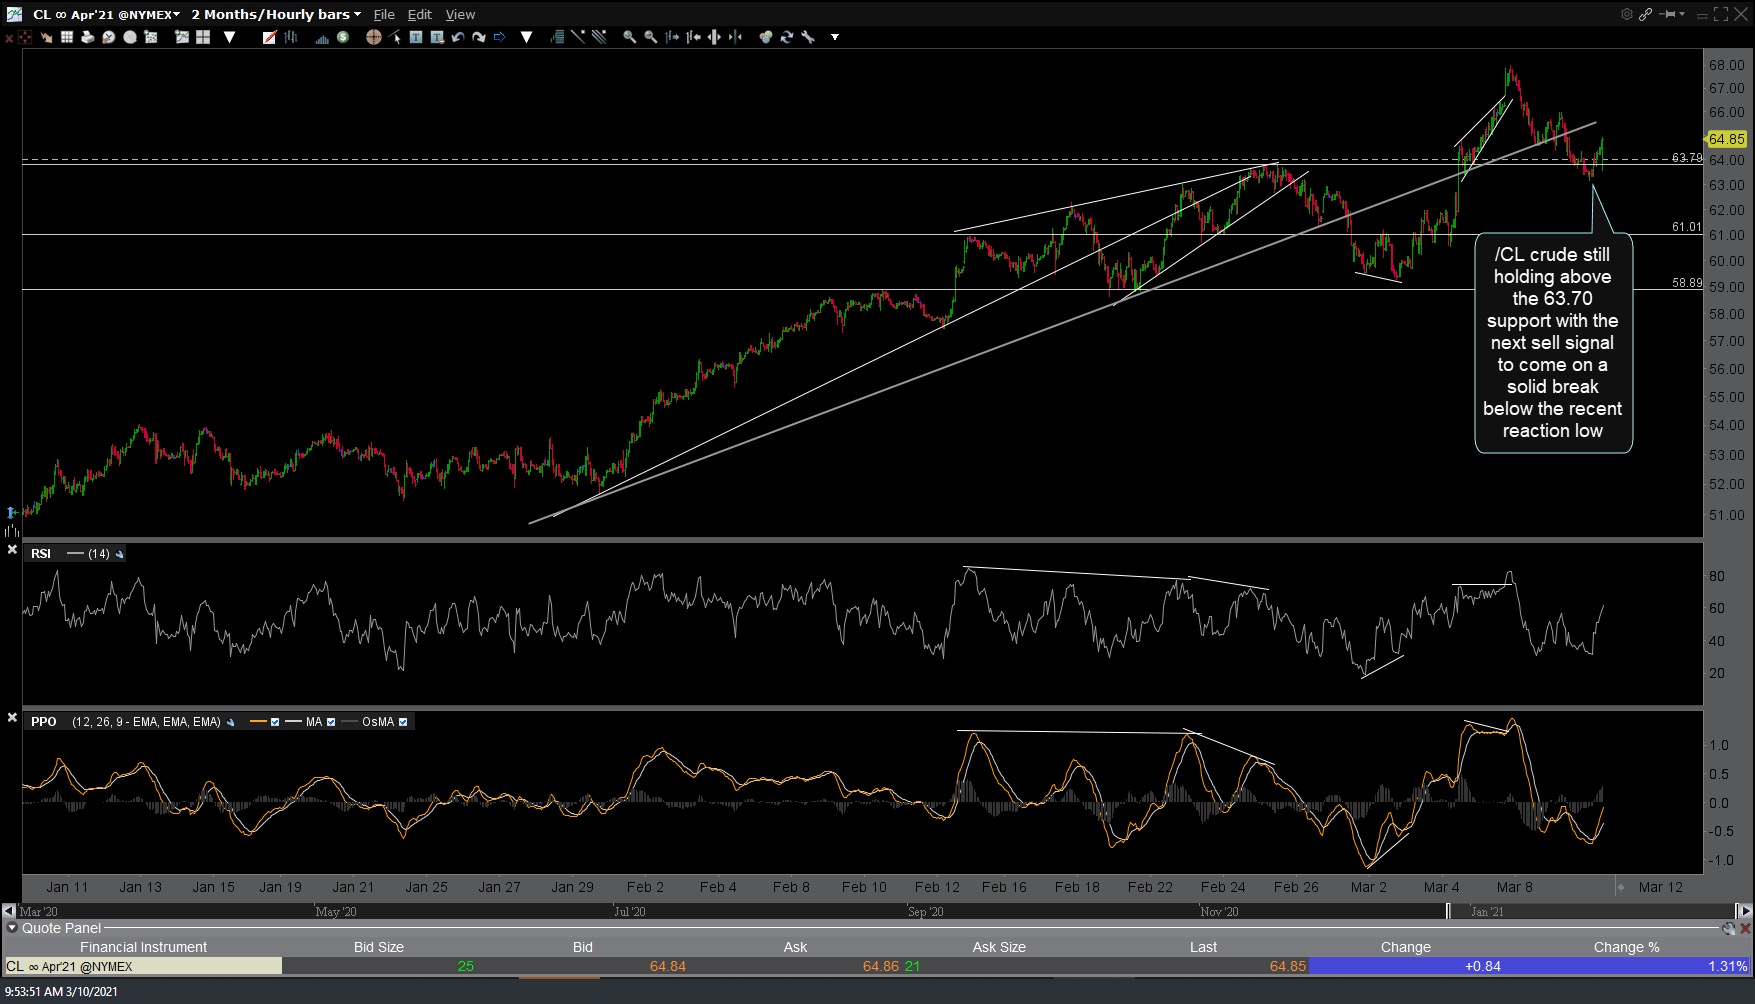
CL 60m March 10th