
/NQ (Nasdaq 100 E-mini futures) remains the strongest of the US stock indices, due to the overweighted concentration in technology stocks. /NQ made a marginal new high (above the Dec 27th previous reaction high) although the negative divergences & extreme overbought conditions remain intact for now. As such, a break below this minor uptrend line is likely to trigger another wave of selling /NQ following the initial leg down off that Dec 27th high & subsequent larger uptrend line break.

NQ 60m Jan 2nd
On a related note, AAPL remains within the price channel highlighted in this post last week, still solidly within an uptrend without any sell signals at this time. As one of the top components of the Nasdaq 100 with an 11% weighting in the index, any breakdown or sell signals on /NQ will most likely need to be confirmed with a convincing breakdown below the price channel on AAPL to increase the chances of anything much more than a mild 1-2% pullback.
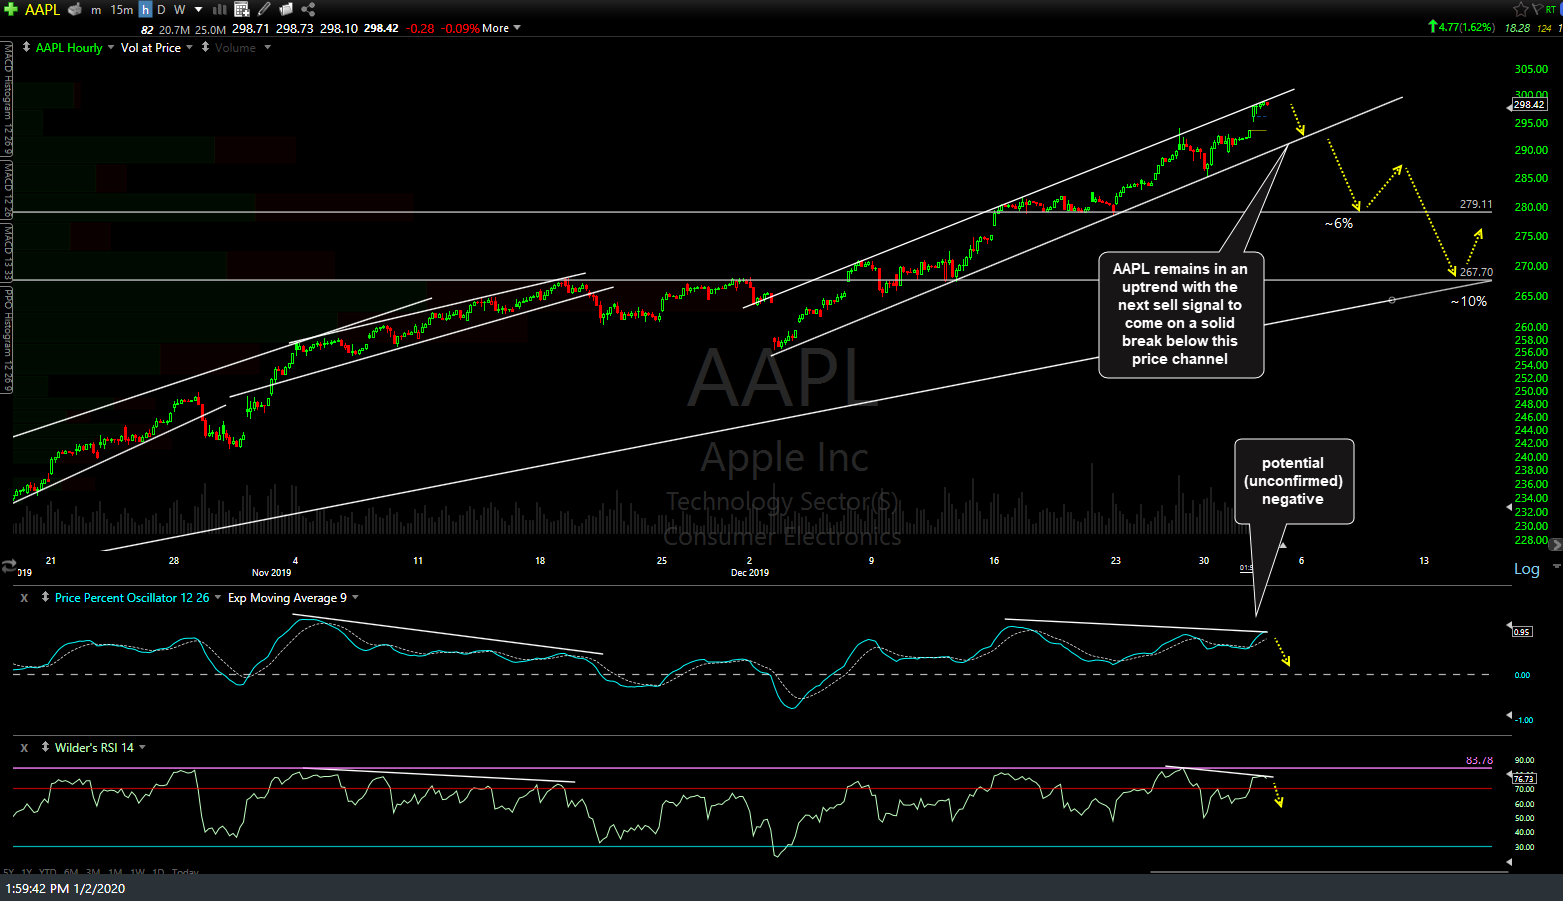
AAPL 60m Jan 2nd
/ES (S&P 500 futures) broke minor uptrend line support following the recent divergent high, increasing the odds for more downside in the coming days/weeks although that will contingent on a breakdown & correction in the /NQ soon as well.
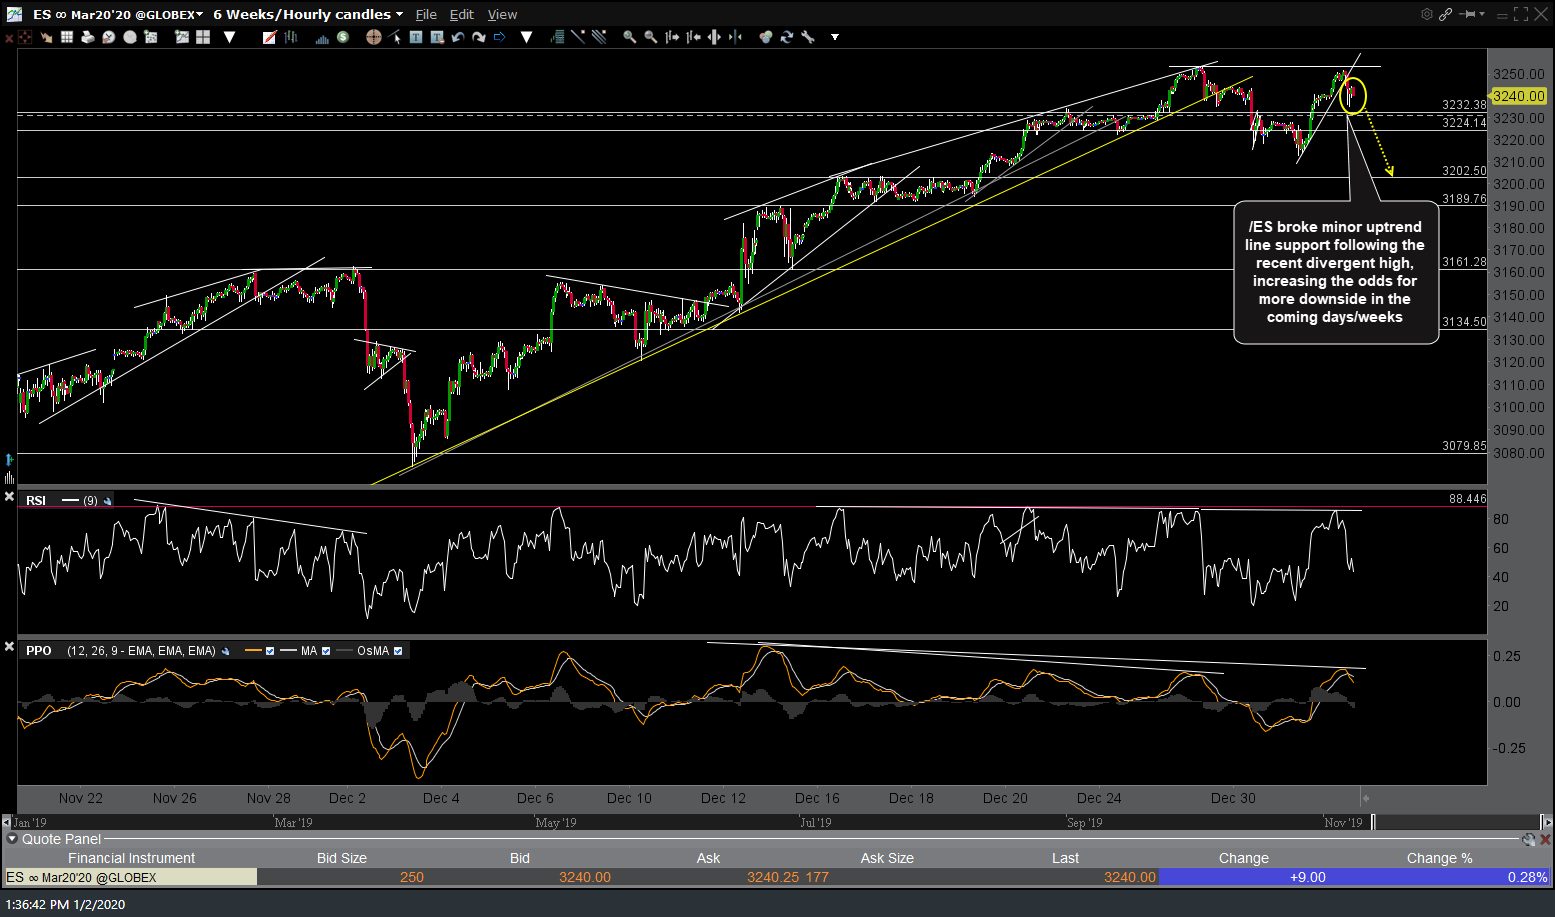
ES 60m Jan 2nd
The small positive divergences highlighted earlier this week played out for a small rally on /RTY (R2k Small-cap futures) which has ended with an impulsive reversal so far today. /RTY momo-fueled overshoot of the 1659.40 support although still trading below (support, once broken, becomes resistance). Whether or not /RTY regains the 1650.40 resistance level and rallies from there is likely to depend on whether or not the large-caps are able to burn through the existing divergences & continue to rally from here or not.
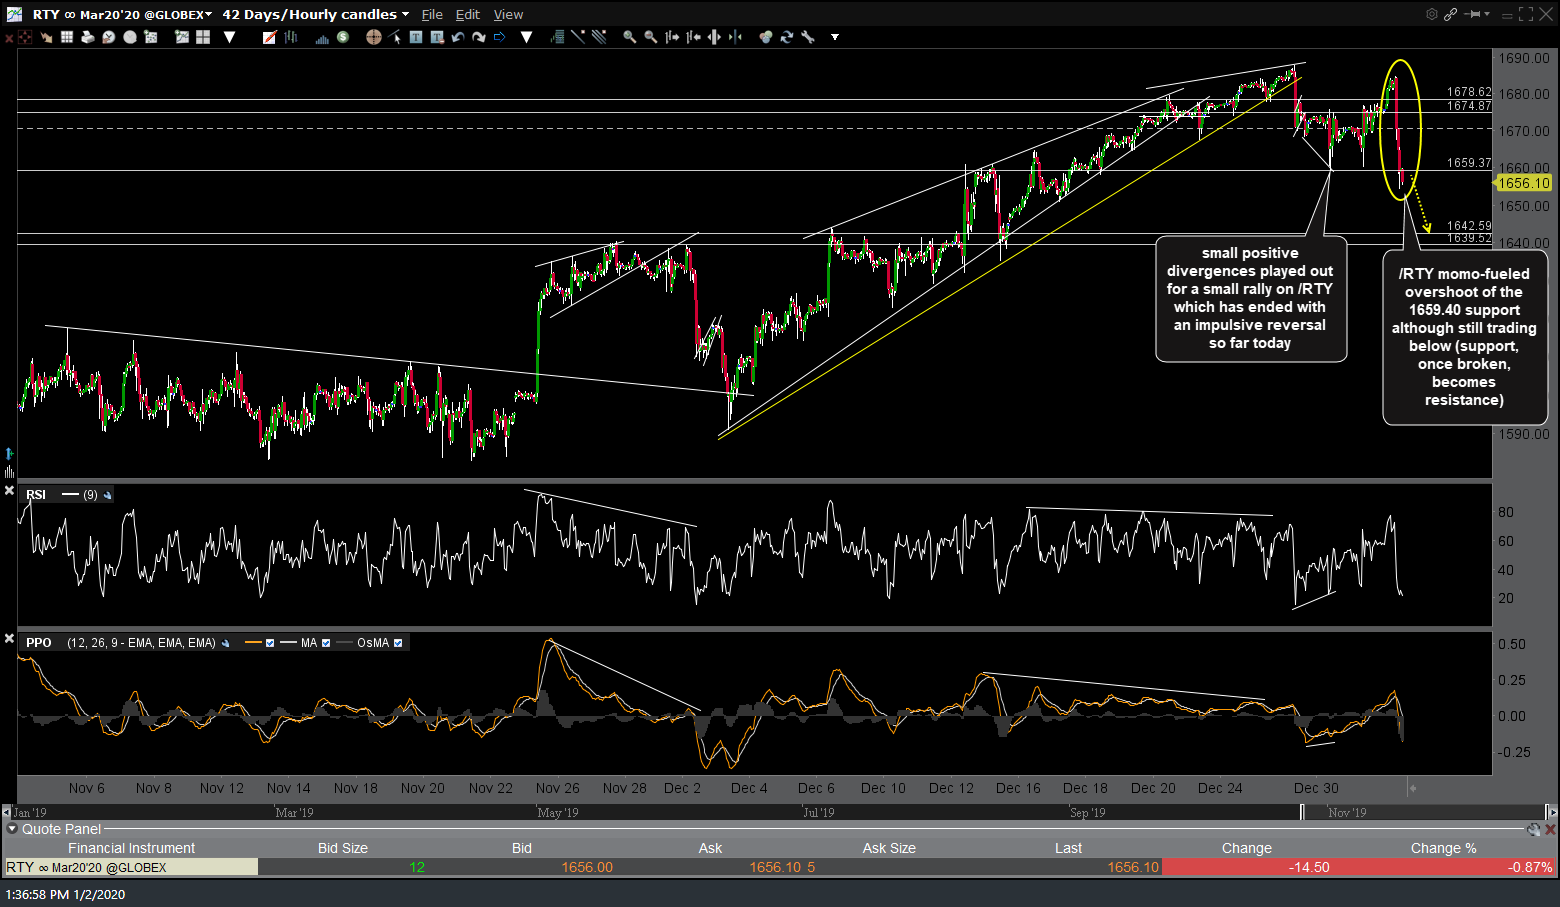
RTY 60m Jan 2nd
Bottom line: As we kick off the first day of trading in 2020, the primary trend remains bullish while the recent short-term sell signals triggered via breakdowns on the 60-minute index charts are still valid for now although this kickback rally is starting to stretch the upper-limited of a typical counter-trend bounce, especially on the tech-heavy Nasdaq 100. Add to that, the market has had a voracious bid for months now, with most 60-minute divergences playing out for a relatively mild correction in either time and/or price before the next leg higher.
The market-leading FAAMG stocks continue to do the bulk of the heavy lifting with most in or near nosebleed territory regarding overbought levels on the daily & weekly RSI so I’ll be monitoring the charts of those 5 companies closely going forward. As of now, I don’t see any sell signals or signs or reversal on any of the 5 FAAMG stocks, just trendlines & price support levels to watch for potential breakdowns.